In two earlier posts about Union Pacific’s capital expenditures (first, second), we looked at the details of what projects the company has been funding. After this review, we found that it is probably spending more on maintenance capital expenditures than we thought, so is less profitable on an Owners’ Cash Profit (OCP) basis.
However, it also looks like our original estimate for Expansionary Cash Flows (ECF) (i.e., investment spending) for the company was too high. We had taken a 10-year average, but the first five years or so reflected a period during which the company was much less profitable (so ECF as a percentage of OCP was elevated) and the second five years reflected a period during which the company was spending heavily to modernize its locomotive fleet.
This article explains our process for recalibrating our forecasts for investment spending and triangulates our answer by looking at the investment spending of Union Pacific’s only true competitor, Burlington Northern Santa Fe (BNSF).
To find the level of growth capex, recall back to the diagram in the last article, where we found that for most of the company’s history, the company spent about $0.50 in growth capex for every dollar it spent for maintenance capex.
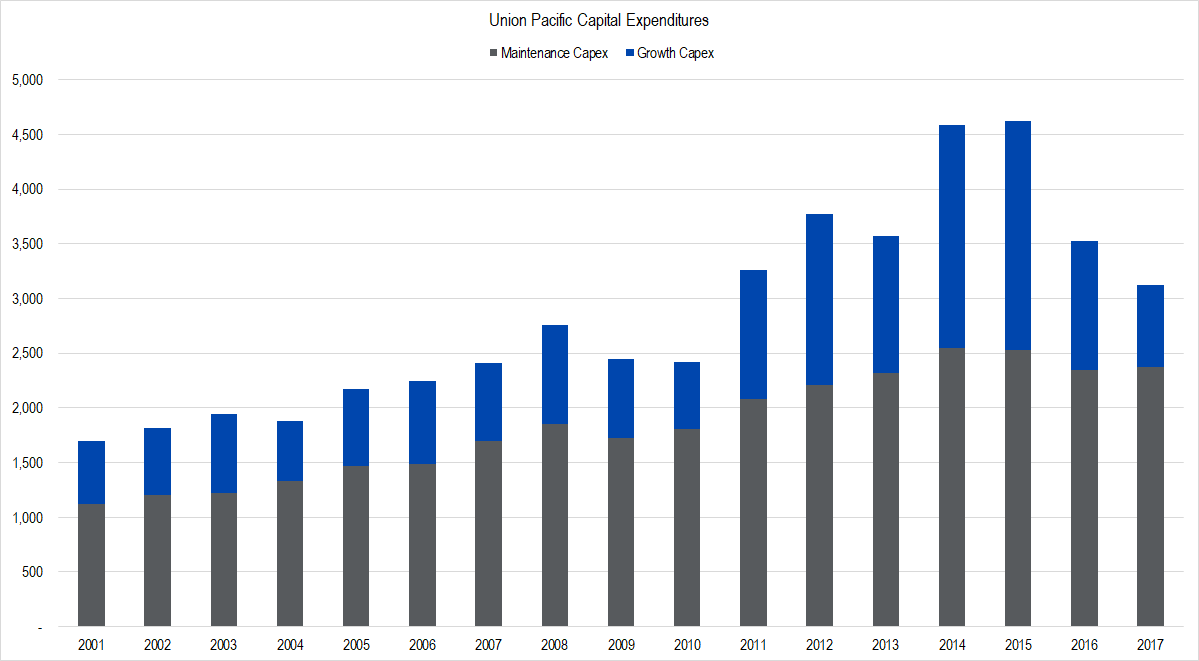
Figure 1. Source: Company Statements, Framework Investing Analysis
To get our bearings, we looked back at money spent on maintenance capex versus both OCP and revenues.
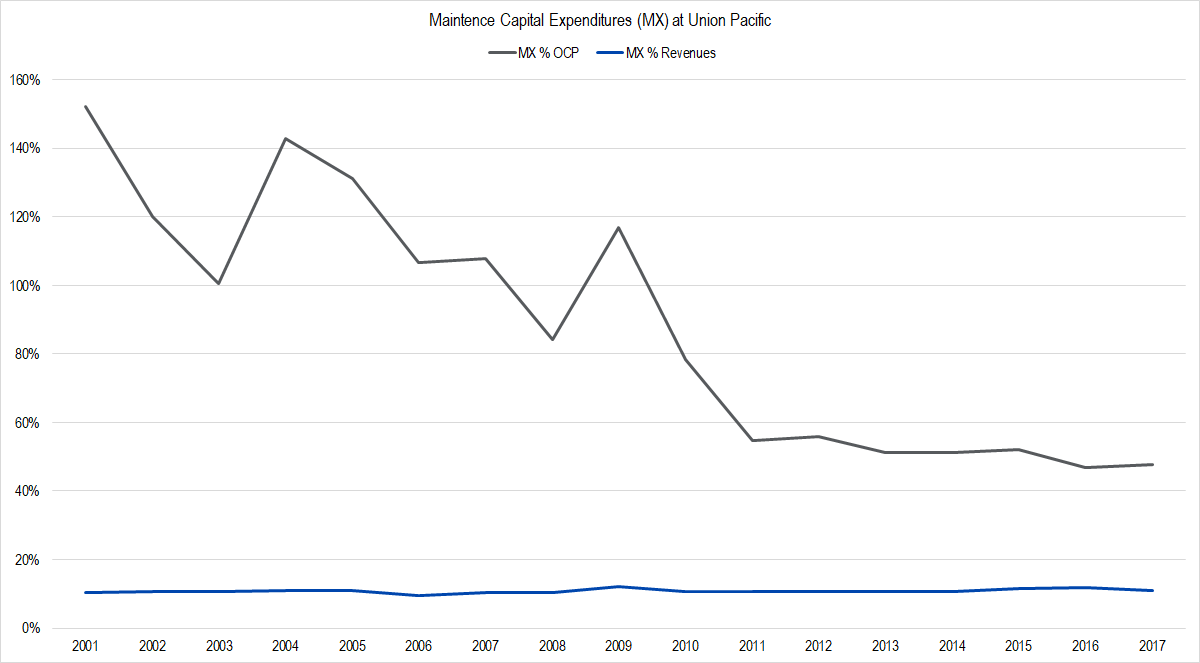
Figure 2. Source: Company Statements, Framework Investing Analysis
The downwardly-sloping gray line above reflects the massive improvement in profitability at Union Pacific since 2001. As the company became more profitable, the proportion of profits the firm had to spend to maintain its business became less. Since 2011, the line has flattened out at around the 50% mark, meaning that the company has spent roughly half its profits on capital projects to maintain its business.
The very steady blue line, representing the proportion of revenues spent on maintenance capex, looked more steady, so we zoomed in on it.
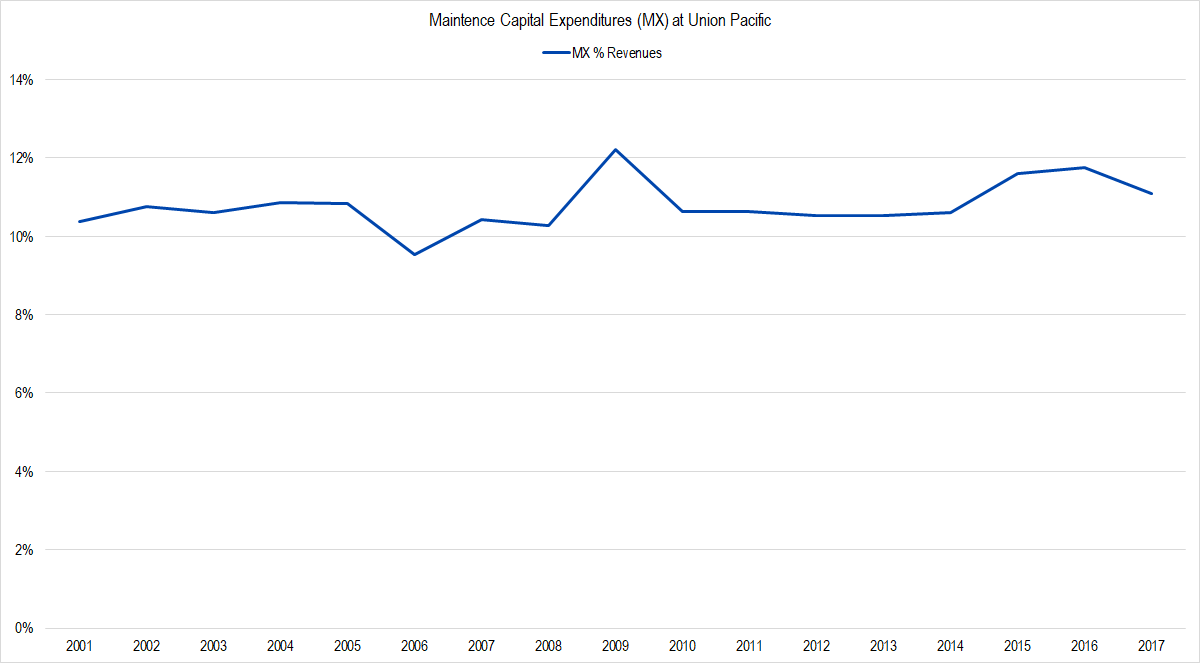
Figure 3. Source: Company Statements, Framework Investing Analysis
Viewed as a proportion of revenues, maintenance capex has held pretty steady at around 11%.
Discovering this, we can say that growth capex will probably come in at around 5% of revenues. Assuming that the proportion of profits used for maintenance capex stays steady at around 50%, we can further assume that growth capex will run at about 25% of OCP.*
This figure of 25% of OCP represents our new forecast for Net ECF as a proportion of OCP, down from our prior assumption of 45%. This is a large drop, but keep in mind that we also lowered our view of how efficiently the firm was converting revenues to profits, so the new 25% does not compare directly to the old 45%.
After finishing up with this analysis, I realized that Burlington Northern Santa Fe — the railroad owned by Berkshire Hathaway — still publishes annual reports. These two railroads are directly comparable since they are the oligopoly providers of rail transport in the Western U.S. BNSF’s network has more of a northerly focus and Union Pacific’s has more of a southerly one, but there is a good bit of overlap between the two.
I first compared UNP’s profits to those of BNSF’s**:
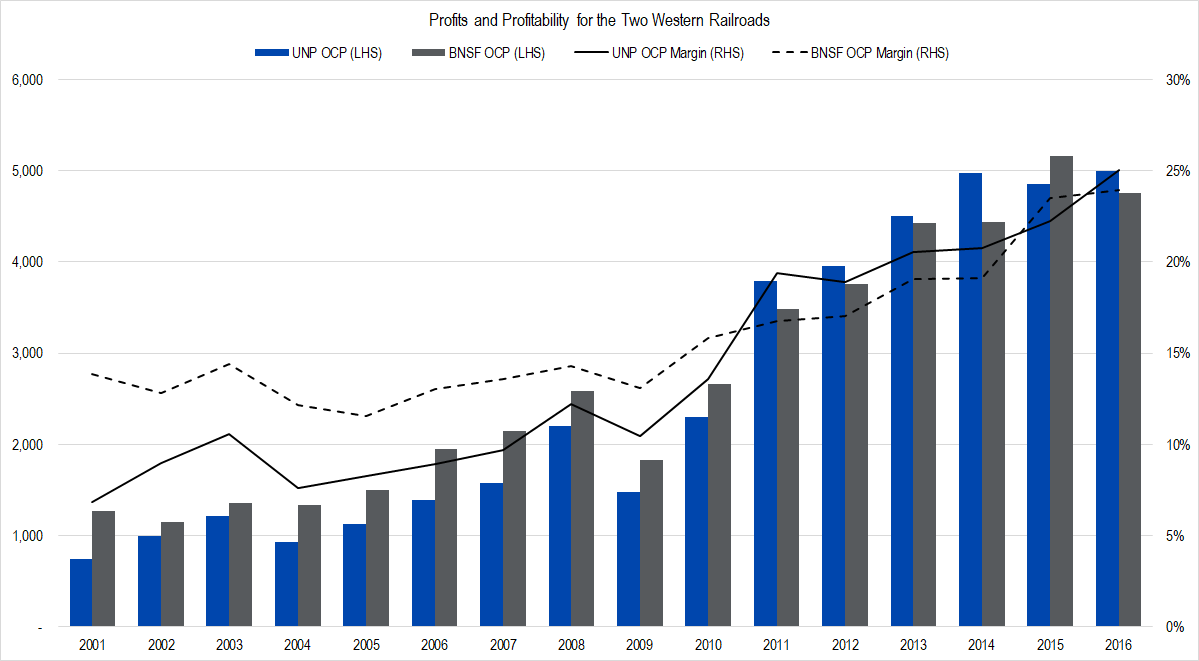
Figure 4. Source: Company Statements, Framework Investing Analysis
Keep in mind that Buffett agreed to buy BNSF in 2009 and the deal closed early in 2010. Notice that in terms of profit conversion, BNSF is clearly the better company for the 2001 – 2010 time period. However, UNP’s profits caught up and then some. It will take more analysis to figure out the root cause of the discrepancy, but it is interesting that Buffett seems to have bought the railroad that at the time looked better but which had less potential.
The surprises continued when I calculated BNSF’s Free Cash Flow to Owners (FCFO) and compared them to UNP’s.
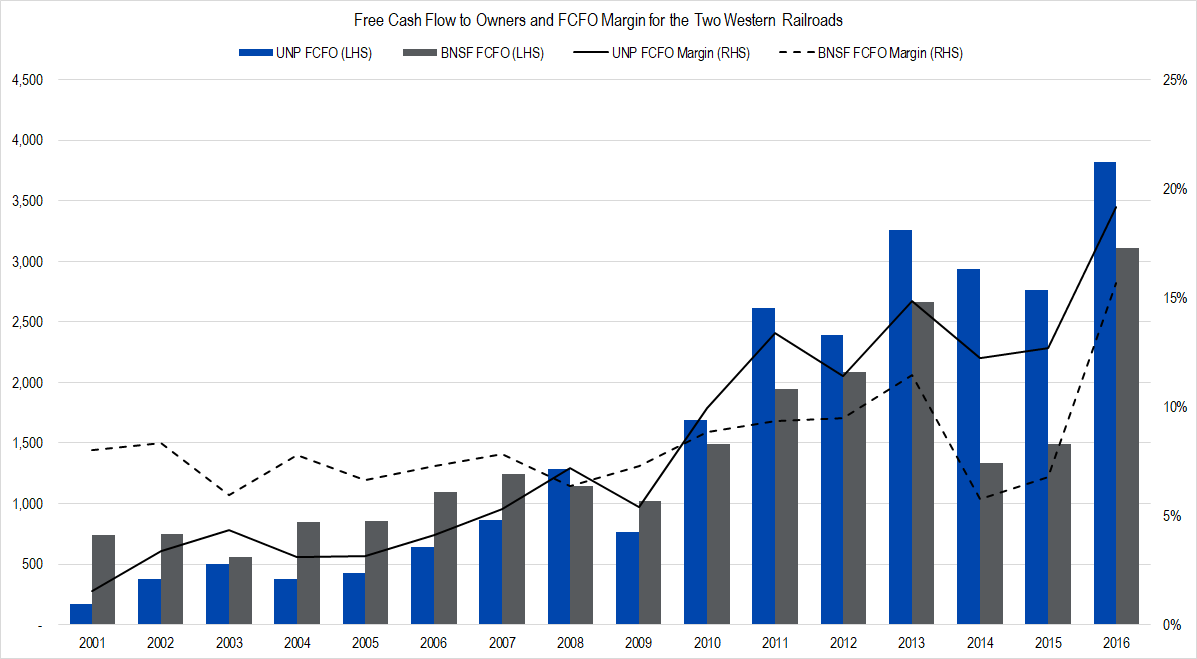
Figure 5. Source: Company Statements, Framework Investing Analysis
From this graph, it is obvious that BNSF has been spending a much larger proportion of its profits on investments than has UNP. Again, we will need to do more research to understand this discrepancy, but the difference is material and surprising.
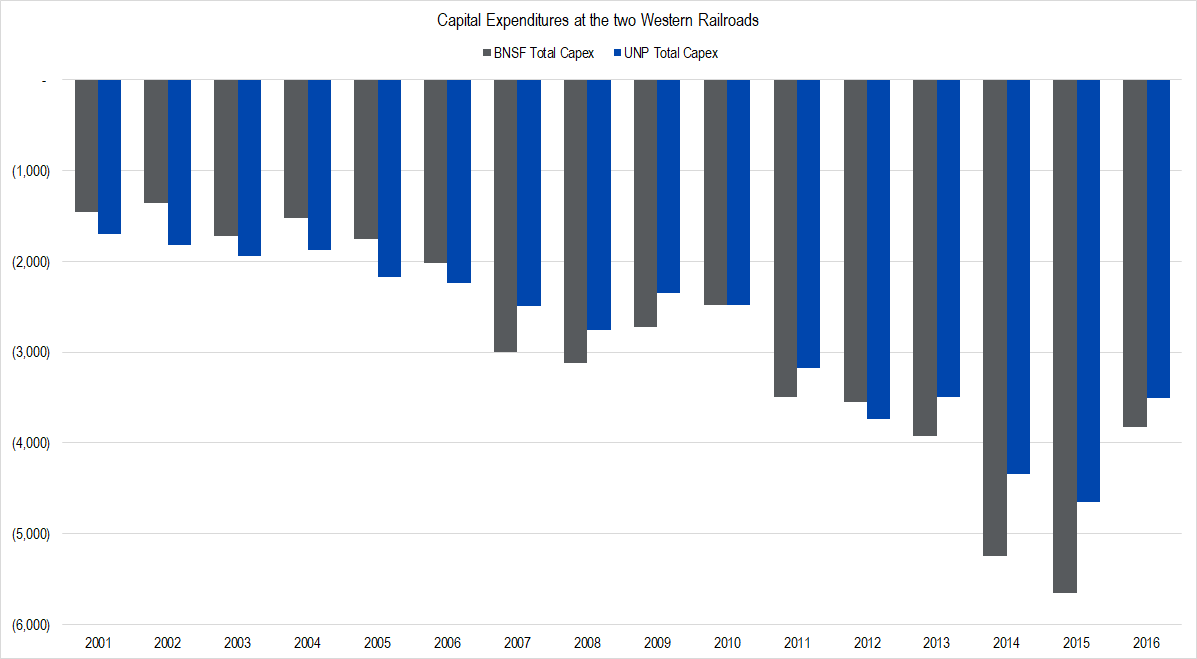
Figure 6. Source: Company Statements, Framework Investing Analysis
Put in terms of percentage of revenue, through 2008, the company spent about the same amount as did Union Pacific — averaging 16%. However, from 2009 onward, the company has been spending much more — 19% of revenues on average compared to UNP’s average of 17% over this time.
Since 2009, BNSF has spent more on capex than UNP every year but two (2010, 2012); in 2010, UNP outspent BNSF by $4 million and in 2012, it outspent BNSF by $190 million. In aggregate, BNSF has spent $3.1 billion more than UNP, in fact.
This brings up an interesting possibility. Namely, Burlington Northern, free of the pressure to satisfy short-term investors, may have spent more on its facilities after Buffett’s purchase. UNP, still driven by the imperative to satisfy Wall Street, has been spending less on investments and instead has been using cash to buy back its own stock — even going so far as to borrow money to do so.
The other possibility is that BNSF has simply gotten inefficient with its capital allocation and / or underspent on investment in the years prior to the Buffett purchase.
If the former is true, this has implications on the possible growth rate of UNP’s future cash flows. If the company has been underspending on necessary improvements and instead increasing its balance sheet leverage, this choice may have severe repercussions during a downturn (for those of you who believe downturns are possible any more…).
If the latter is true, Buffett simply bought the wrong railroad — overpaying for BNSF, when UNP — a weaker competitor but one with more potential for improvement — was also available.
We will do some more research and incorporate our findings into our valuation model.
Notes:
* When asked about capex levels at the firm on an earnings call, a manager said that modeling capex spend at around 15% of revenues was generally about right. This also triangulates pretty well with what we found. Because we split maintenance capex from growth capex, it took a little bit of doing, but we cross-checked our explicit period assumptions for all-in capex spend and it works out to be around 15% for each forecast year.
** BNSF does not provide as much detail in its 10-K as UNP does regarding categories of spending, so I have used inflation-adjusted Depreciation & Amortization as a proxy for maintenance capex.
Erratum:
Our original article included a miscalculation of BNSF’s 2013 spending due to a data entry error. BNSF spent a total of $3.1 billion more than UNP during the post-2009 period as stated in this revision rather than $4.9 billion more as originally stated. Diagrams have also been updated and corrected.