In our first article in this series on Union Pacific, we sharpened our pencil regarding the different areas in which the company is spending on investments. This work has allowed us to make a better estimate of what money is being spent to maintain the business as a going concern — “Maintenance Capex” — which we spell out in this article.
Because maintenance capex is a key component of Owners’ Cash Profits (OCP), our work here alters our view of the profitability of the firm. None of this work changes what cash flows the firm has already spent, but rather just deepens our understanding of how the company operates.
We charted out the various categories the company in which the company reported investing.
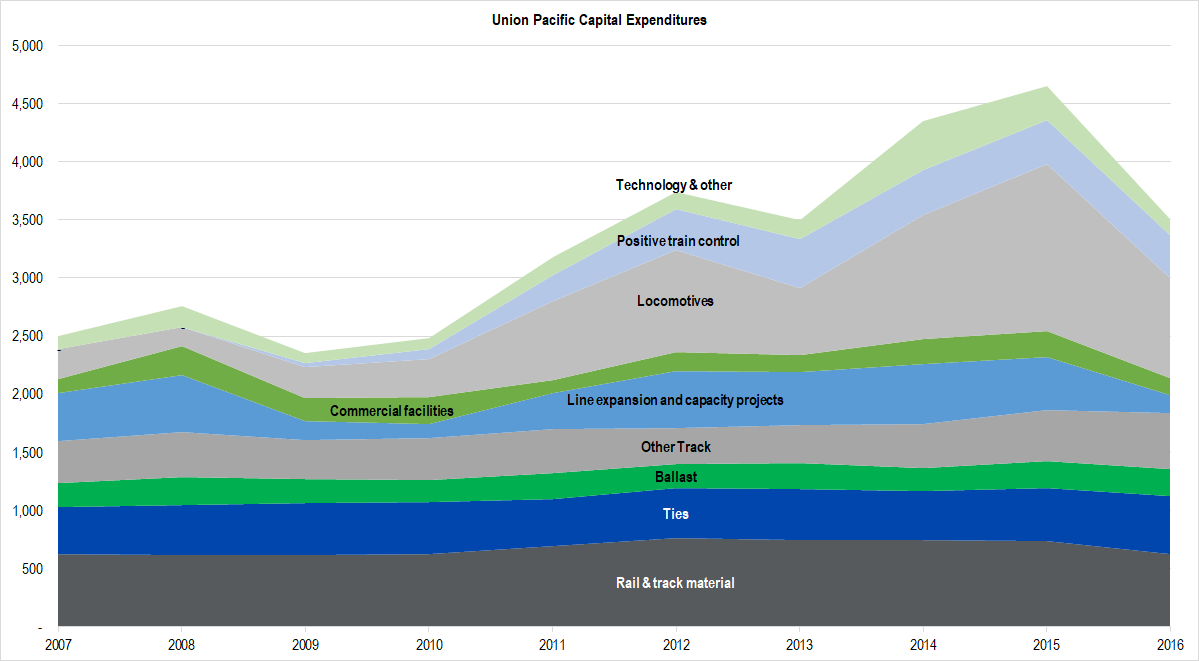
Figure 1. Source: Company Statements, Framework Investing Analysis
Looking at this, I decided to use everything classified as a “Track” expenditure as maintenance capex, as well as “Positive Train Control” and “Technology & Other.” Positive Train Control (PTC), is a system of GPS, sensor, and control equipment that has been mandated by the US Department of Transportation to be installed on US trains by 2018-2020. Even though PTC is new expenditure for Union Pacific rather than maintenance of existing equipment, because the work has a regulatory mandate, I believe it can be considered necessary in maintaining the business as a going concern.
This leaves any money spent for “Line expansion and capacity projects,” “Commercial facilities,” (loading docks and yards) and “Locomotives” as a portion of Expansionary Cash Flows, or what is commonly referred to as “growth capex.” It could be that Commercial facilities should be included under maintenance capex as well, but I’ve left it here all the same.
Our previous OCP calculations used Depreciation and Amortization Expense as the base for our estimates of maintenance capex. With the refinement detailed here, our calculation of OCP has thus changed.
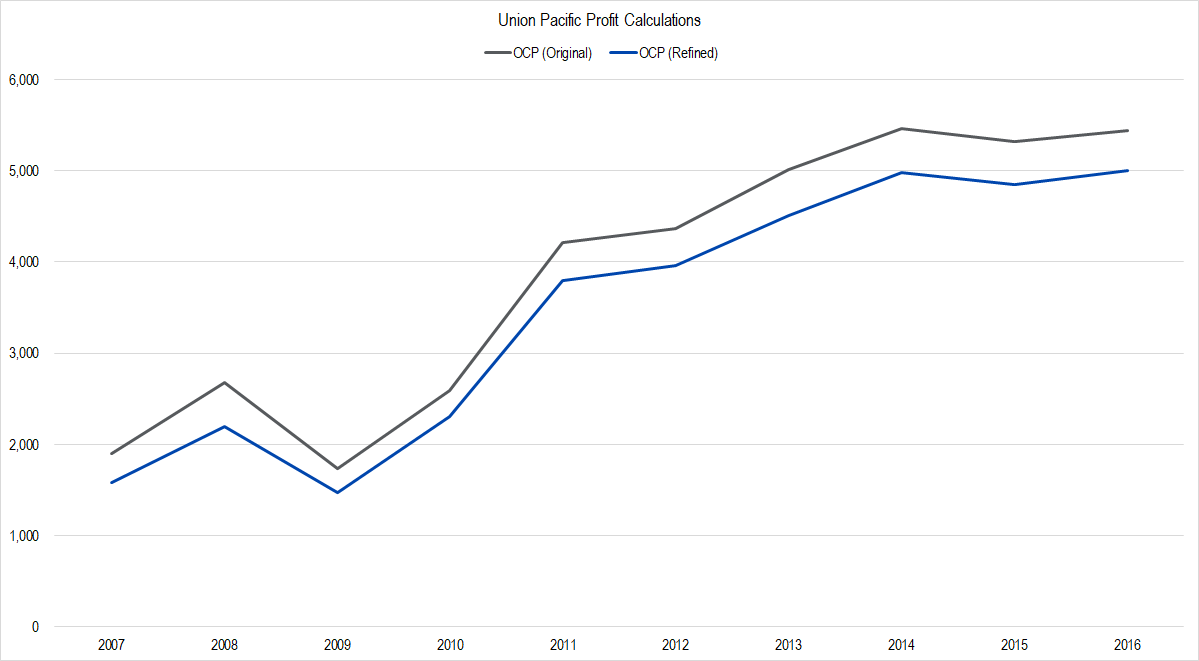
Figure 2. Source: Company Statements, Framework Investing Analysis
Using our refined calculations, OCP margins work out to average 22% over the last five years versus our previous calculation of 24%.
Again, nothing about the firm or its cash flows have changed, only our view of what should be considered maintenance spending has — cash required to maintain the business is higher than we originally thought, meaning that profitability is lower than we originally thought.
With this refinement, we can also refine our understanding about the relationship of maintenance spending to expansionary spending.
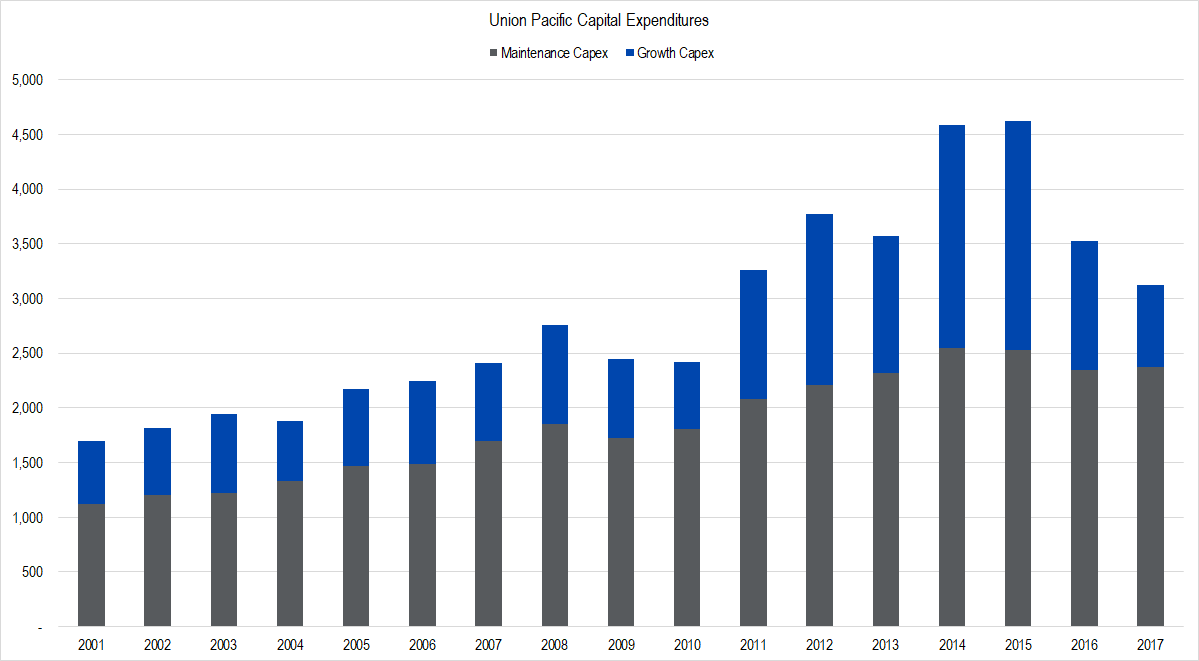
Figure 3. Source: Company Statements, Framework Investing Analysis
For the period 2001-2011, growth capex represents an average of 50% of maintenance capex, meaning that for every $1 of cash the company spends on maintenance, it spends $0.50 on growth, on average.
We believe the huge increase in growth capex spending from after 2011 represents two main factors:
- Purchase of new, more efficient and eco-friendly locomotives (many of them sold by GE) to meet federal Clean Air standards
- Expansion of its tracks and docks to allow it to take Intermodal business from BNSF, the category leader
In addition, the company had been shifting its locomotive fleet from leased to owned over this time as well, though this trend started earlier — at least since 2007, the earliest we could find these data.
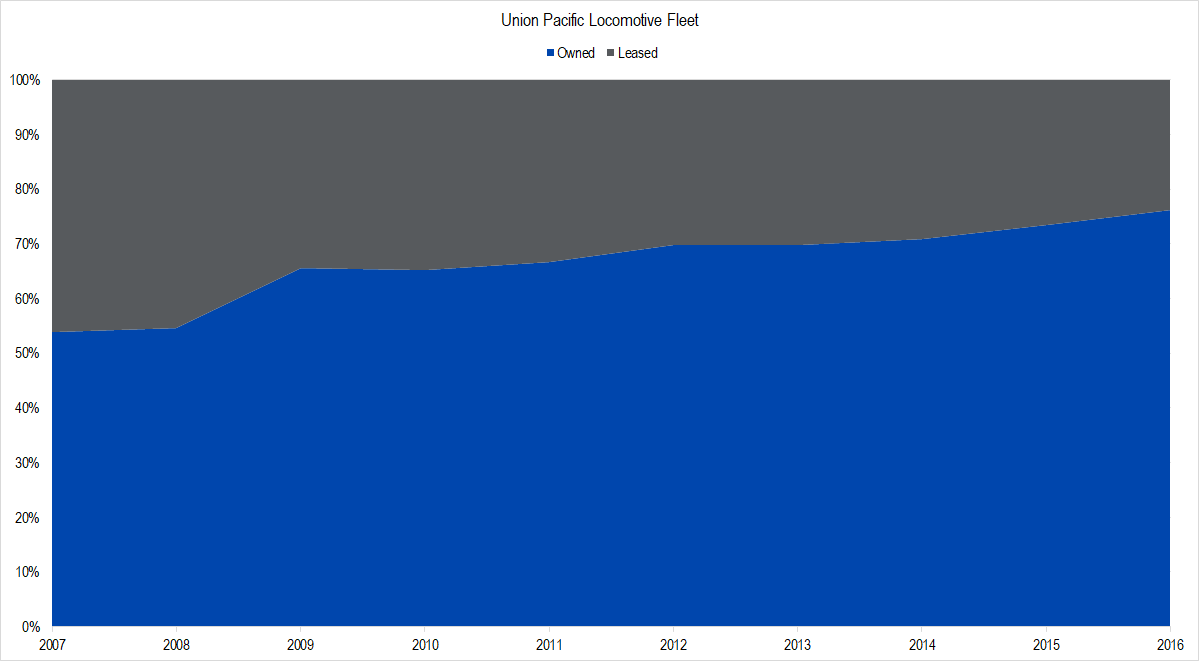
Figure 4. Source: Company Statements, Framework Investing Analysis. The proportion of leased locos to total went from 46% in 2007 to 24% in 2016.
(This transition toward owned locomotives is responsible for around 3 percentage points of profit margin expansion during this period.)
Looking forward, as of the end of 2017, we believe Union Pacific has roughly $300-400 million of spending left to fully implement the PTC requirements and that this spending will be substantively finished at the end of 2018. All else held equal, profit margins may increase at that time, but some of those extra profits may be spent on expansionary projects.
Spending on locomotives and track capacity is severely constrained at present on account of several factors:
- A lot of locomotives were already replaced during the 2011-2015 period
- Transported volumes continue to fall in many of Union Pacific’s operating regions leaving the company with spare capacity.*
With this new understanding of Union Pacific’s capital expenditures, we can move on to refining our valuation model and looking again at a valuation range for the firm. We will do that in the next article in this series.
Note:
* There is some variance between regions. Coal volumes continue to fall, so there is spare capacity on those lines. In addition, after a boost in Intermodal in 2014, Union Pacific is once again falling behind the Intermodal leader, BNSF just at a time when this business is becoming more challenging due to ocean shipping business dynamics and the completion of the Panama Canal extension. The bright spot is Texas, where the railway is busy transporting frac sand, industrial chemicals, and petroleum products.