
This article is an excerpt from our recently-published report on Interactive Brokers (IBKR) and investigates the dynamics of the first of three valuation drivers–revenues
IBKR?s two business segments have subtly different drivers but are similar in that both are commoditized products. IBKR has realized this fact sooner and more completely than its competitors and focuses on cutting prices to drive traffic.
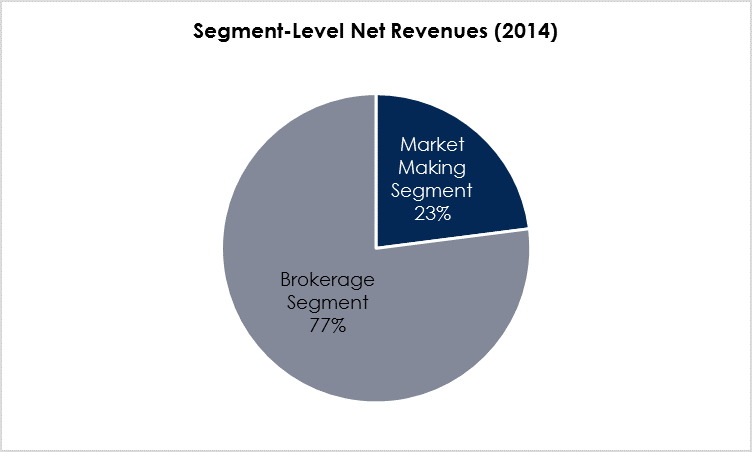
Figure 1. Source: Company statements, IOI Analysis
Market Maker Segment Dynamics
Market makers are, by their nature, skimmers. They make their profits by reliably earning the difference between the bid-ask spread?in a position similar to a financial market toll booth operator. Peterffy?s software dependably does what a good floor trader does?monitor the depth of the market on the bid and offer sides, assess short-term price trends, figure out when to hold a little more inventory or a little less, and provide market liquidity by buying at the bid and selling at the ask.
Anyone in the position of a market maker has a license to mint money because they can buy at the bid and sell at the ask. A market maker?s position is institutionally mandated, so can be thought of as a local monopoly on the provision of investor access to a given security in the same way that a utility has a regulatory mandate to operate a local monopoly on clients? access to the power grid.
Obviously, the two best condition for a market maker are:
- High trading volume
- Wide bid-ask spreads
In normal times, these two conditions are mostly mutually exclusive. Liquid securities with high trading volumes tend to have low bid-ask spreads and illiquid securities with low trading volumes tend to have wide ones. In stressful market environments conditions, bid-ask spreads can and do widen even for more liquid securities.
These dynamics show through clearly when looking at a graph of IBKR?s Timber Hill segment?s annual revenues and comparing those to volume statistics and a proxy for volatility.
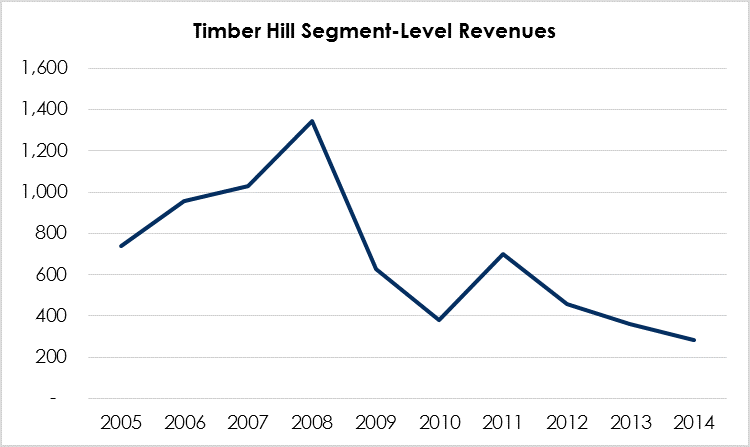
Figure 2. Source: Company statements, IOI Analysis
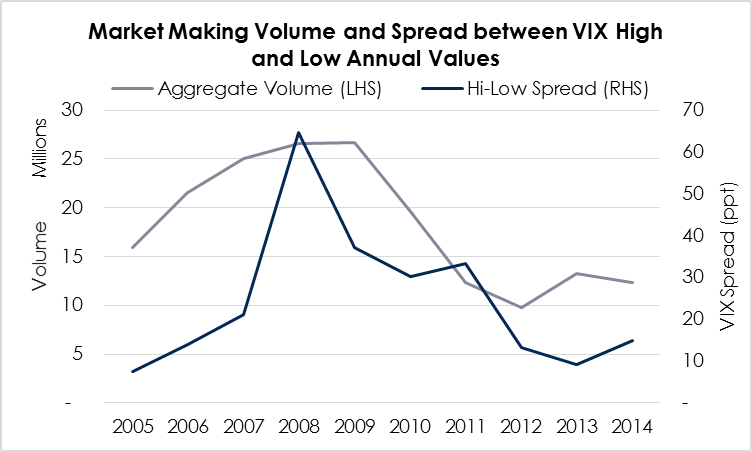
Figure 3. Source: Company statements, VIX data from YCharts, IOI Analysis,
Volume figures mix option and futures contracts with shares of stocks. VIX spread represents percentage point difference between high and low VIX values during that year.
From 2005-2007, trade volume was relatively high, but market volatility was low; this combination created fairly good revenues. In 2008, volume climbed while volatility spiked significantly; this combination led revenues to peak. From 2010-2014, both revenues and volatility has fallen off; leading to consistently low revenues. The only apparent outlier is 2009, which saw a fairly high VIX spread and high volumes. However, this outlier is caused by an artifact of the data?the options and futures volumes dropped during this year even as stock volume remained fairly high. Bid-ask spreads on options are especially high, so the drop in options volume had a negative effect on revenues as did the increasing importance of high-frequency trading (HFT), which we discuss below.
Note that we have used the VIX hi-low spread as a proxy for changes in implied volatility in the market. The company itself sees the difference between actual (statistical) volatility and implied volatility being a primary revenue driver, but data for that spread was unavailable to me for this analysis.
Statistically, correlation and r-squared values for various drivers are as follows:
| Correlation | R2 | |
| Avg. VIX : Market Making Net Revenues | 37.2% | 13.8% |
| VIX Spread : Mkt Making Net Revenues | 56.8% | 32.3% |
| Mkt Making Vol : Mkt Making Revenues | 68.6% | 47.0% |
Note that the correlation between average VIX levels and market making revenues are fairly low, compared to the VIX spread correlation with market making revenues.
The duty the market maker must fulfil to enjoy its local monopoly is that of ?maintaining an orderly market? by always trading at the prices they post and being available to trade no matter what the market environment is.
The risk of fulfilling this duty is that sometimes, the market maker will get ?picked off? by market participants who have better or earlier information about what a security?s price should be. This is where HFT comes into play. HFT firms? strategy is to jump in front of market makers and take the volume that would have otherwise flown into the regulated firms. However, HFT firms are not financial market utilities, so do not have the duty to trade in all market conditions or preserve an orderly market.
This means that HFT firms can elect to step out of the market when market conditions are unfavorable, then cut in front of the line of market makers and take volume when conditions are favorable.
The other risk to an automated market maker is that another market participant will figure out the algorithm you are using to set bid and ask prices and game you into selling too low and buying too high. In 2010, two Norwegian day traders were convicted of doing just that to Interactive Brokers, though the convictions were reversed two years later.[1]
Between HFTs and manipulative day traders, Peterffy seems to have become less enthusiastic to the market making business which forms the kernel of his original venture. IBKR has begun withdrawing from some markets leading to a reduction in market making volume and revenues. This withdrawal has been a lead factor in keeping aggregate revenues flat over the past five years.
Electronic Brokerage Segment Dynamics
Originally, the brokerage business was simply a supplement to IBKR?s market making business, but over time, it has grown in importance and now represents the core of IBKR?s operations.
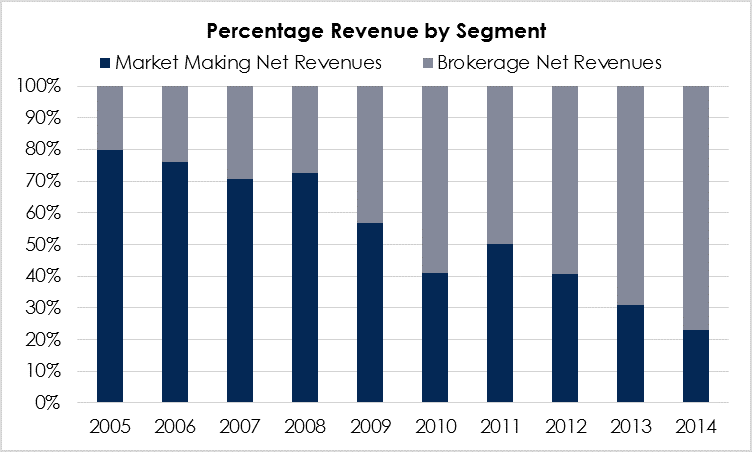
Figure 4. Source: Company statements, IOI Analysis
Part of this shift came because of the fall-off in market making business, but the lion?s share of it was the success of the brokerage business itself.
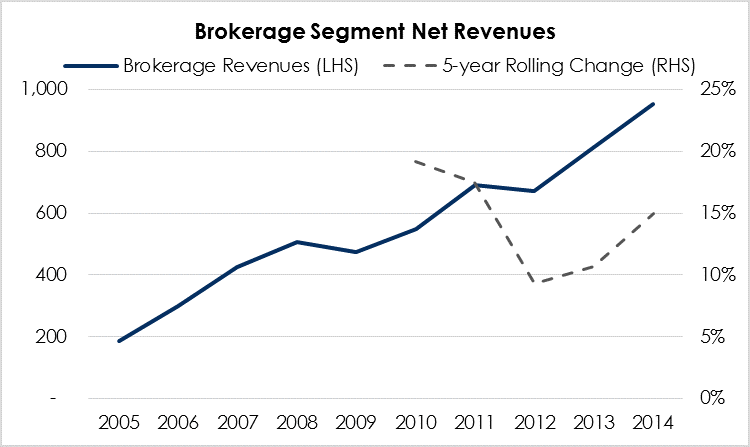
Figure 5. Source: Company statements, IOI Analysis
IBKR?s brokerage segment?s rolling 5-year growth rate average in the mid-teens is double that of the next fastest growing online brokerage (Ameritrade, AMTD) and leaves another two competitors in the dust (both Charles Schwab and E*Trade average around 2% rolling 5-year growth).
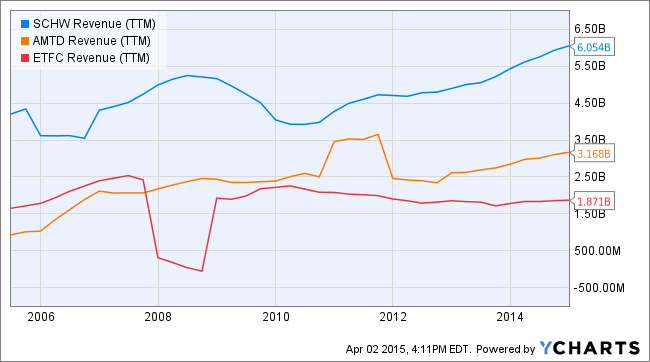
Figure 6. Source: YCharts
These market share gains are driven by IBKR?s focus on driving volume and enabled by its automation-driven cost advantages (discussed below). IBKR is keenly aware that brokerage is a commodity business, and the key to a commodity business is volume. As such, it passes through its cost advantages to its customers to drive greater trading volume. For instance, IBKR?s margin rates are much lower than other brokers, encouraging clients so inclined to transact in their margin accounts. Transaction fees are similarly low.
In addition, the company claims that its smart routing technology and the fact that it does not sell trading volume for rebates[2] allows its clients to receive better executions on its orders than they might elsewhere.
Its services appeal especially to hedge fund owners, who are able to disintermediate the bulge-bracket broker-dealers and get cheaper, more direct access to the market. The big attraction of bulge-bracket firms had been access to the bank?s research department, but if a hedge fund manager can get by without sell-side research, IBKR represents a cheap way to access a great many world markets (stock, futures, options, forex, mutual funds and bonds denominated in 21 currencies according to the 2014 10-K).
The firm also offers its automated trade processing and account management systems (wholly or in sub-components) as white label products to brokers, advisors, and fund managers. We suspect that a new white label agreement is responsible for the large uptick in stock volume over the last two years, but IBKR?s representatives would not confirm this.
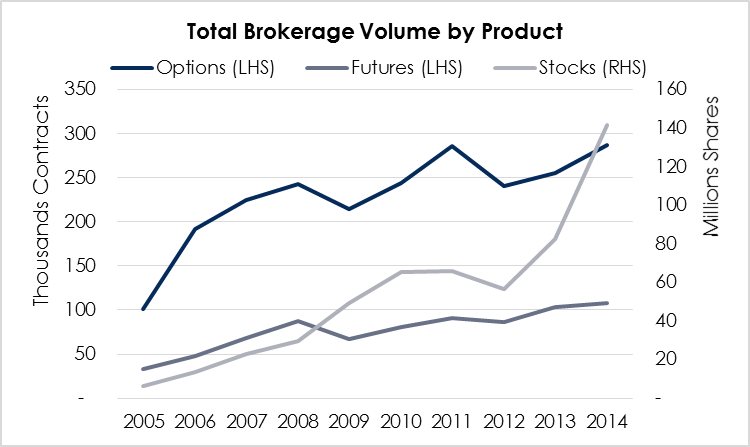
Figure 7. Source: Company statements, IOI Analysis
On an aggregate basis, revenues at IBKR over the past 10 years have looked like this:
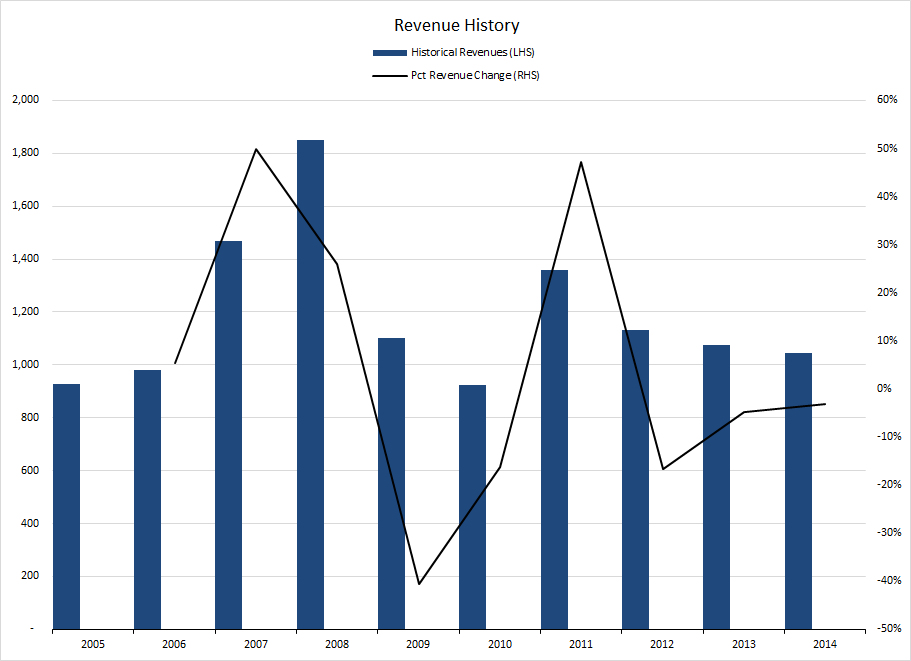
Figure 8. Source: Company statements, IOI Analysis
Here, we can see clearly that the interacting effects of volatility, volume, and the shifting prominence of the two business segments have led to a revenue profile that looks volatile and flat. We believe that the market has misread the aggregate data and come to the conclusion that IBKR?s demand environment is weak and uncertain.
NOTES:
[1] The Norwegians were able to manipulate IBKR?s algorithms due to the low liquidity in the securities they were trading. IBKR?s algorithms look to the depth of the market on the bid and ask side to determine how to set their own bid-ask prices. Because the stocks were low liquidity, there was little information content in the bids and asks posted by market participants. The Norwegians were able to place false orders on the exchange; this caused the IBKR algorithms react to the information as if it were real, at which point, the day traders took profit. It?s doubtful the same scheme could be successfully executed in a high volume market.
[2] Other brokers route customer orders through to particular ECNs or exchanges and receive a rebate on the exchange fees these orders generate. It?s an old-fashioned kick-back scheme (?trade on our exchange and will kick back some of the fees to you?) which, like all kick-back schemes, raises prices for the end customer.