
Last week, I posted an analysis by a very insightful former hedge fund analyst specializing in retailers — Tod Schneider, CFA, CPA (Inactive) — regarding a purveyor of racy women’s lingerie and pot scrubbers, L Brands LB.
I have been exchanging emails with Schneider over the past week and reading through the company’s financial statements to get a sense of the main issues facing the company. I also authored a short article about L Brands last week for Forbes, which discusses some of what I’ve picked up in my reading about the company and its Midwestern billionaire CEO and Chairman, Les Wexner.
Long story short, even valuing the company using a different methodology, Schneider and my valuations line up well, and L Brands does look like an interesting opportunity.
This article looks at my assumptions for each of the value drivers and compares them to Schneider’s. I also offer my thoughts on the factors that might cause variance in each driver.
Revenues
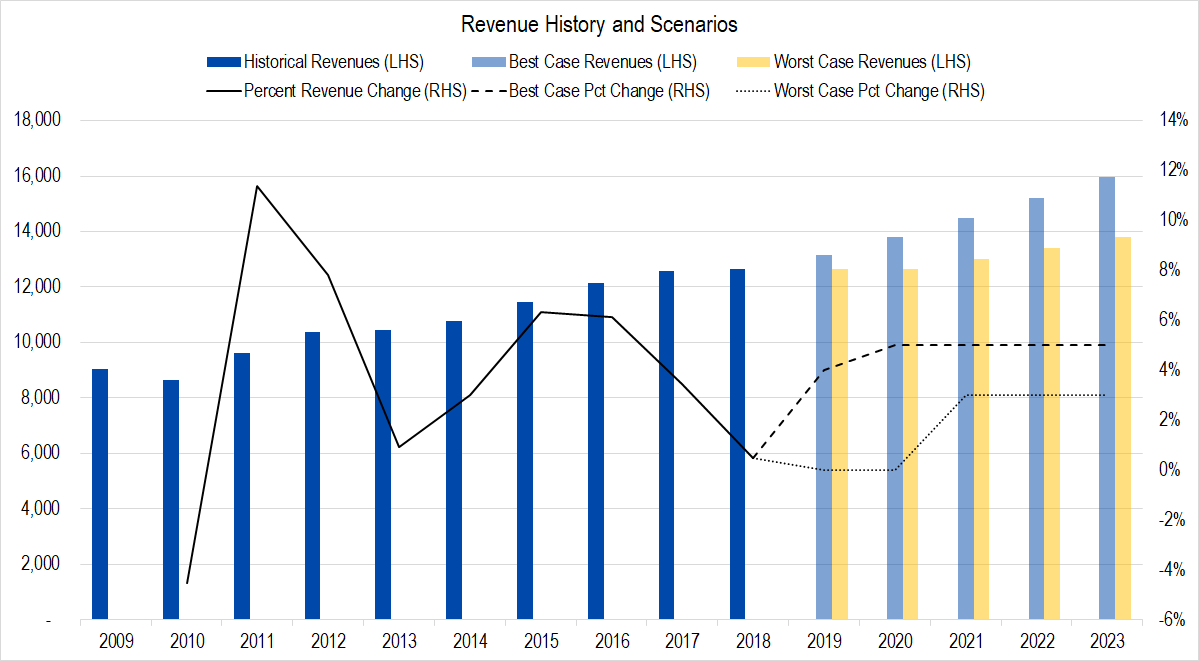
Figure 1. Source: Company Statements, Framework Investing Analysis
Our approach to forecasting L Brands’ revenue growth was back-of-the-envelope. We looked at the last 18 years of revenue history and noted that, outside of the three years at the epicenter of the Great Recession (LB’s fiscal years ending in January 2008, 2009, and 2010) and the fiscal year ended January 2002 — all of which recorded revenue contraction — the lowest growth years were roughly flat. Excluding years of post-recession rebound, the company grew at an average of 5% per year.
Our forecasts are based on these historical observations. Schneider is looking much more carefully at same-store sales growth and change in store count. His revenue assumptions fall within my best- and worst-case range, slightly closer to the worst-case. In our final forecast year (the fiscal year ending in January 2023), Schneider’s model forecasts $14.3 billion in turnover, compared to $13.8 billion and $16.0 billion for worst- and best-case in our model, respectively.
Schneider assumes that same-store sales growth will normalize at around 2.5% per year; adding a few percentage points worth of inflation to that brings us to our best-case growth of 4-5% per year.
Schneider points out that as Victoria’s Secret repositions itself over the next few years (with more of a focus on bralettes and athleisure wear), growth may be tepid. We have represented five years of tepid growth in our worst-case estimates, which corresponds to a negative same-store sale growth for several years, followed by inflation+ growth for the remaining period.
Victoria’s Secret — whose revenues last year made up 58% of overall sales — still has only a limited presence overseas. Overseas sales represented only 4% of overall revenues, and were the company to focus on international expansion, sales growth might tend toward our best-case values.
In the worst-case, we are conscious of the present administration’s “America First” policy and the potential for disruption in supply chains stemming from trade wars and the like. Bath & Body Works — which represented one-third of L Brands’ FY 2017 revenues — likely imports a fair amount of its inventory from Asian suppliers, and we all know that very few of the kinds of textile products Victoria’s Secret sells are made in the domestic US. This raises the possibility for business disruption or a slowdown in sales if L Brands is unable to pass through increasing inventory prices to consumers. L Brands is also closing its Henri Bendel stores, which, while improving profitability, will likely provide a headwind to revenues.
Note that our worst-case forecast does not assume the possibility of an extreme drop in demand, such as might be caused by a deep recession. We have tried to look at a “normally bad” worst-case, in other words.
Profits
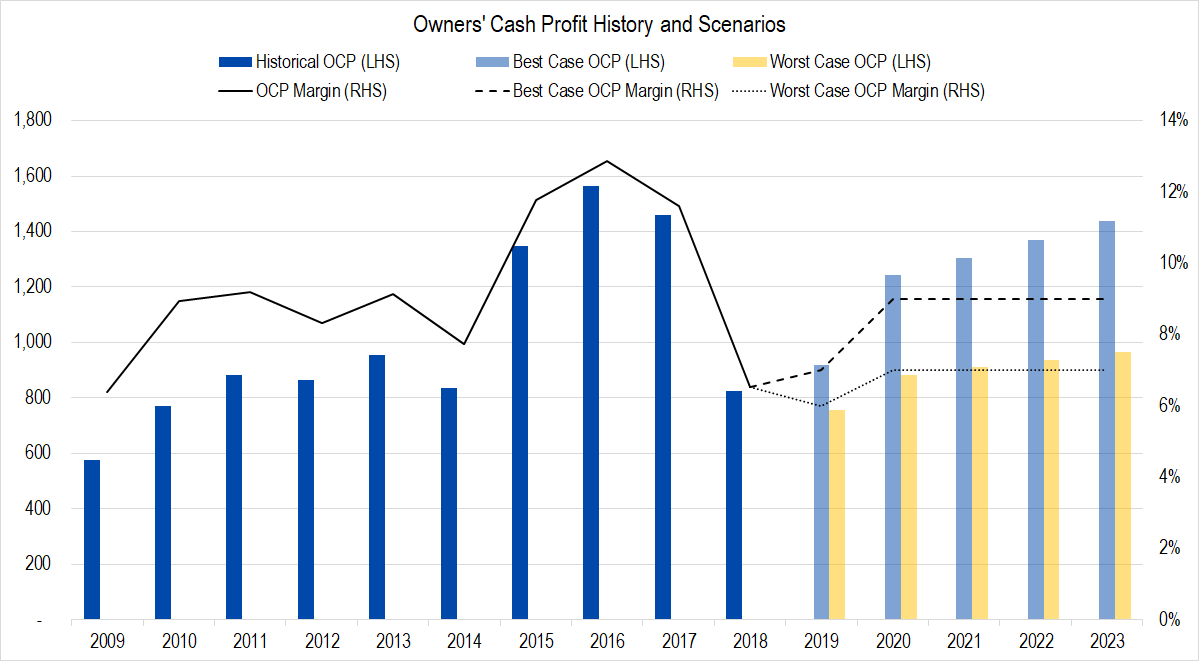
Figure 2. Source: Company Statements, Framework Investing Analysis
The two things that struck me when I saw this graph for the first time was the large hump in profitability in the years ended January 2015 – January 2017 and the consistency of the profit margin in the years preceding that time.
Schneider believes that the high-profitability hump is related to the compensation arrangement of the previous CEO. As I mention in the Bull In an Underwear Shop article, the focus on profits may have put Victoria’s Secret at a competitive disadvantage as it missed a consumer demand switch to athleisure and bralettes.
Wexner took control of Victoria’s Secret and has repositioned its line to appeal to modern tastes. In the near-term, Wexner is using discounting to draw consumers into stores, so it is reasonable to expect lower profitability this year, in both best- and worst-case scenarios. After that point, my best-case scenario suggests a “return-toward-the-mean” dynamic; my worst-case scenario suggests a dynamic whereby profitability permanently resets at a lower level. All things considered, I believe the return-to-the-mean dynamic is probably more realistic.
Schneider does not forecast Owners’ Cash Profit, but does have a forecast for Net Income, which should be roughly in line with OCP. In his last forecast year, he assumes the company will be able to generate $1.2 billion in net income. Again, this value falls between our worst- and best-case OCP assumptions of $1.0 billion and 1.4 billion, respectively.
Investment Spending (Expansionary Cash Flow)
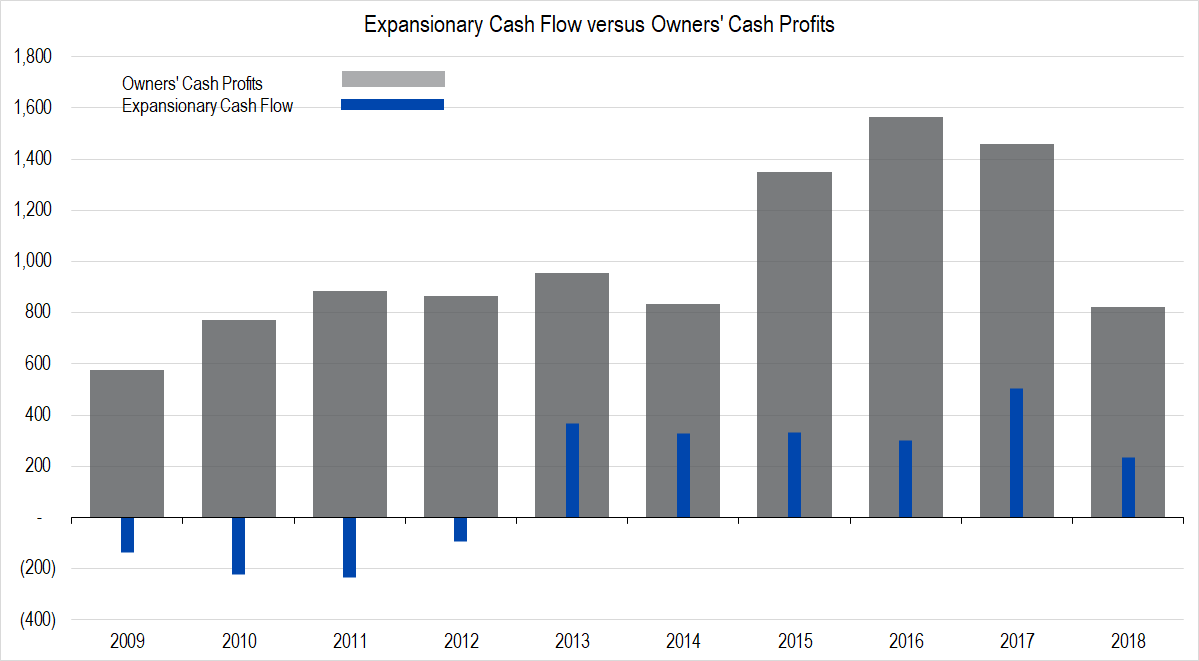
Figure 3. Source: Company Statements, Framework Investing Analysis
Since 2013, ECF as we count it (which includes the implied cash value of shares issued as employee compensation), has averaged $344 million per year. In the years preceding that, the company sold assets and restricted spending on capital improvements.
We have forecast that the company will spend an average of $340 million per year over the next five years. Note that this assumption does not mean we assume that store count is growing. Store count has been stable at 3,075 over the last two years and with the closing of Henri Bendel stores, the count may drop over the next year. That said, Wexner is focused on pulling people into the stores, so it is reasonable to assume the company will spend something on store redesign.
The one aspect of L Brands investment spending that gives me pause is the relatively high proportion spent on stock-based compensation.
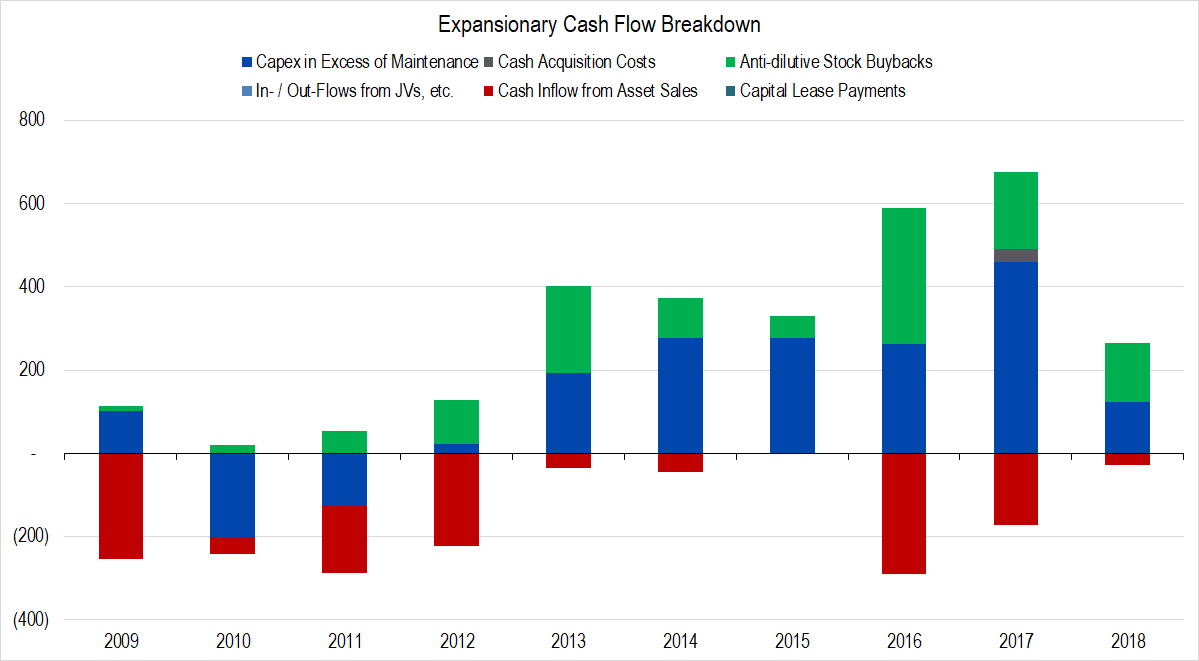
Figure 4. Source: Company Statements, Framework Investing Analysis
Note the prominent green bands, which show the imputed cash value of share-based compensation.
Free Cash Flow to Owners
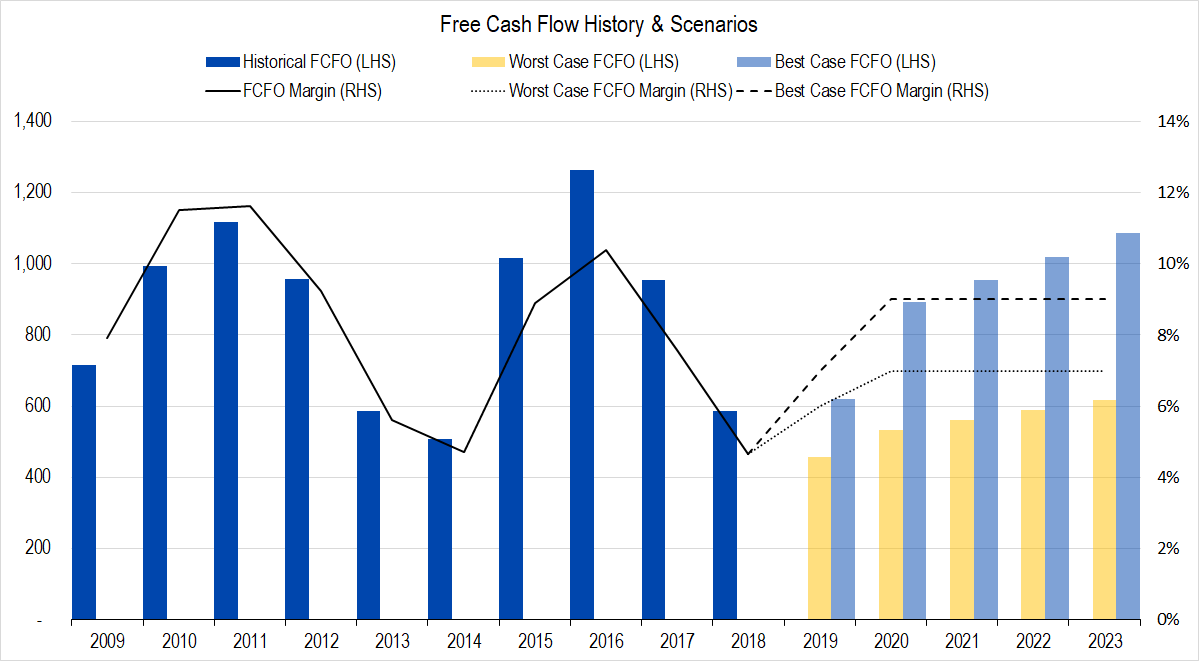
Figure 5. Source: Company Statements, Framework Investing Analysis
Combining each of the above assumptions generate our assumptions for Free Cash Flow to Owners. If the company spends less on Expansionary Cash Flow than we have assumed — a scenario we believe possible — FCFO margins will likely be higher than the 7% and 9% we have assumed for worst- and best-case, respectively.
Schneider values the company using Free Cash Flow to the Firm (FCFF), which is not directly comparable to the FCFO we use. That said, his intermediate assumptions are, as we’ve shown above, within the ranges we are using.
Valuation
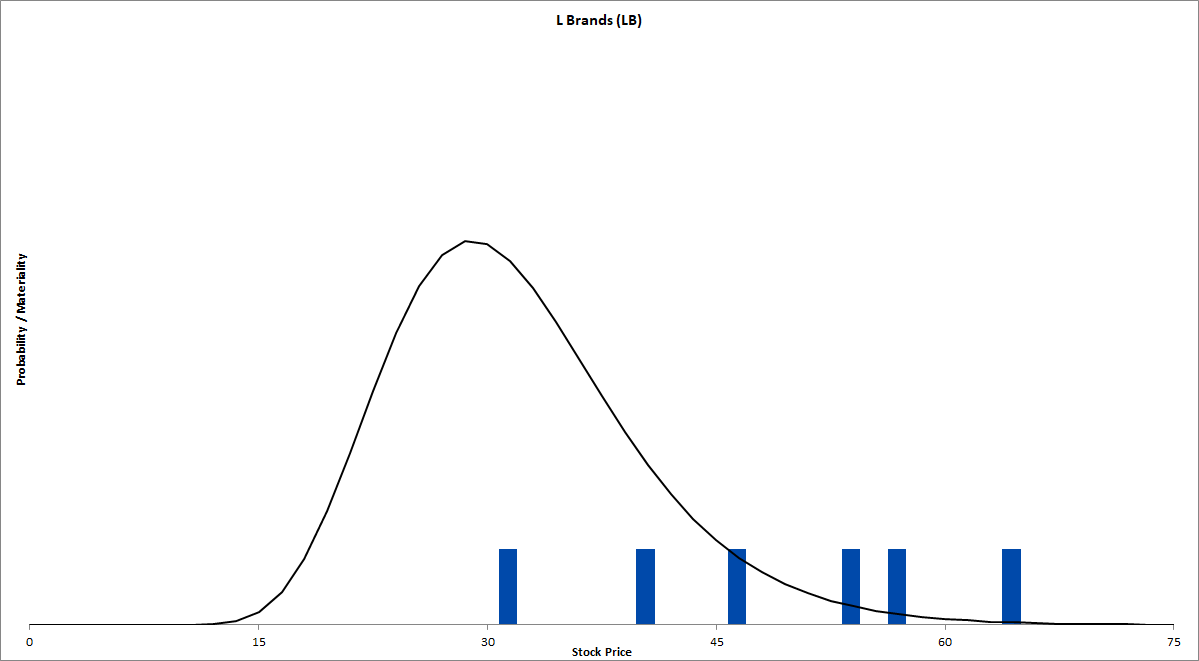
Figure 6. Source: Company Statements, Framework Investing Analysis
With the assumptions laid out here, we find valuation scenarios extending from $32 / share on the low-end to $65 / share on the high-end, with average and median values at $47 / share. In contrast, Schneider’s valuation is $44 / share — less than 10% lower than our midpoint value.
Schneider uses a discount rate of 9% — lower than our standard rate of 10% — but the boost in value from this lower rate is likely offset by his assumption of 2.5% perpetual growth versus our assumption of 5.0% perpetual growth. The difference between our assumptions here is that he is using real growth whereas I have used nominal (i.e., including inflation).
Investment Strategy
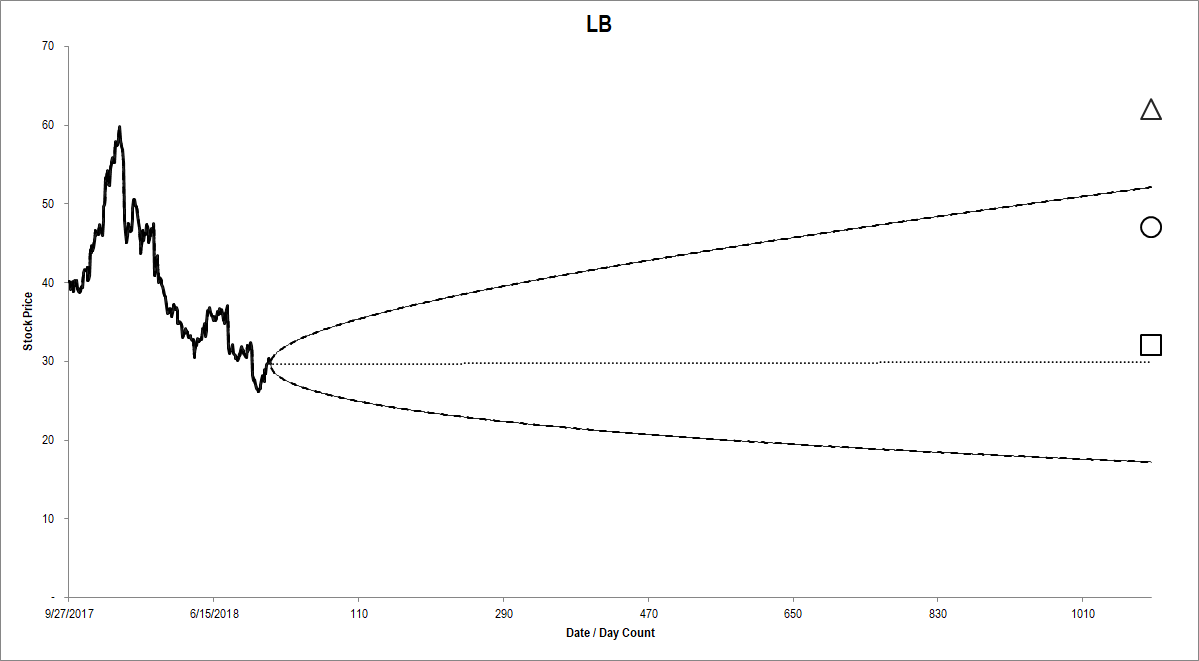
Figure 7. Source: Company Statements, Framework Investing Analysis
With L Brands’ BSM Cone shifted lower than the likely valuation range, there are several investment possibilities:
- Buying the shares (Schneider’s preferred approach)
- Selling ATM puts / covered calls with roughly three months to expiration (see our video on Bond Replacement strategies)
- Buying a long-tenor OTM call option.
- Combining a short-tenor sold ATM put with a long-tenor OTM option in what we term a bullish “Diagonal” (the rest of the option world calls this a “split-strike combo”).
- Layer a bullish option strategy on top of a purchase of the shares.
To help guide you to the best structure for your risk preferences, please take a look at our new Leverage Model!
Framework Valuation Model – L Brands (LB) ![]()
BSM Cone Application – L Brands (LB) ![]()