
This overview accompanies the IOI Tear Sheet on Oracle (ORCL) and is split into the following sections:
- Revenue Scenarios
- Economic Profit Scenarios
- Investment Efficacy Scenarios
- Valuation Stages
IOI’s explicit forecast period for Oracle lasts five years.
Revenue Scenarios
Oracle’s business model is a lot like a combination of razor company Gillette and medical device company Medtronics.
Once a Gillette customer buys a razor, Gillette can count on years of customers buying its high margin disposable razor heads. Once a Medtronics patient is implanted with a pacemaker, how willing do you think the patient will be to switch it out if a newer, cheaper pacemaker comes to market.
Oracle sells database and other infrastructure software. These databases and other programs are implanted into the heart of companies’ business processes (Medtronics business model). Once the software is in place, Oracle continues to add features so it can sell its clients years of high margin upgrades and improvements (Gillette business model).
This is a good business model.
 |
| Oracle Segment Revenue Growth (ex-Hardware) Source: Company Statements, IOI Analysis |
Note in the above image that the New Software and Services segments (both in blue shades) experience year-over-year declines according to cyclical pressures (Oracle’s fiscal year end is May 31 so 2002 contains half of calendar 2001); note also that Software Updates does not once decline over this period. Because it has not declined in the past does not mean that it cannot in the future, but due to the cumulative nature of this updates business, it is mathematically difficult for it to. It just so happens that this part of the business is by far the most profitable–a point we discuss in the Economic Profit section.
Oracle’s overall revenue growth has been highly influenced by acquisitions. We will discuss the efficacy of the acquisition policy below, but focus now on the revenue growth rate itself.
Looking at the chart above, it is clear that several of Oracle’s segments are sensitive to economic cycles. The Hardware-related segment (new hardware sales and hardware upkeep–both acquired through the Sun Micro purchase in 2010) are, of course, cyclical as well. At present, due to economic weakness in Europe, Asia Pacific, and emerging markets, Oracle is facing a moderate revenue headwind. Added to that, Oracle has been paring back its hardware offerings, attempting to leave the commoditized server business to Hewlett-Packard (HPQ), et al. while retaining high-margin, high-end custom servers in its product line-up. As such, revenue growth over the past few years has been tepid (2009, 2012, 2013) or abnormally high due to the Sun acquisition (2010, 2011).
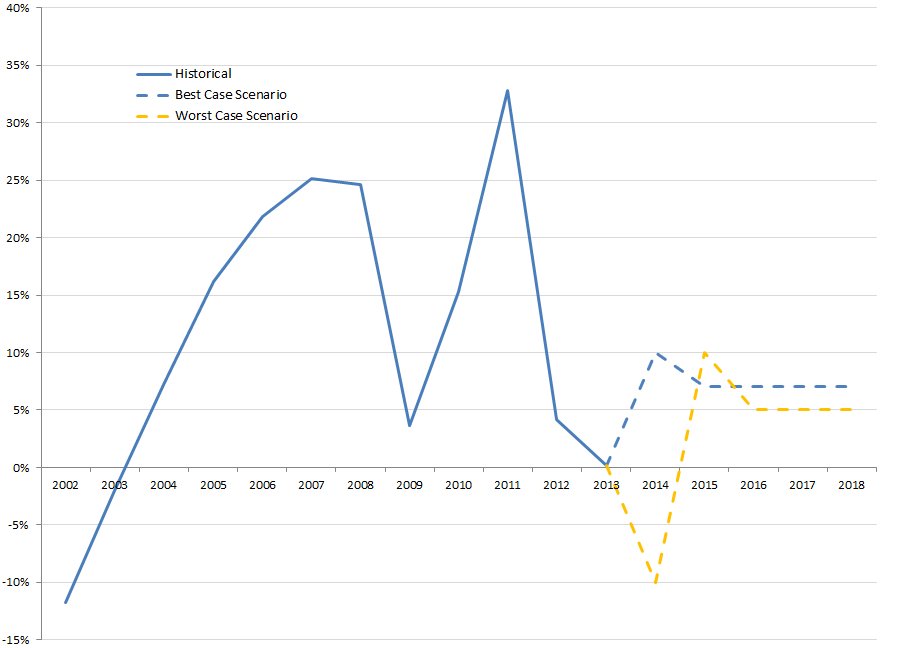 |
| Oracle Historical Revenue Growth and IOI Valuation Scenarios Source: Company Statements, IOI Analysis |
Considering the type of product Oracle sells, its sensitivity to economic cycles, and the size of its share in the market at present, offset partially by the growth consistency of the software update business, we estimate the firm should grow revenues at GDP or a bit better on a normalized basis. For our worst case scenario, we have built in a crash in revenues slightly less severe than the Tech Bust of the early 2000s for the first explicit forecast year. For the best case scenario, we have simply used consensus revenue growth for the first explicit forecast year.
- IOI’s worst case revenue scenario generates an average year-over-year (YoY) nominal growth rate and 5-year compound annual growth rate (5Y CAGR) of 3%.
- IOI’s best case revenue scenario generates an average YoY nominal growth rate and 5Y CAGR of 8%.
Economic Profit Scenarios
IOI’s estimate of economic profit deducts an estimate of maintenance capital expenditures from cash flows from operations. Historically, just under half of Oracle’s revenues have been generated from the software update business. This business has operating margins on the order of 85%. Operating margins are not economic profits, necessarily, but the fact that such a large component of revenue is extremely profitable on an accounting basis suggests that the economic profitability is also high.
New software sales are likely priced competitively enough to win new business; once that new business is won, continuous improvements and extensions of the products leads to the ability to generate very high profits. Again, this is similar to Gillette selling a client a cheap razor and high margin blades.
In addition, returning for a moment to the Medtronic model, once the pacemaker (the databases and “middle-ware” infrastructure software) is installed, the company offers the patient enough improvements on present functionality in its updates that it becomes an easy decision for the client to make. How would you answer the following question?
“Should I pay the device salesman to, non-surgically and without pain, update my pacemaker functionality, or should I let a surgeon cut me open to replace my present pacemaker with a cheaper one from another company?”
Having worked, in one part of my career, on IT infrastructure projects, I know that a CTO’s decision to go with different database and infrastructure software is as likely to be answered with “I don’t care about anything but the cost” as the question above would be.
 |
| IOI Estimate of Oracle’s Economic Profit and Valuation Scenarios Source: Company Statements, IOI Analysis |
- IOI’s worst case profitability scenario generates an economic profit margin of around 22%–a fall of about twenty percent compared to the previous 5-year period’s average.
- IOI’s best case profitability scenario generates and economic profit margin of around 30%–a rise of about 10% compared to the previous 5-year period average.
Investing Efficacy Scenarios
Oracle makes demonstrably good investment decisions in that its investments generally allow economic profits to grow at a faster rate than GDP. While Oracle has made some large acquisitions (PeopleSoft: 2005, Siebel Systems: 2006, BEA Systems: 2008, Sun Microsystems: 2010) these acquisitions have brought Oracle complementary systems that pull a wider range of customers tighter into a relationship with Oracle, and into subsequent cycles of high-margin software upgrades. Perhaps due to the weak economic conditions or because the company has already purchased many of the strategic assets on its radar, recent acquisitions have been smaller. Without as much acquisition activity, profit margins have headed up, allowing for good investment efficacy even as revenue has weakened. Given its history of value-creative investments, right now, we believe investment efficacy is high enough to allow the company to continue generating economic profits for its shareholders at least equal to and likely in excess of GDP.
 |
| IOI Estimate of Oracle’s Marginal Growth in Economic Profits Source: Company Statements, IOI Analysis |
- IOI’s worst case medium-term (forecast years 6-10) growth scenario implies a growth in nominal free cash flows of 6% per year.
- IOI’s best case medium-term growth scenario implies marginal cash flows 6 percentage points higher than historical GDP growth at roughly 12% per year.
Valuation Stages
A reader sent a comment today related to the proportion of value in each of the three stages of the IOI valuation. The proportion value in each stage relates to the growth in cash flows, so to the extent that we discuss revenue growth and profitability during the explicit forecast period and cash flow growth in the medium term above, this section may be superfluous. Be that as it may, we thought the inclusion of a tabular display of the proportion of valuation stage-by-stage, and the associated implied average yearly growth rates would be a welcome inclusion. Here is that table for Oracle:
 |
| Source: IOI Analysis |