
I have been writing a lot about Pharmacy Benefits Manager (PBM) giant Express Scripts ESRX lately, and decided to update my valuation of the company.
Let’s take a hard look at what is happening at Express Scripts from a valuation perspective. Our valuation framework focuses in on a handful of fundamental drivers, of which there are only three main ones in the short-term and one related one in the medium-term. We’ll work through each one-by-one.
Revenues
On April 24, the company announced that it was likely to lose its largest client, Anthem ANTM – responsible for 18% of Express Scripts’ revenues last quarter – when the contract comes up for renewal in 2019.
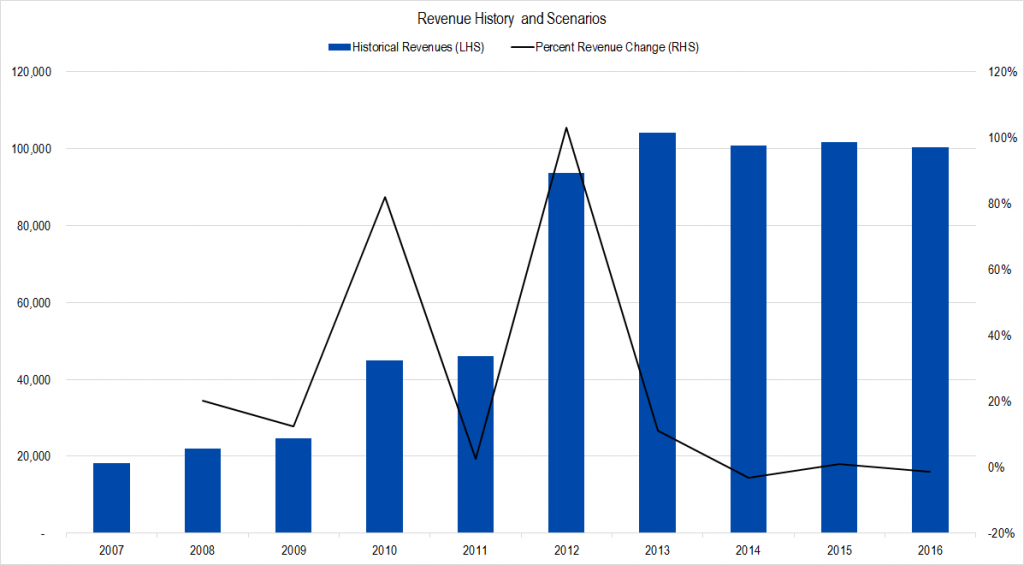
Figure 1. Express Scripts Revenue History. Source: Company Statements, Framework Investing Analysis
In this graph we can see from the rapidly-growing dark blue columns that historically, Express Scripts grew quickly through acquisitions. But we know that essentially, this is a slow-growth business – low- to mid-single digit revenue growth per year.
We’re also worried that Anthem’s accusations have poisoned the well for Express Scripts to a certain extent, which may put a damper on the company winning new clients and speed the defection of others.
Numerically, let’s say that best-case, the company grows at an average annual rate of about 4% per year. Worst-case, it grows at 1% per year and in 2020, experiences a 20% drop from the loss of Anthem business.
This is what our graph looks like now – light blue columns being best-case, yellow columns being worst.
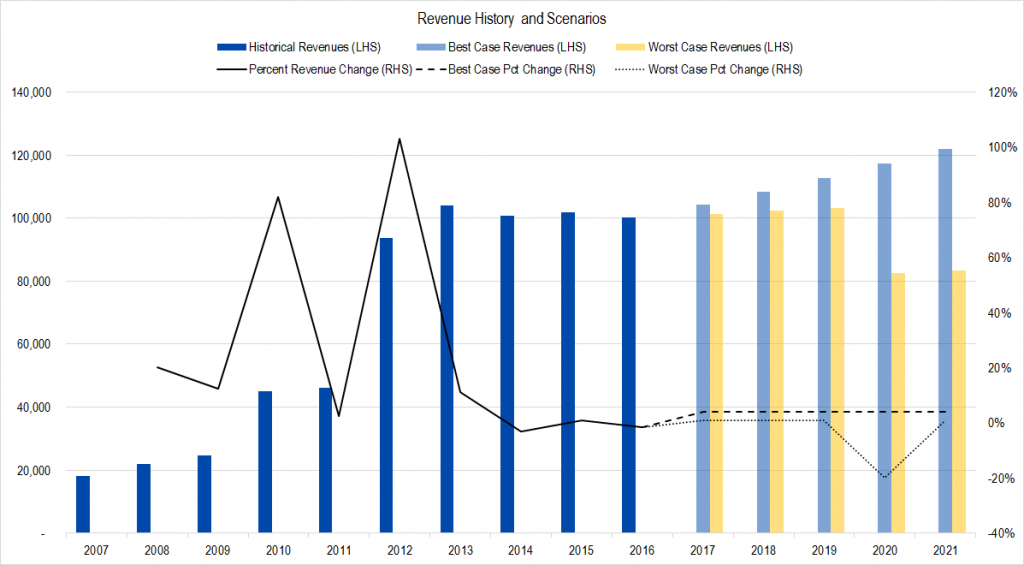
Figure 2. Source: Company Statements, Framework Investing Analysis
Profits
Our preferred metric is called Owners’ Cash Profits – OCP. You can see from the black line on this chart that OCP margins have been pretty consistently in the 4% to 5% range. That big jump in absolute OCP in 2012 is due to the acquisition of Medco, by the way.
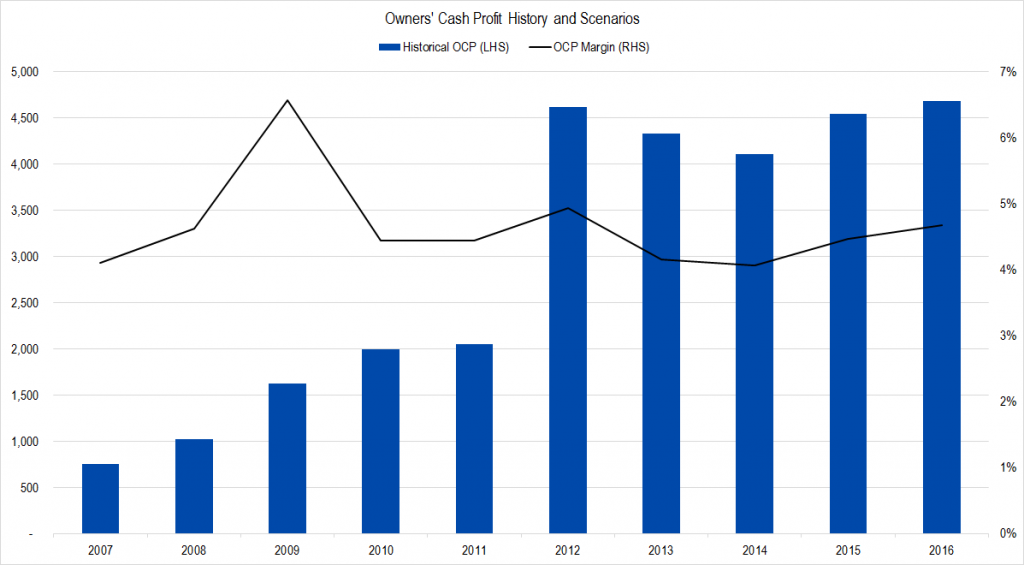
Figure 3. Source: Company Statements, Framework Investing Analysis
The Anthem announcement has the potential to drop profits in several different ways, and we think that the 4-5% OCP margin range may contract to the 2.5% – 4% range in the future. Making the change in our model creates a graph like this.
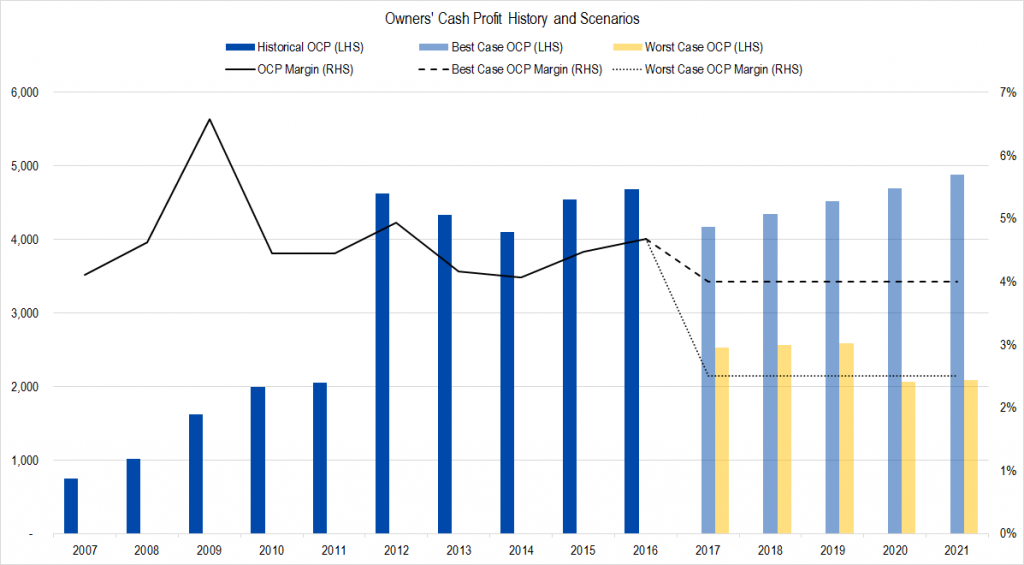
Figure 4. Source: Company Statements, Framework Investing Analysis
Investment Spending
The company invested a lot in the past as it acquired other PBMs. The acquisition of Medco is so large on this chart that it dwarfs other years’ spending. We believe that those days of consolidation are mostly behind us, so think that Express Scripts will spend a relatively modest 7% of its profits on expansionary spending in the near term.
This implies a Free Cash Flow to Owners (FCFO) of $0.02 to $0.03 for every dollar of revenues going forward – slightly less than historical due to our assumptions for lower profitability.
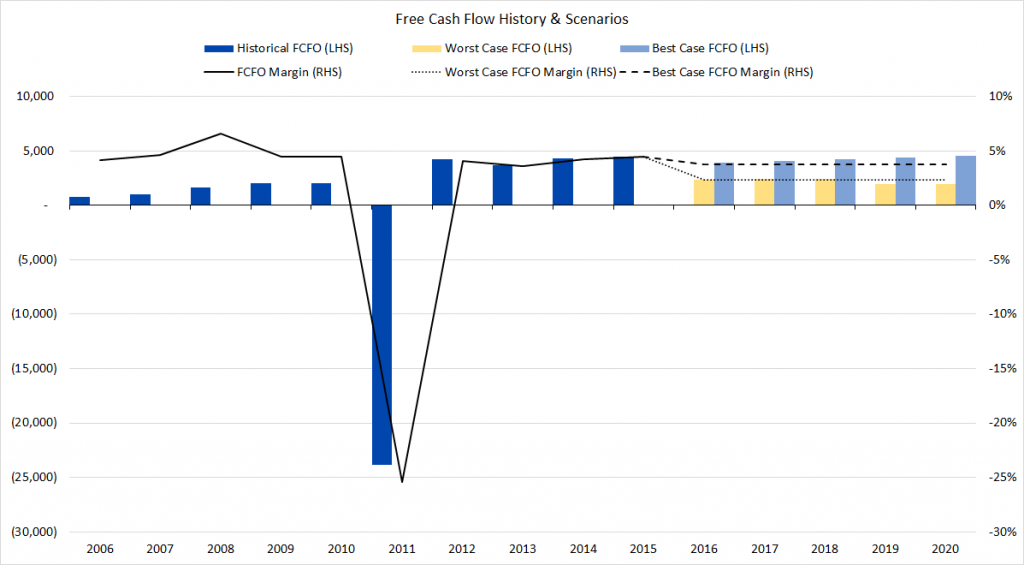
Figure 5. Source: Company Statements, Framework Investing Analysis
Medium-Term Growth
We think the tide is going against Express Scripts and that it will have to keep dropping prices to remain competitive in this industry. This means that no matter if it keeps investing, it medium-term growth, which we usually define as 5-10 years in the future, is likely to be uninspiring. We are using 5% and 1% growth of cash flows as our best- and worst-case assumptions.
Valuation
Pulling this all together gives us a best-case valuation of $87 and a worst-case valuation of $34 per share with an equally weighted average value of $57 per share. Comparing this to what the option market is forecasting, we see that the ranges mostly overlap, suggesting that there is not the opportunity to make an investment where the risk-reward balance is attractive. Note that there is risk to the downside because if Anthem does pull its business, all our best-case revenue scenarios will need to be reset down.
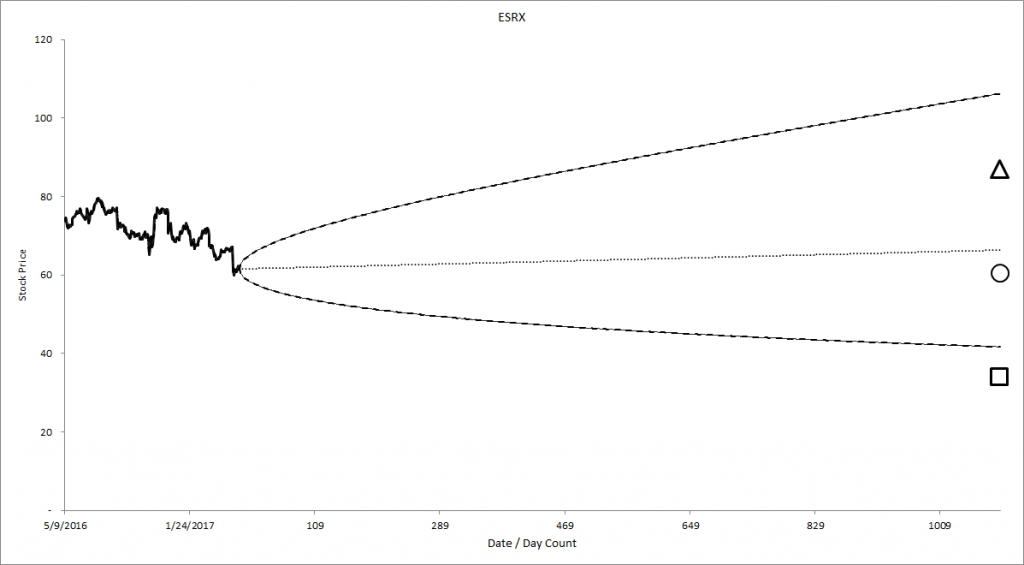
Figure 6. Source: YCharts, CBOE, Framework Investing Analysis
This is a very real and frightening valuation risk among companies that have large revenue concentration.