
Wall Street mainly focuses on earnings. I believe that the best directional investors in the world focus mainly on revenues. This is why, in my own work, I usually spend about 80% of my analytical time coming to grips with the dynamics of the demand environment and how those dynamics are likely to impact revenue growth in the near term.
In the case of Gilead Sciences ($GILD), when I started to analyze the company’s revenues, I was first confronted with this:
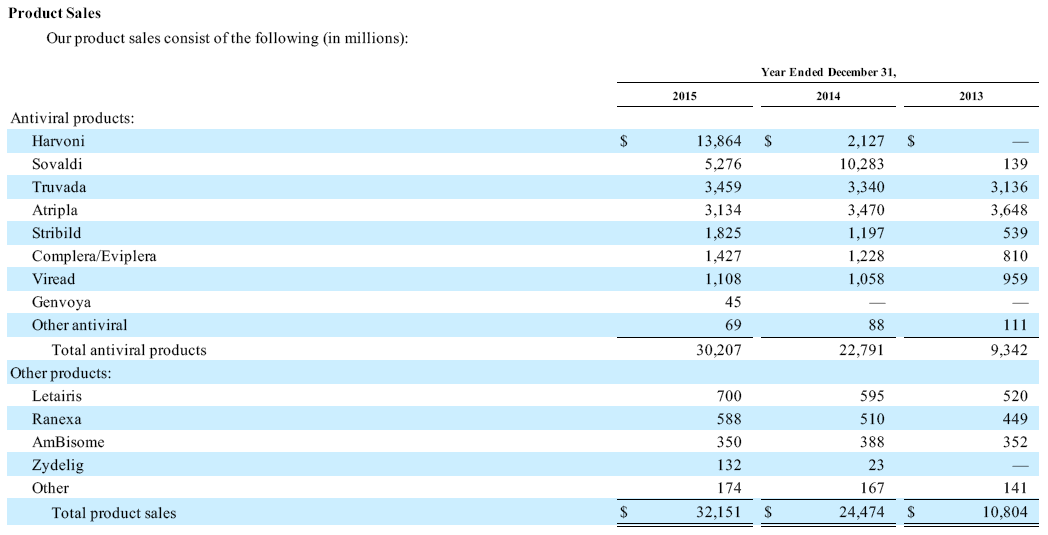
Figure 1. Source: Gilead Sciences 10-K (FY 2015)
I diligently went back and plugged these data into my spreadsheet for the last 10 years, but still, it was hard to say anything useful from a wall of numbers like this:
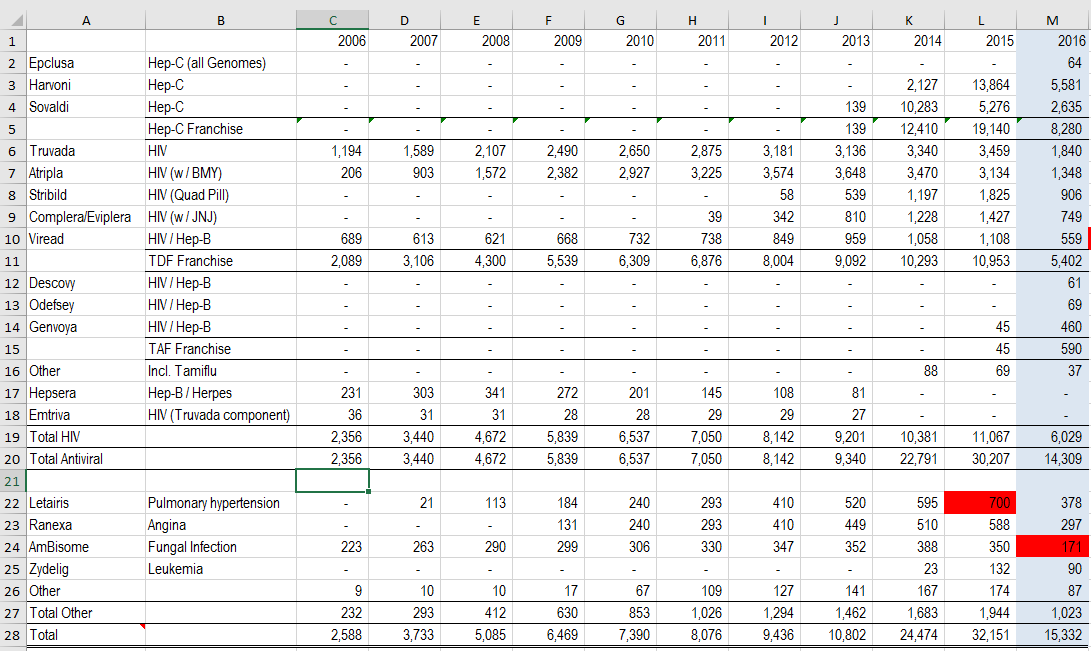
Figure 2. Source: Company Statements, IOI Analysis
It’s time like these when I suggest that people start using their X-System processes (Daniel Kahneman called this Type 1 thinking in his book) and make a graph. Using the X-System to answer a question usually leads to problems (because the X-System is non-analytical and can and is fooled frequently), but it is a terrific tool to figure out the right questions to ask.
Graphing the wall of numbers above, I got this:
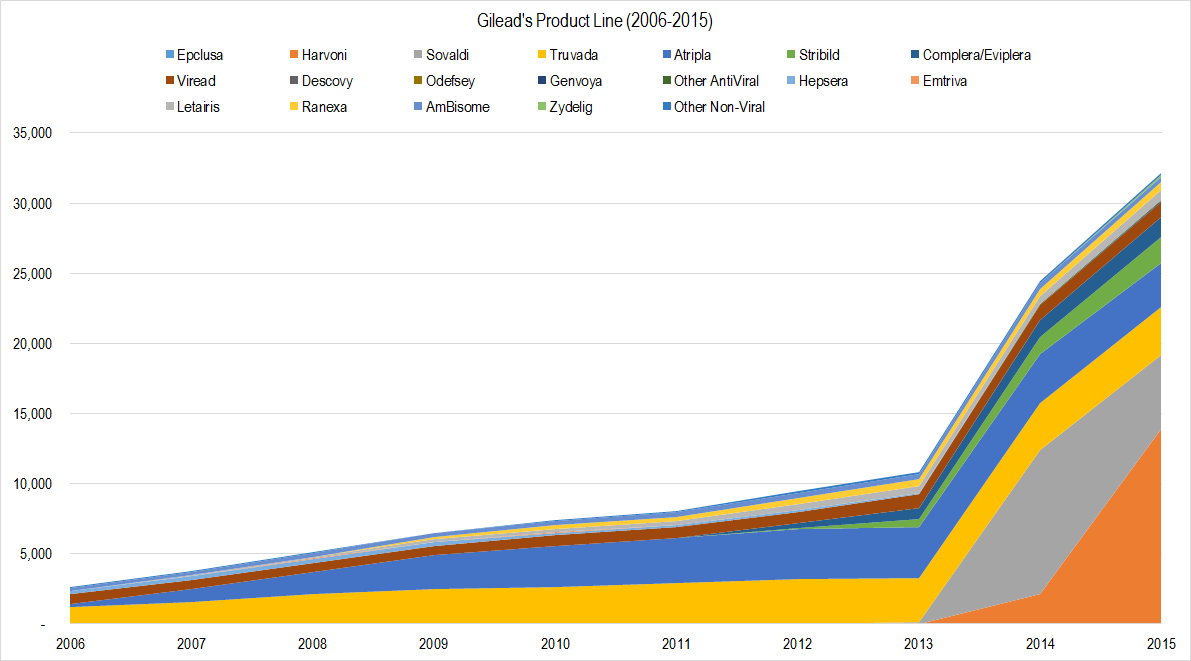
Figure 3. Source: Company Statements, IOI Analysis
This helps in some respects – I can see that Truvada (gold) and Atripla (blue) have consistently been the most important drugs in Gilead’s line-up, and that Sovaldi (gray) and Harvoni (orange) stole the show after 2014 – but it’s still pretty noisy.
At this point, I started digging into the details behind each of the drugs – what diseases they were designed to treat and which molecules were key to them. It took me about three different tries at grouping the drugs – I would read a little and group the drugs to reflect what I had learned. Finally, I came up with this:
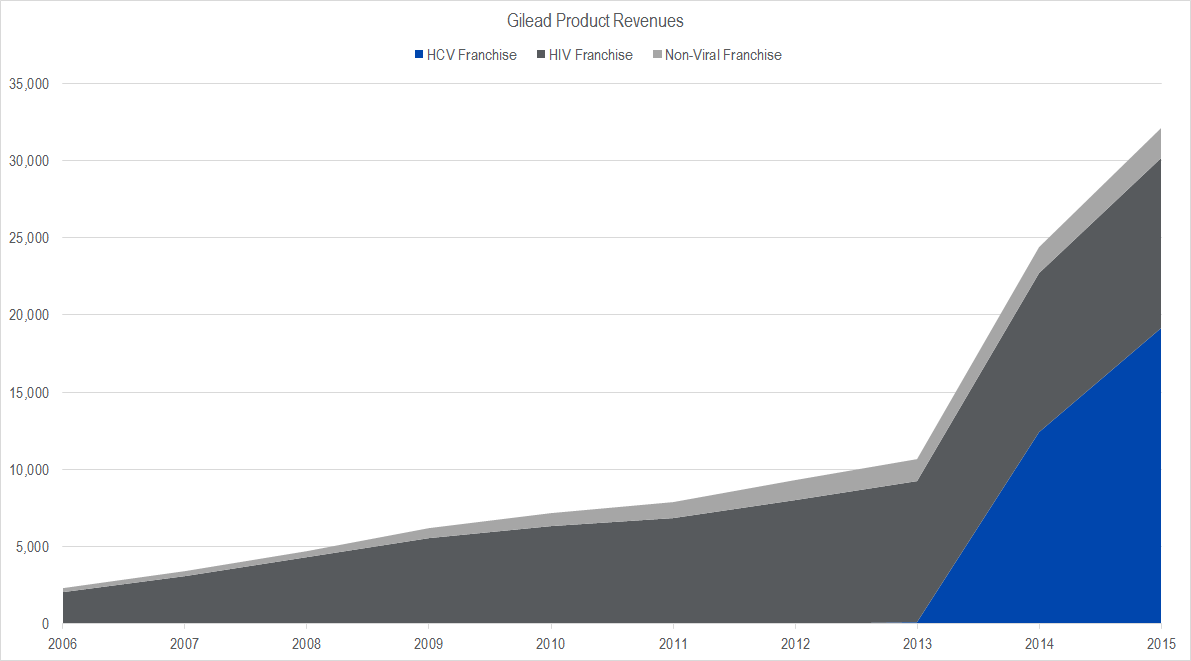
Figure 4. Source: Company Statements, IOI Analysis
It turns out that this view is a bit oversimplified since Gilead’s HIV franchise contains an old-guard line-up (based on a molecule called TDF) and several newly-introduced drugs (based on a molecule related to TDF called TAF). TAF drugs show great promise, both for the treatment of HIV and for hepatitis b virus (HBV). However, patent expiration issues will likely pull down TDF drug sales, meaning that the TAF line is a replacement rather than an extension.
The hepatitis c virus (HCV) treatment franchise (the blue area above) will likely face decreasing revenues from here on out. We discuss the reasons for this, as well as the dynamics surrounding the HIV business, and the possibility of a new blockbuster in the IOI ChartBook on Gilead Sciences that we recently published to IOI members.
If you would like to read more about the process of analyzing Gilead, please see this article on our site, or a modified and shorter version of our article which was published by Forbes. Those of you interested in our IOI Tear Sheet or ChartBook on Gilead are invited to take a trial membership!