Transcript
Once in a while, the market just gets it wrong – even with a big, closely-followed company. We believe the market’s missed the mark with General Electric GE. And while we understand investor frustration with the firm – it’s been a tough decade for shareholders – looking at the firm through the lens of our valuation framework makes us think there is value to be found here.
Our valuation framework focuses in on a handful of fundamental drivers, of which there are only three main ones in the short-term and one related one in the medium-term. We’ll work through each one-by-one.
Revenues
Trying to make sense of General Electric’s top-line is tough because of all the acquisitions and divestitures.

Figure 1. Source: Company Statements, Framework Investing Analysis
There has been so much shuffling of business lines that we are only displaying seven years of revenues – represented by blue columns – and six years of annual change – represented by the black line and read off the righthand scale. During this time, GE divested NBC Universal, sold off its Appliances division and all its consumer-facing financing operations, and acquired French Alstom and a few smaller firms as well.
Underneath all these changes is an organic revenue growth rate in the 3%-5% per year range, all based on the developed world’s need for sophisticated medical devices and transportation, and an insatiable need for power and energy throughout the entire world – developing and developed nations’ alike.
Our valuation assumes that these dynamics will continue into the near future, and project best-case revenue growth averaging 4% per year and worst-case averaging 1% per year over the next five years. For 2017 revenues, we are using sell-side analysts’ high- and low-end forecasts as we think they create a reasonable range.
This is what our graph looks like now – light blue columns being best-case, yellow columns being worst.
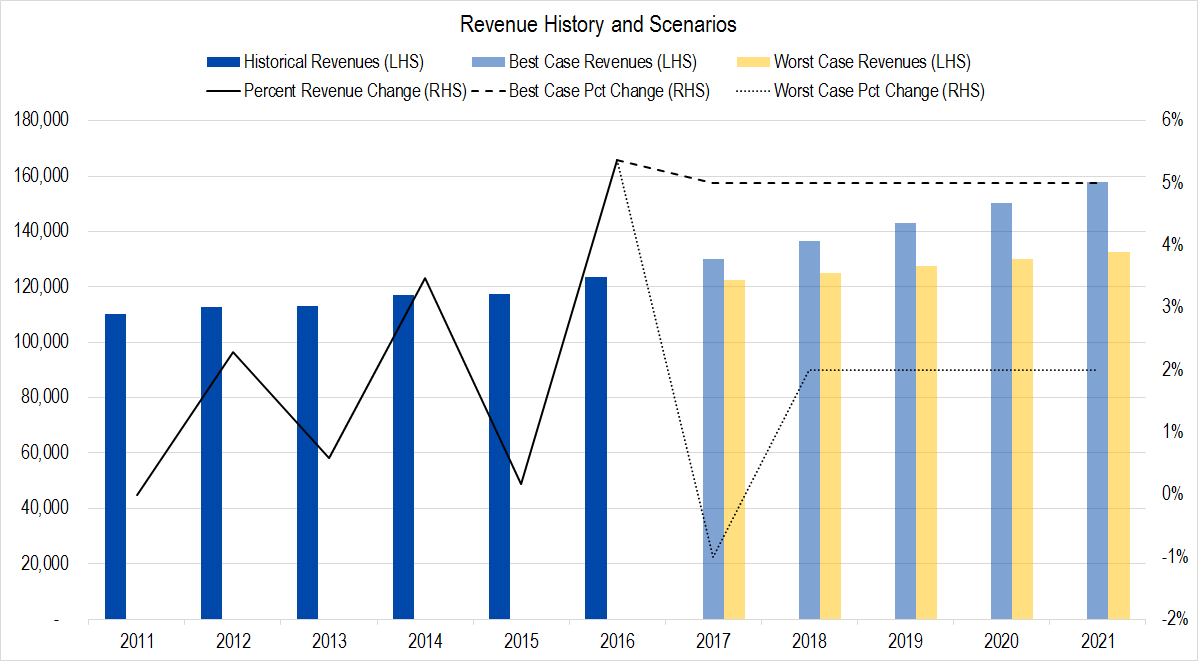
Figure 2. Source: Company Statements, Framework Investing Analysis
Profits
Our preferred metric is called Owners’ Cash Profits – OCP – which is based on the firm’s cash flows.
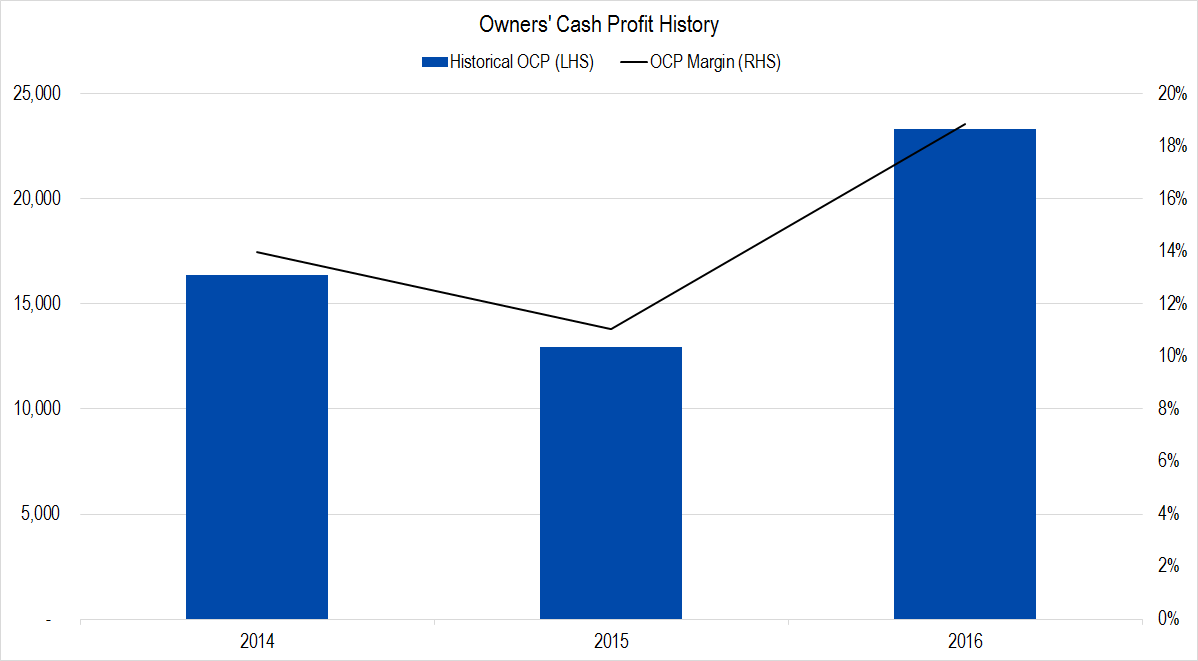
Figure 3. Source: Company Statements, Framework Investing Analysis
GE’s divestments made it challenging to understand how much cash flow GE’s core business is creating and how efficiently the firm will be able to convert revenues to cash-based profits in the future. This graph shows what we think is the most representative version of the last three years of GE’s profits – an OCP margin ranging from 11% to 19%.
As we pointed out in another video, this OCP margin level is within the ballpark of competitor Honeywell’s.
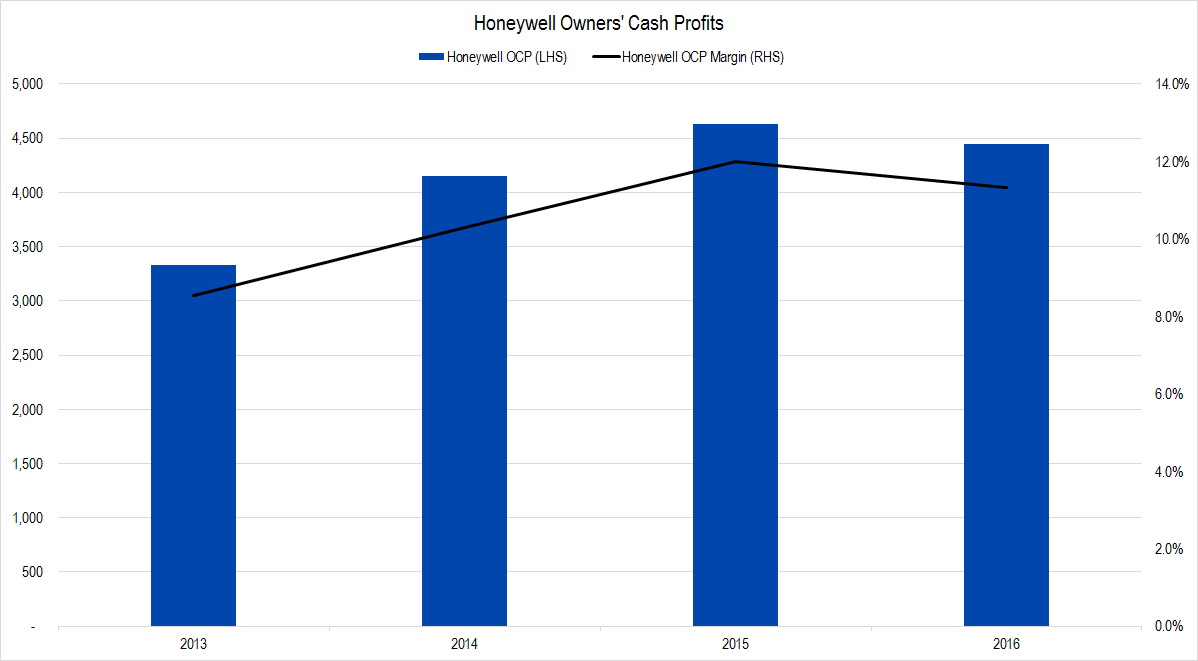
Figure 4. Source: Company Statements, Framework Investing Analysis
These margin levels also triangulate well to the Industrials business’ operating margin – also known as EBIT margin.

Figure 5. Source: Company Statements, Framework Investing Analysis
After considering these datapoints, we are forecasting OCP margins to range between 14.0% in the best-case to 10.5% in the worst-case. Inputting those assumptions into our model gives us the following chart.
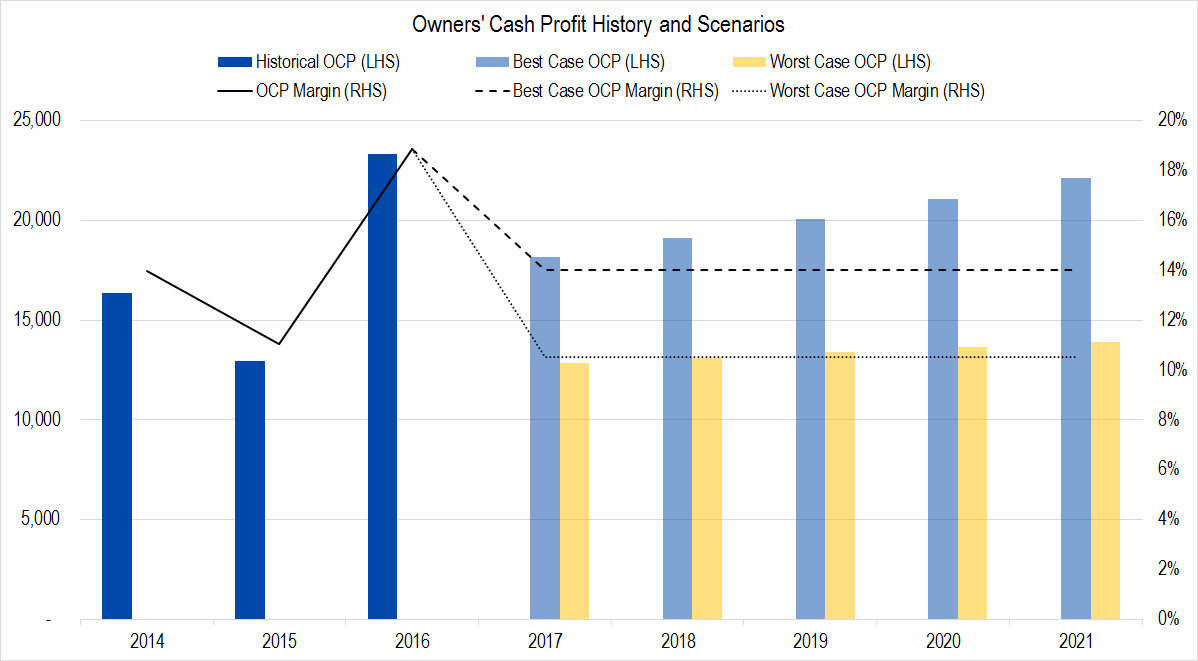
Figure 6. Source: Company Statements, Framework Investing Analysis
Investment Spending
In this graph, the wide gray columns represent Owners’ Cash Profits generated by the firm and the blue columns, the amount the company spent on investments. While we usually include acquisitions and divestitures in our analysis of investment spending, the amount of this activity in GE’s case muddies the water rather than adding clarity. This chart shows GE typically spending less than 10% of its profits on growth investments right now, after acquisitions and divestments are excluded. Considering GE’s competitive position in its industries, we think this makes sense.

Figure 7. Source: Company Statements, Framework Investing Analysis
We think the possibility of other acquisitions is real, so have assumed that the company will spend about 15% of its profits on growth investments – roughly the same as it spent in the 1990s. With this assumption, we figure GE will be generating between $0.09 and $0.11 of Free Cash Flow to Owners (FCFO) for every dollar in revenues generated over the next five years.
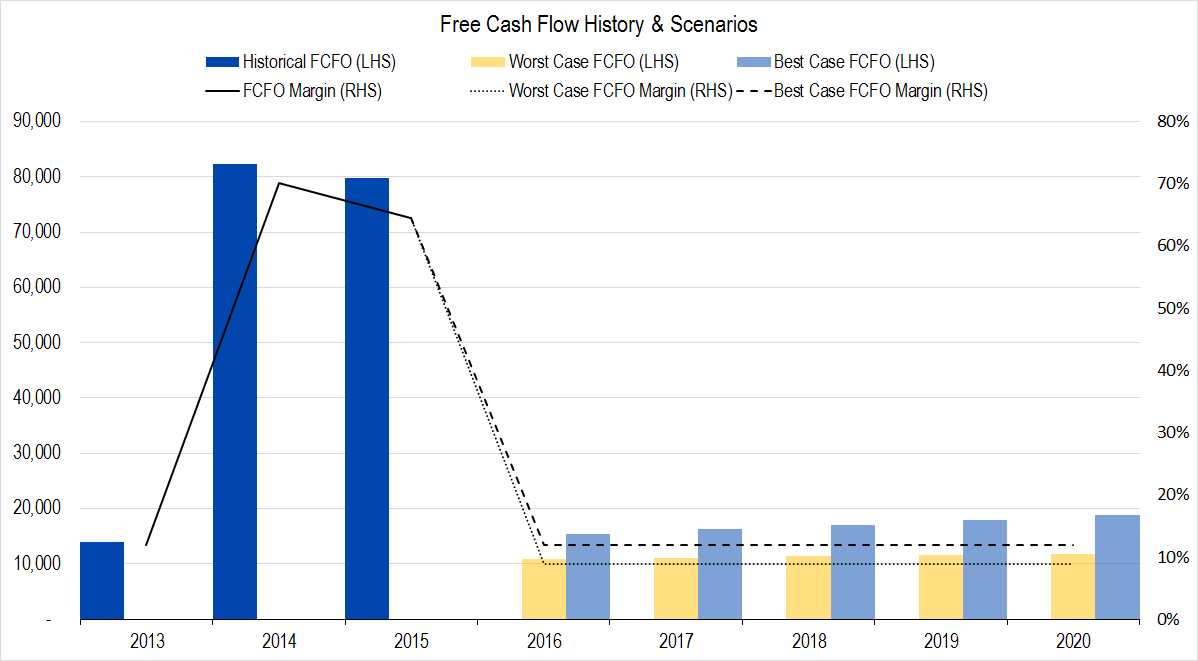
Figure 8. Source: Company Statements, Framework Investing Analysis
Medium-Term Growth
GE has made some smart investment decisions in the past few years and has a strong portfolio of differentiated businesses with wide economic moats around each. We are forecasting medium-term cash flow growth of 7% per year in the best case and 5% per year in the worst.
Valuation
Pulling this all together gives us a best-case valuation of $41 and a worst-case valuation of $24 per share with an equal weighting of all our eight valuation scenarios at $32 per share.
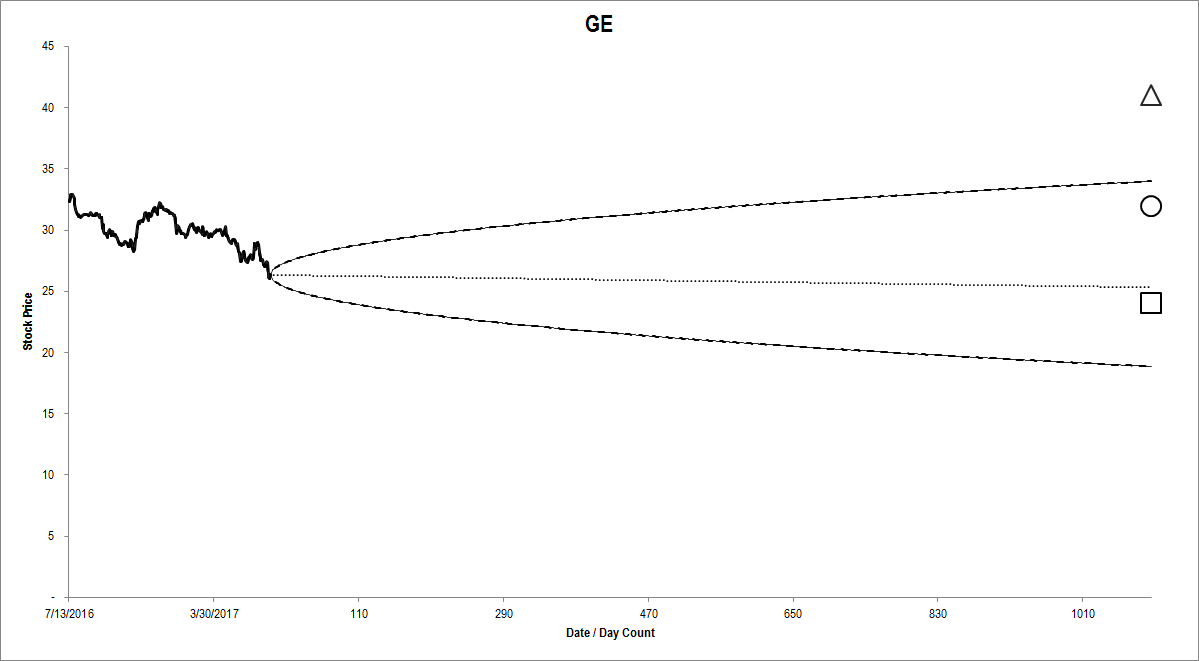
Figure 9. Source: Company Statements, Framework Investing Analysis
You can plainly see that the option market’s implied future price range lies well below our estimated valuation range. The option market’s best-case price projection for three years from now is only around $34 per share, and the worst-case price projection is around $19 per share – 20% lower than our worst-case valuation scenario.
People that know a little about options often talk about implied volatility being “high” or “low” and I always chuckle. Because options are directional instruments that split upside from downside, implied volatility is not monolithic, but directional. The case of GE is a perfect example – upside implied volatility is too low while downside implied volatility is too high. This is why we published two Tear Sheets to Framework members highlighting two different option strategies to use to invest in the company.