Over the past few weeks, I have been researching microcontroller and analog chipmaker, Microchip Technologies MCHP. While my first-pass valuation did not paint a promising picture of Microchip as an investment, I listened into the company’s second quarter earnings conference call and, doing so, realized that the company was worth a further look.
This article walks step-by-step through each valuation driver for Microchip, explains my valuation assumptions, and provides a copy of my valuation model. For those of you anxious for the punchline, at Microchip’s present stock price of $75 / share, the firm looks undervalued by nearly 50%.
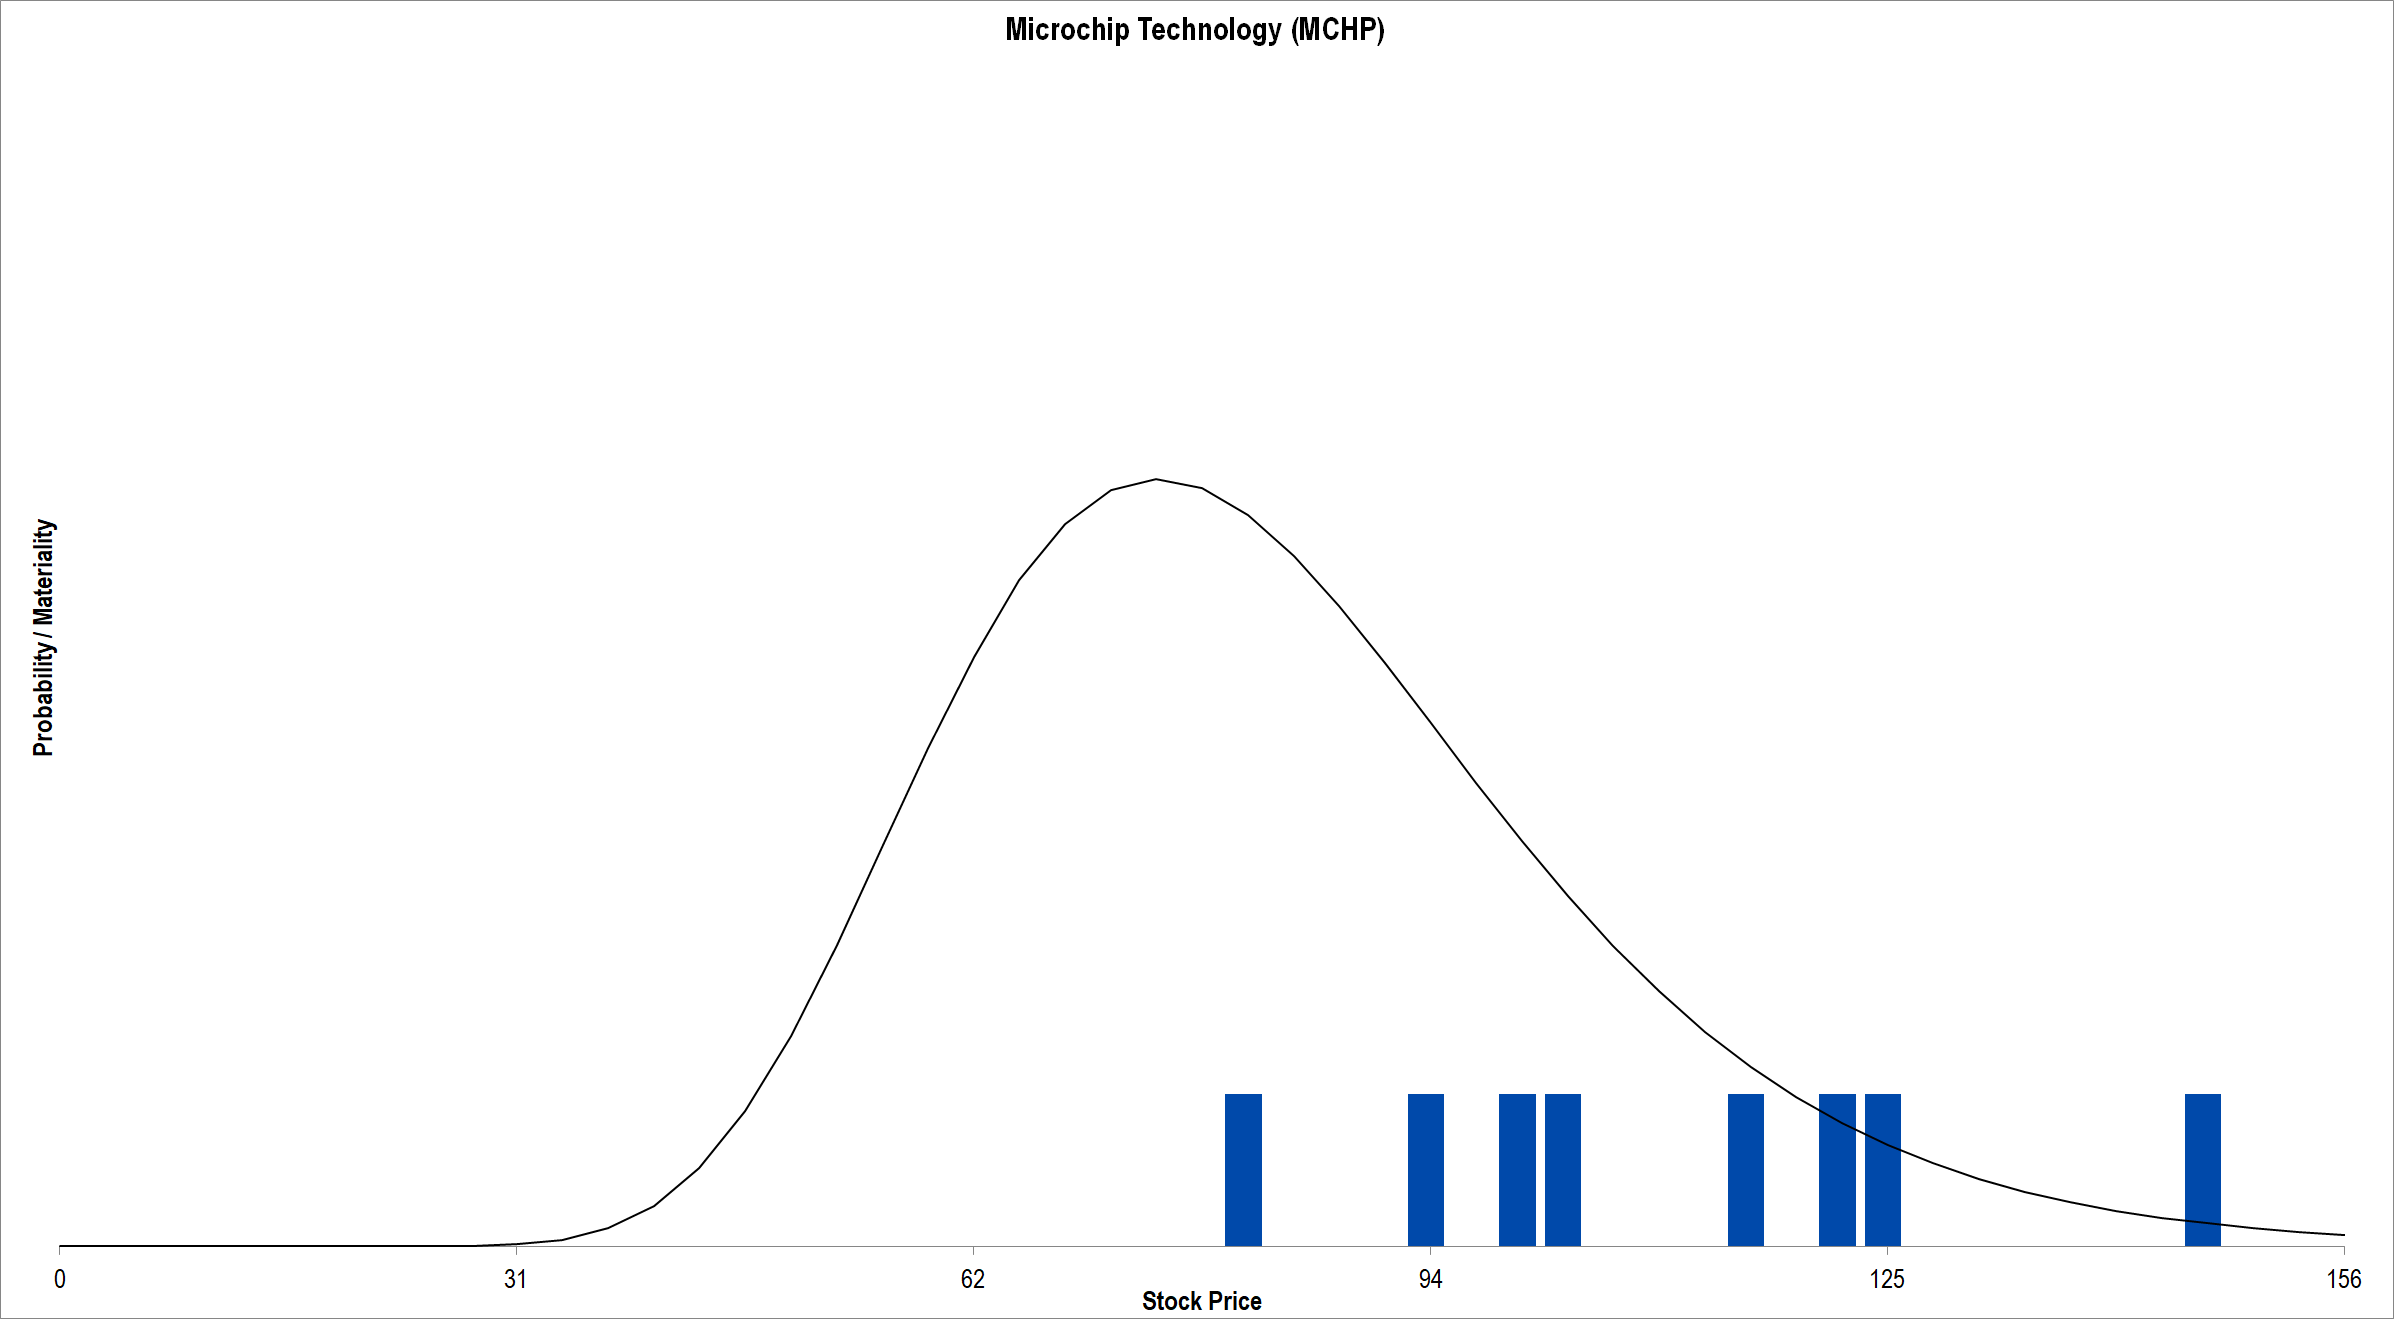
Figure 1. Source: CBOE (data), Framework Investing Analysis. The present stock price lies just left of the left-most valuation scenario, meaning that all valuation scenarios fall above the present stock price. The average of all scenarios is $112 / share, representing a 49% rise from its present price.
For more information about the business environment in which Microchip competes, please see the detailed summary, A Closer Look at Microchip.
Revenues
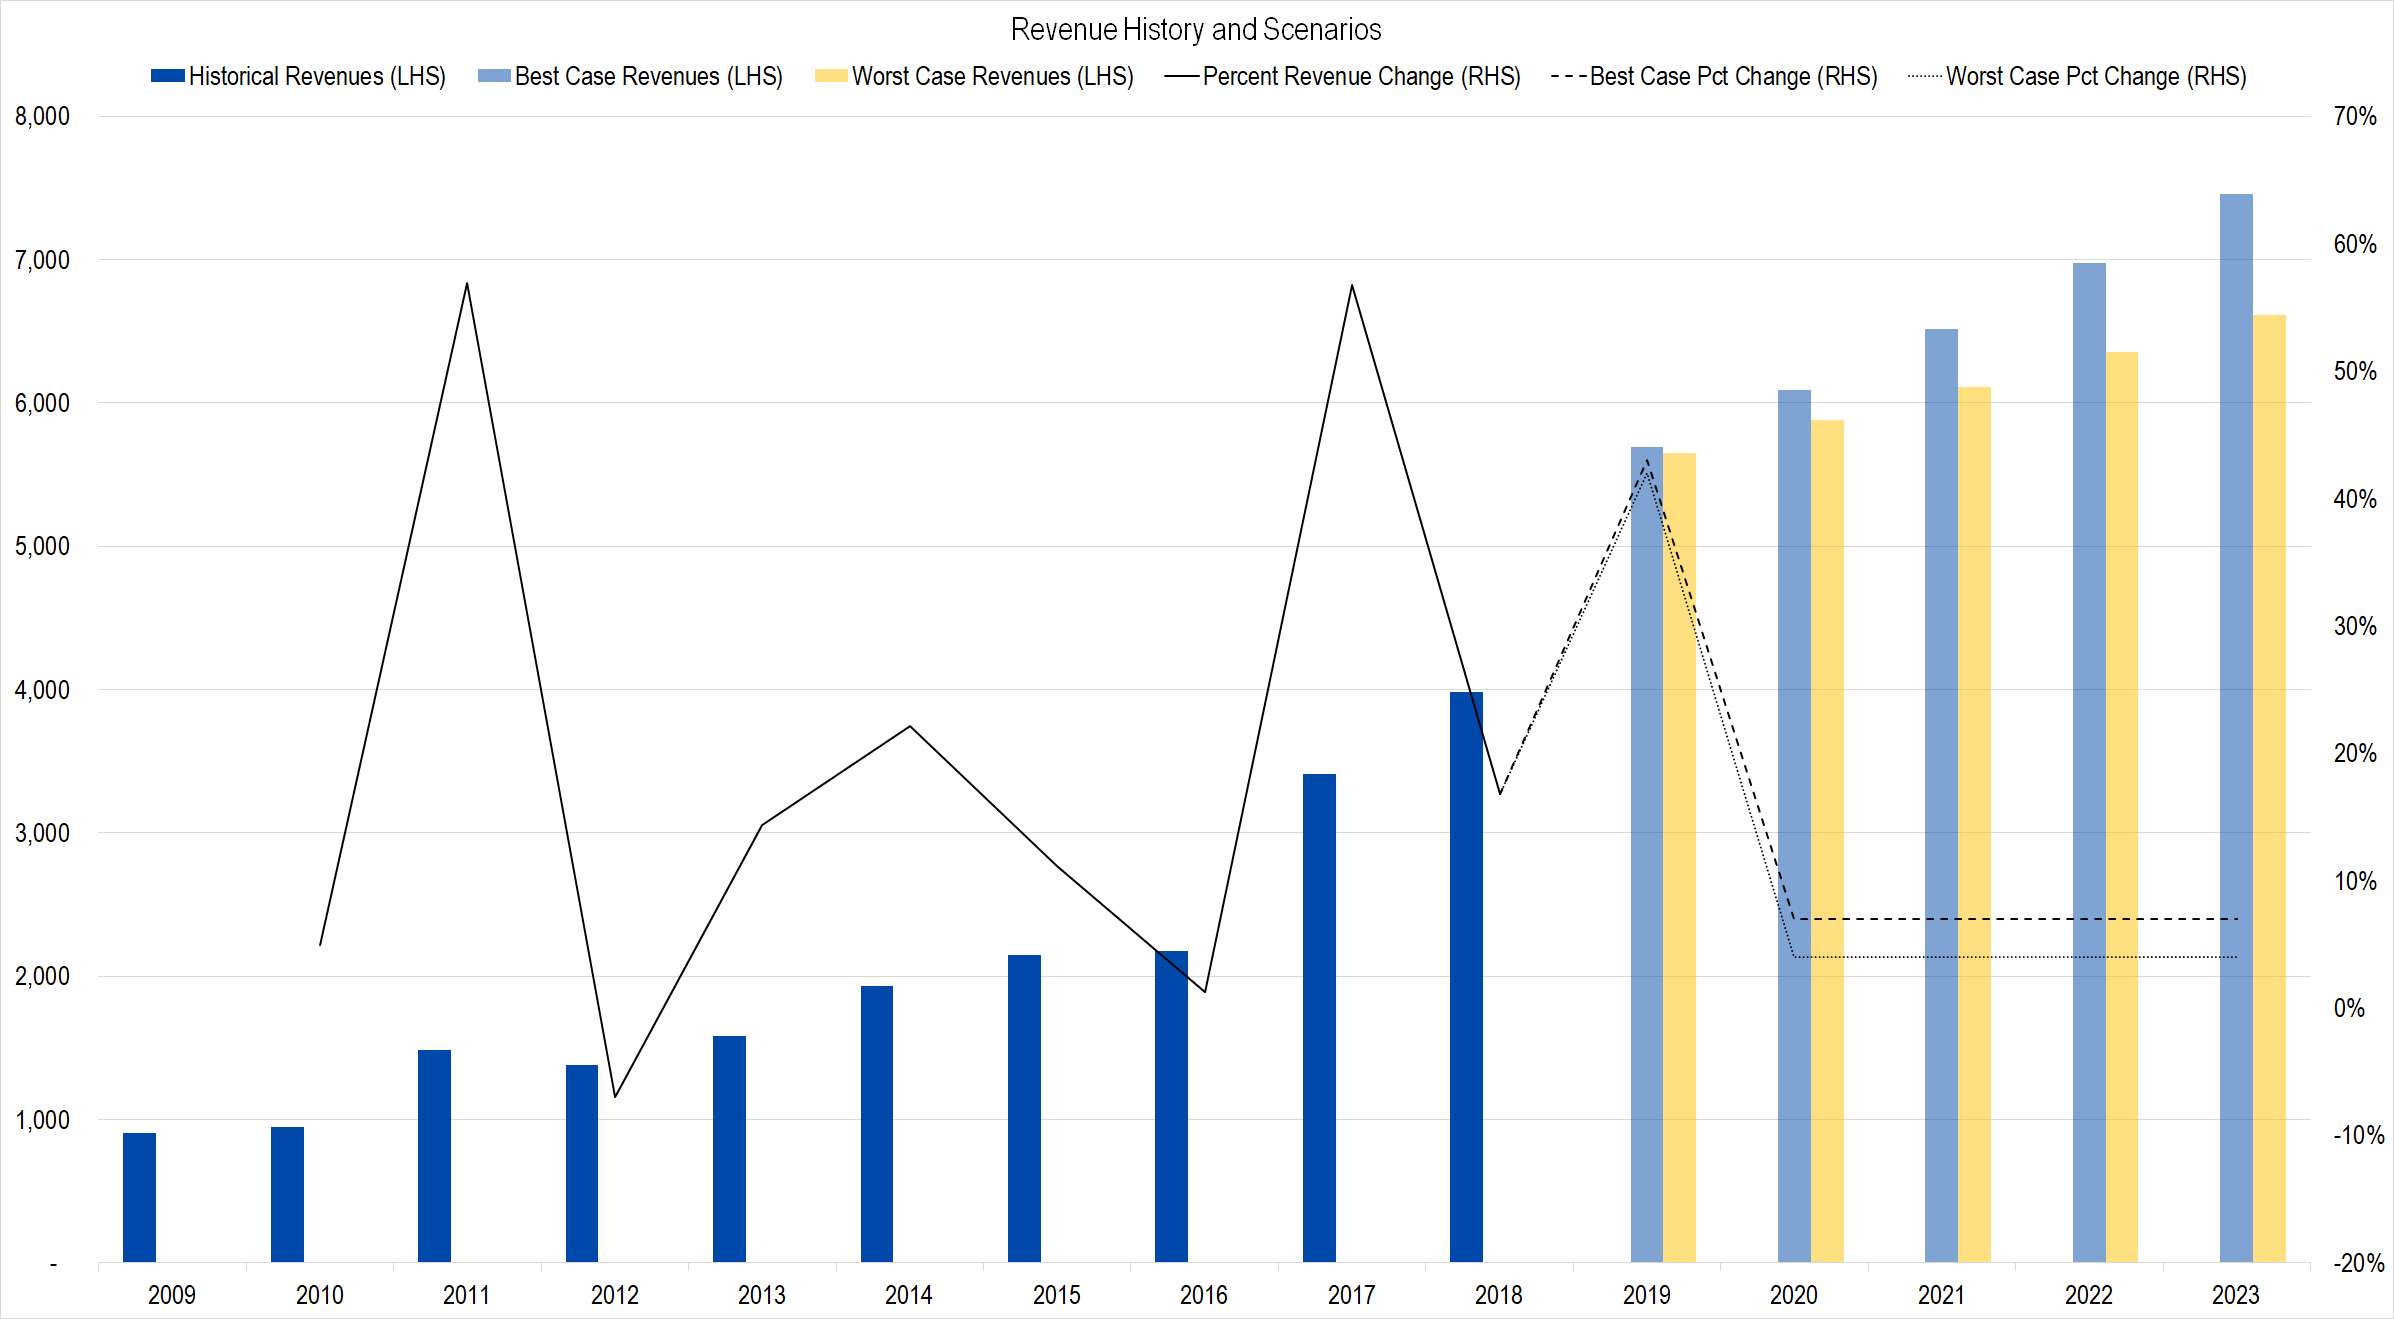
Figure 2. Source: Company Statements, Framework Investing Analysis
The huge jumps in historical revenues represent prior acquisitions. Fiscal year 2019’s 40+% revenue increase is driven by the $10.3 billion acquisition of Microsemi, an analog chipmaker focused on industrial applications.
(Microchip’s fiscal year ends in March of the year, so FY18 is the fiscal year ended on March 31, 2018.)
In subsequent years, I have assumed a best-case revenue growth rate of 7% per year. This is identical to IDC’s forecast for growth in the microcontroller market over this period.
I believe that in the best-case scenario, Microchip will gain microcontroller market share over this period, suggesting that the half of revenues generated by microcontroller sales will grow faster than the IDC forecast.
The remainder of Microchip’s revenues – generated through analog, FPGA, and memory chips in addition to IP licensing fees – will grow slower than the market for microcontrollers. The view on Microchip ex-microcontroller revenue growth is not a carefully studied position, though industrial analog revenue growth does tend to be slow. I will revise this assumption as more data becomes available.
My worst-case assumptions for 2020-2023 revenue growth is pegged to 4% per year – a rate more typical of industrial analog firms’ organic revenue growth. This average growth rate projection includes the possibility of revenue slowing during a recession, followed by a return to trend growth.
Profits
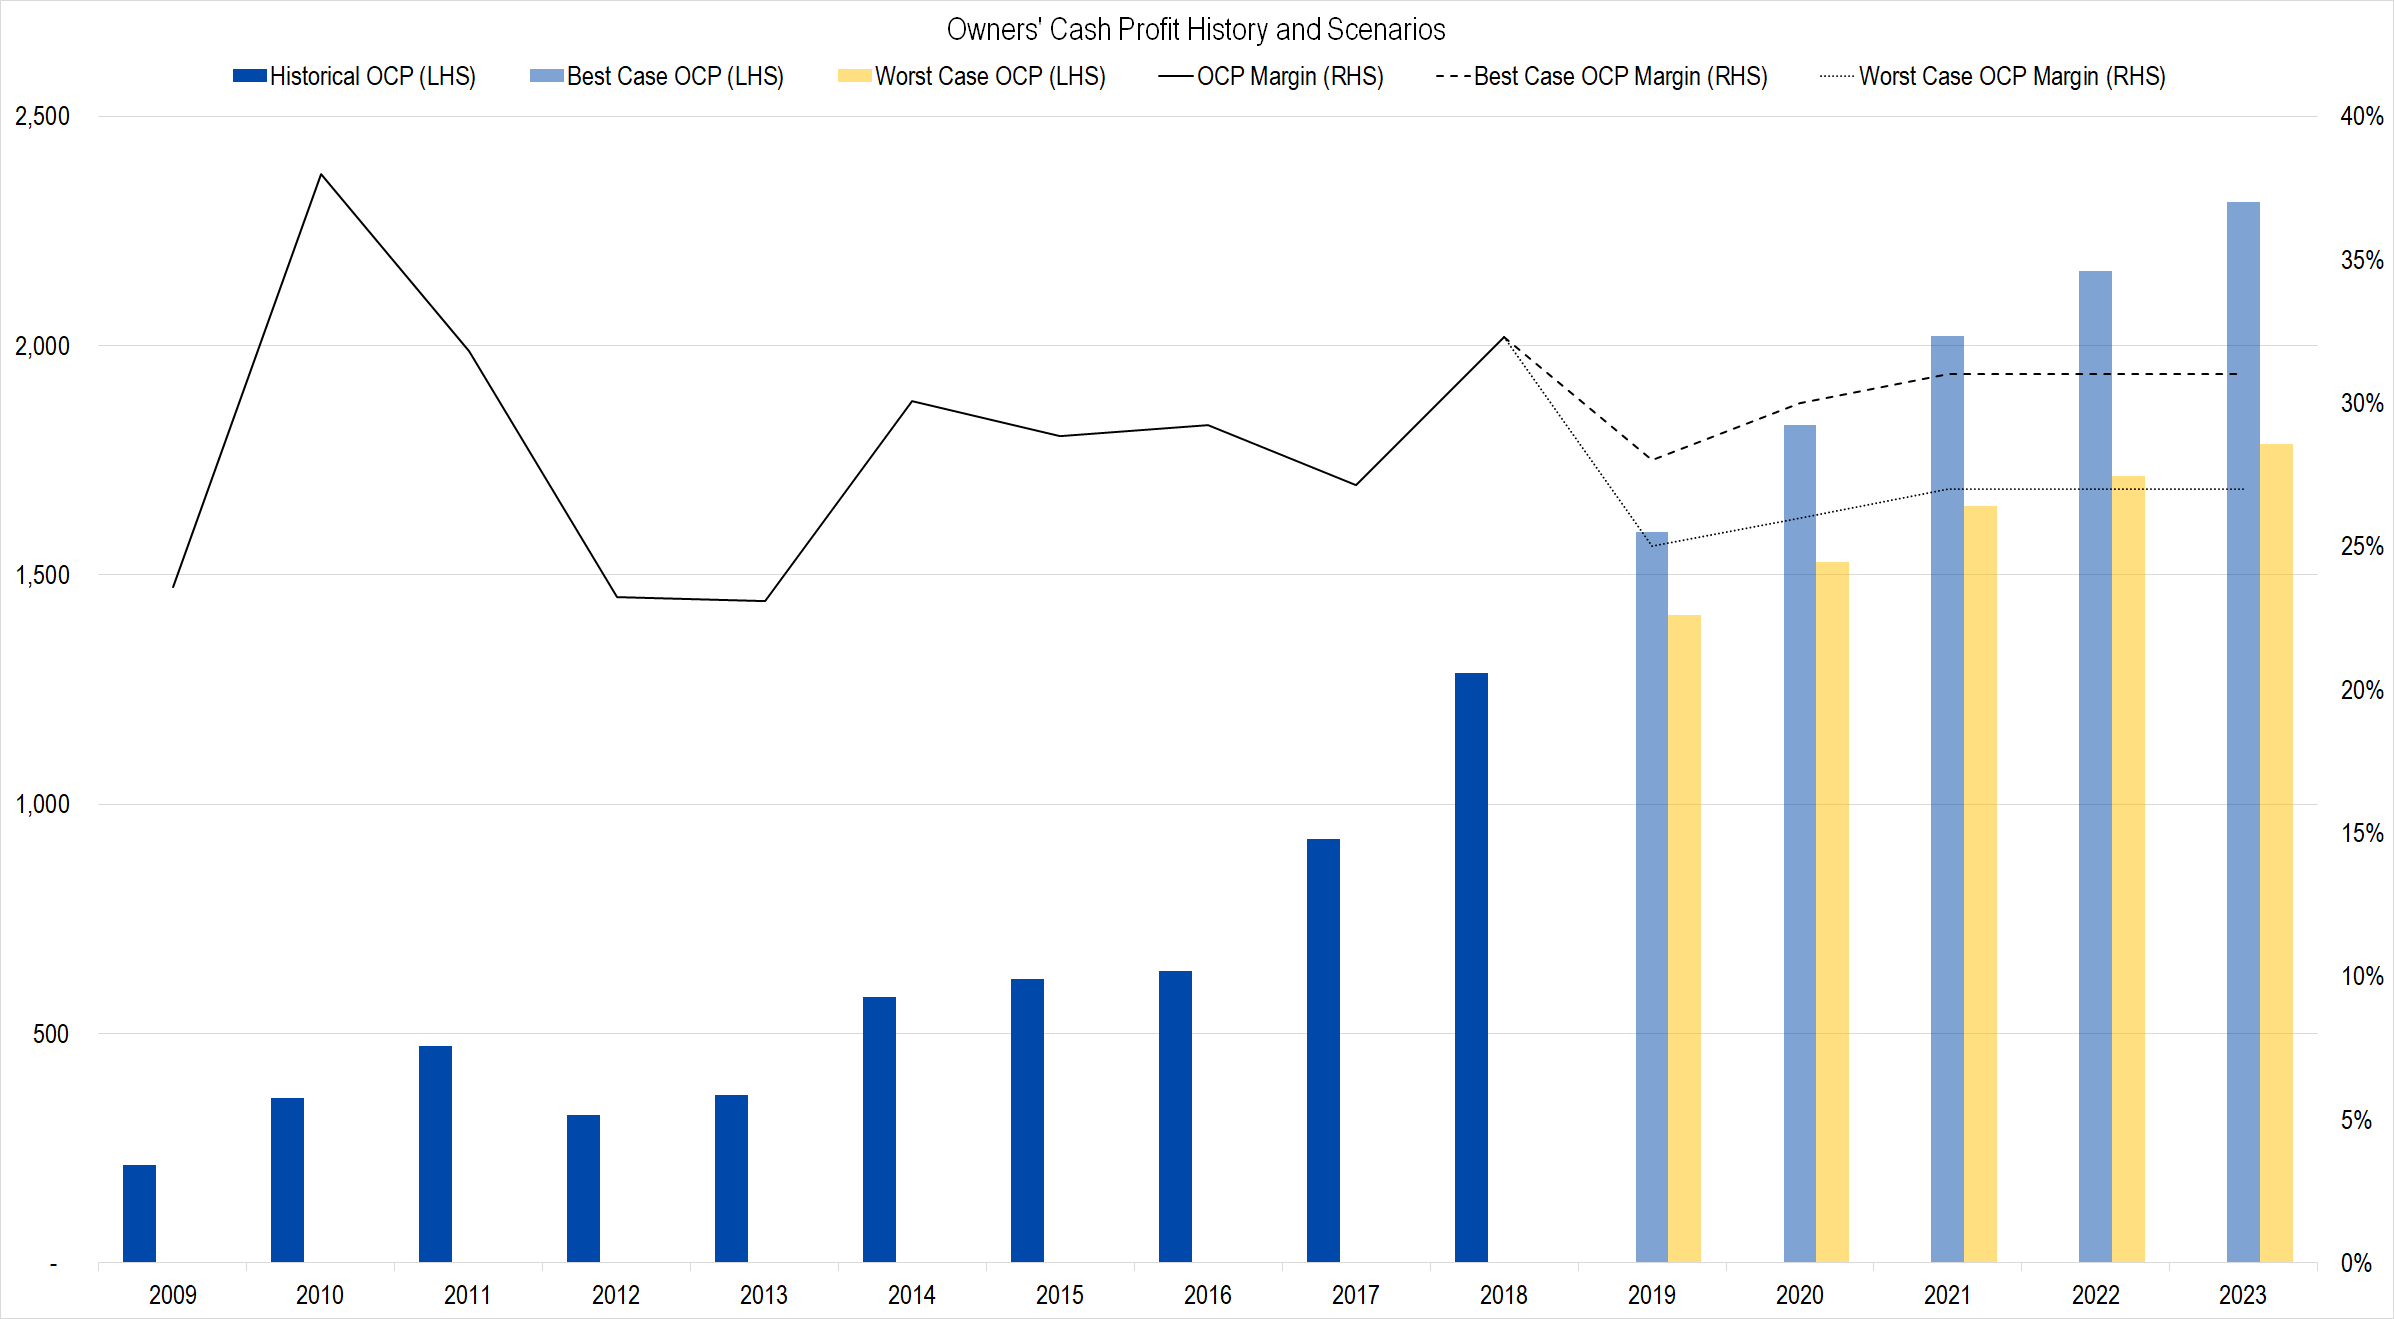
Figure 3. Source: Company Statements, Framework Investing Analysis
The biggest driver of the change in fair value from my first-pass valuation to this one relates to my change in assumptions for Owners’ Cash Profits (OCP) based on an analysis of the firm’s maintenance capital requirements.
My baseline maintenance capex assumption is based on the Total Depreciation and Amortization (D&A) line item of the Statement of Cash Flows, whose calculation is mandated by Generally Accepted Accounting Principles (GAAP).
My first valuation model used GAAP D&A to estimate the firm’s maintenance capital requirements. As a reminder, this is the graph showing historical and forecast profitability in my first valuation model. Note the difference in normalized forecast profits in the figure below compared to figure 3.
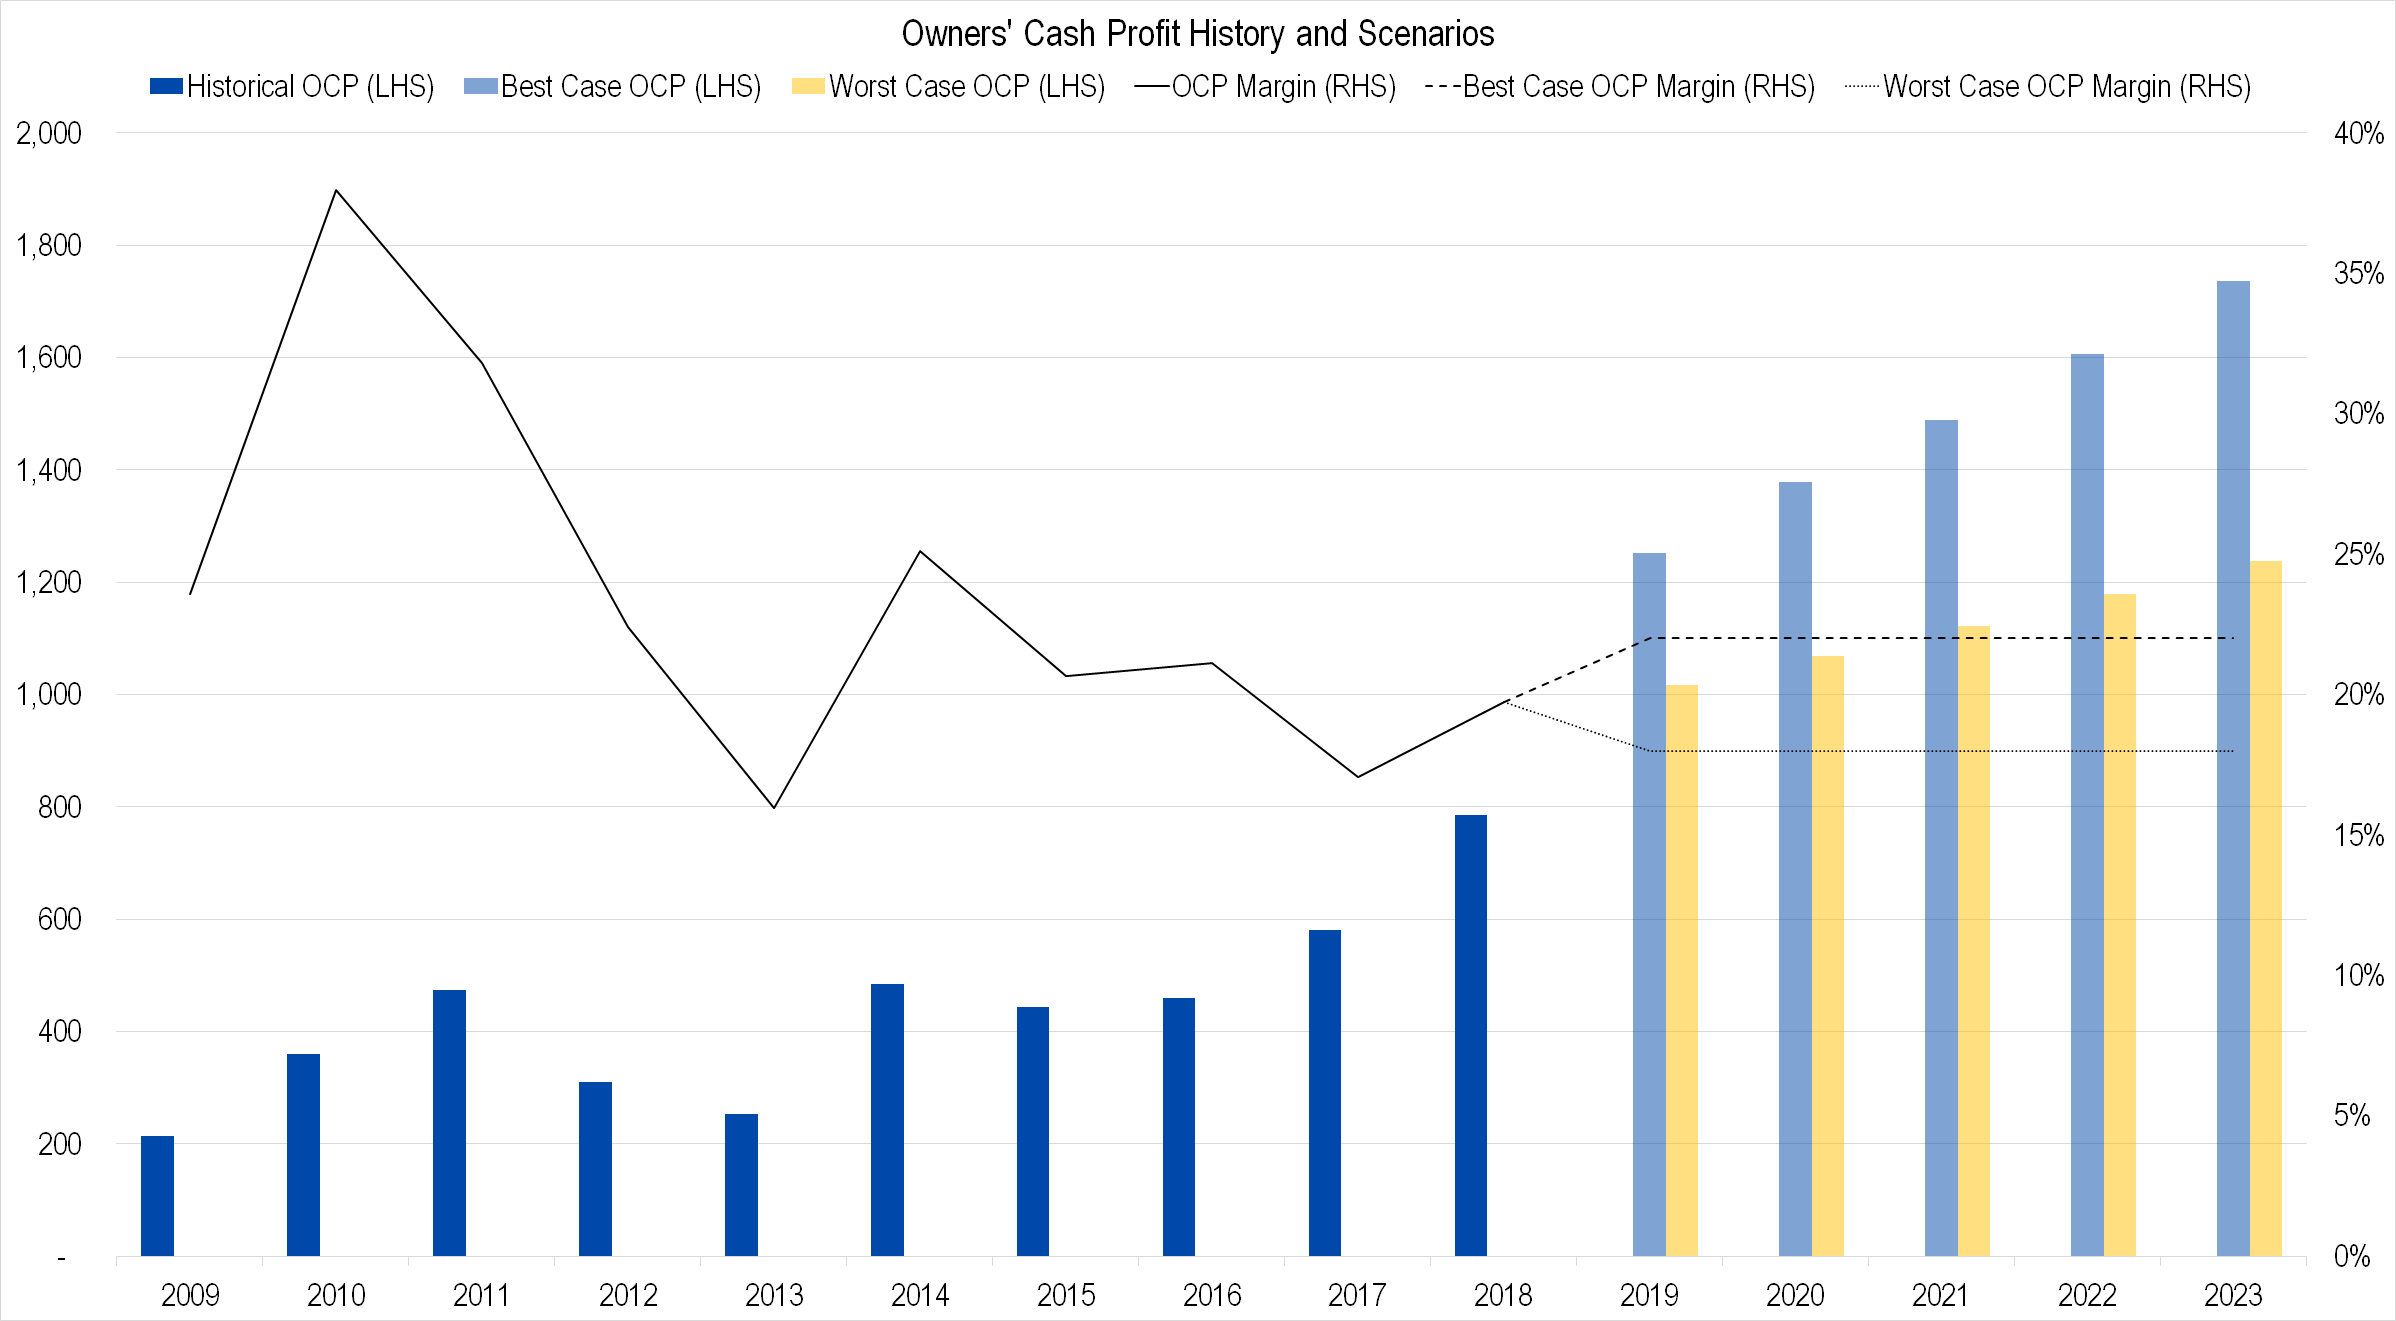
Figure 4. Source: Company Statements, Framework Investing Analysis
After reviewing the financial statements and speaking with the company’s CFO, however, I have come to believe that – due to Microchip’s almost yearly acquisition of other firms during the last decade – the GAAP amortization charge does not represent an economic cost to the owners of the business. Or, in simple language – we can gross up OCP by the amount of amortization related to acquisition activity.
Here is an accounting for the intangible assets purchased by Microchip in its acquisition of, mainly, Atmel (FY17) and Micrel (FY16):

Figure 5. Source: Microchip Technology FY 2018 10-K
The largest line item – “Core and developed technology” – refers to designs and know-how that is not represented by tangible assets. While technology improves over time, an understanding of the base technology allows a company to make innovations in the future. As such, the value of previously-developed technology only decreases if the company does not continue to develop innovations based on that base. Microchip is certainly doing this and the cash cost of the development is reflected in the company’s Cash Flow from Operations.
Considering this, I believe that counting an amortization charge as economic would double-count the true expenses of the firm.
The “customer-related” assets can be discarded for a similar reason.
These adjustments mean that using Non-GAAP numbers to compute OCP is, in this case, more valid than using the GAAP numbers. Comparing OCP margin using GAAP vs. Non-GAAP estimates, we get the following graph.
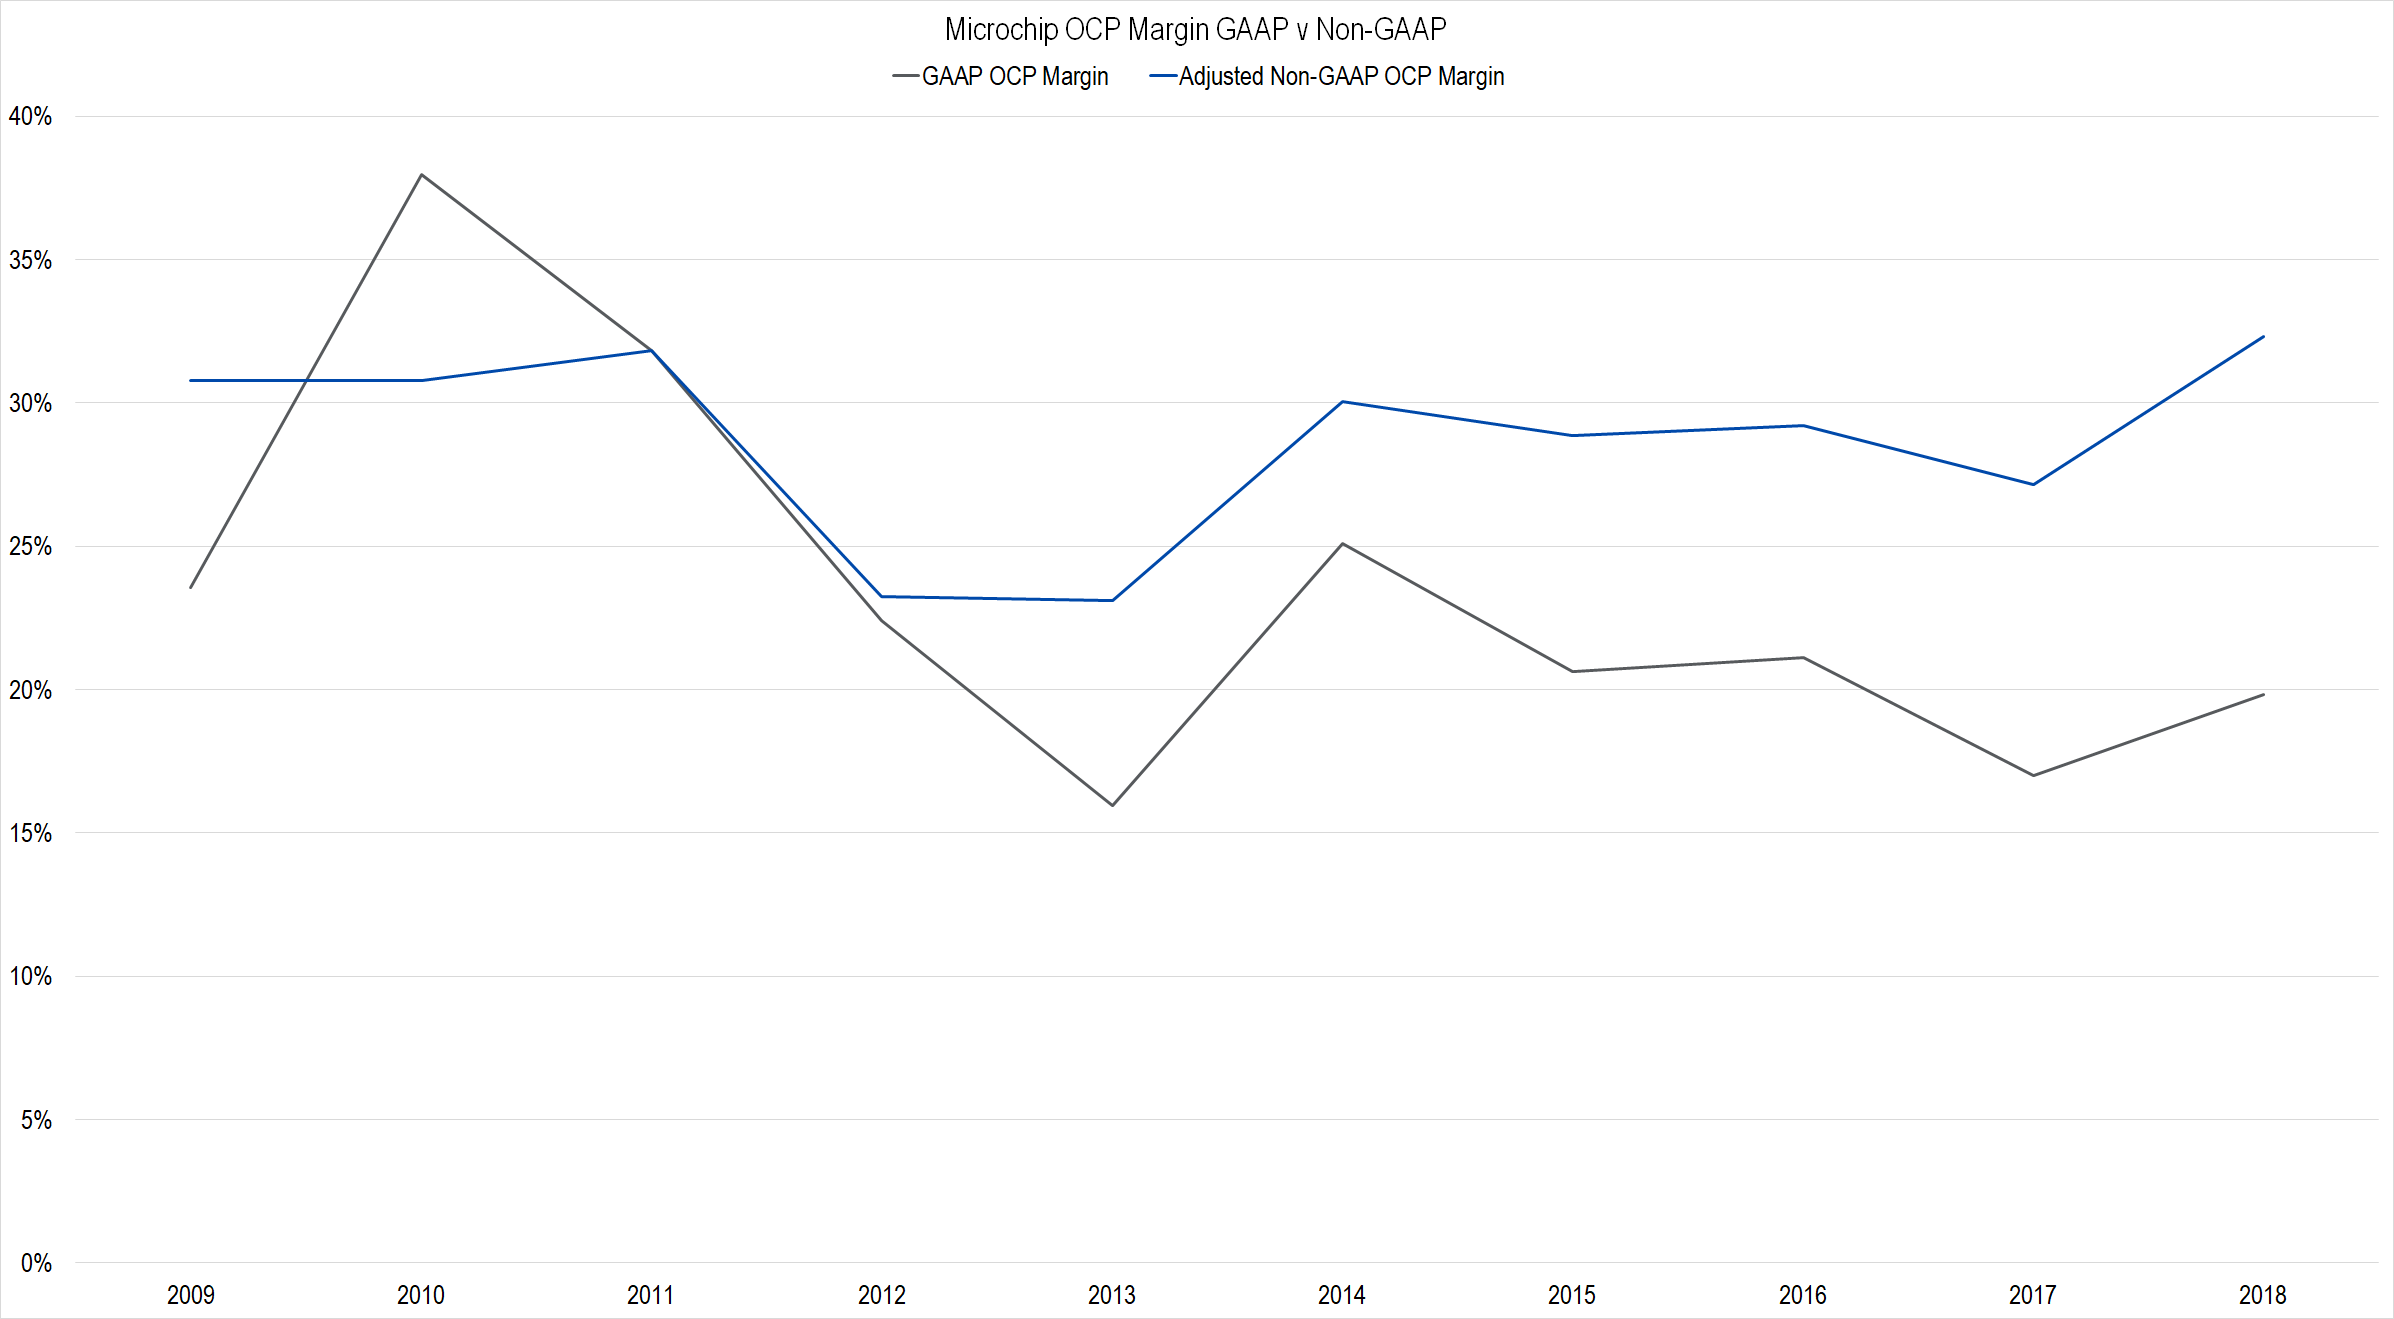
Figure 6. Source: Company Statements, Framework Investing Analysis. Note that the blue line of this graph normalizes the bust year of 2009 with the rebound year of 2010 to offer a view of what profitability looked like over the entire 24-month period. This adjustments is in addition to the adjustments to GAAP amortization detailed in the text.
The graph above presents two very different pictures of the firm. The gray, GAAP margin line shows a company struggling to hold onto profitability; the blue Non-GAAP line shows a company that has continued to generate stable profits in the $0.30 per dollar of revenue range.
Using these adjustments and looking at the first two quarters of FY 2019, the company has generated an OCP margin of around 26%. For the first year of our forecast, we use a worst-case margin of 25% and a best-case one of 27%.
In 2020, I believe the firm is likely to continue to face a profitability headwind as its integration of Microsemi continues apace and have set margin forecasts to 30% and 26% in the best- and worst-case, respectively. Subsequent to that, I forecast best- and worst-case margins of 31% and 27% respectively.
Investments
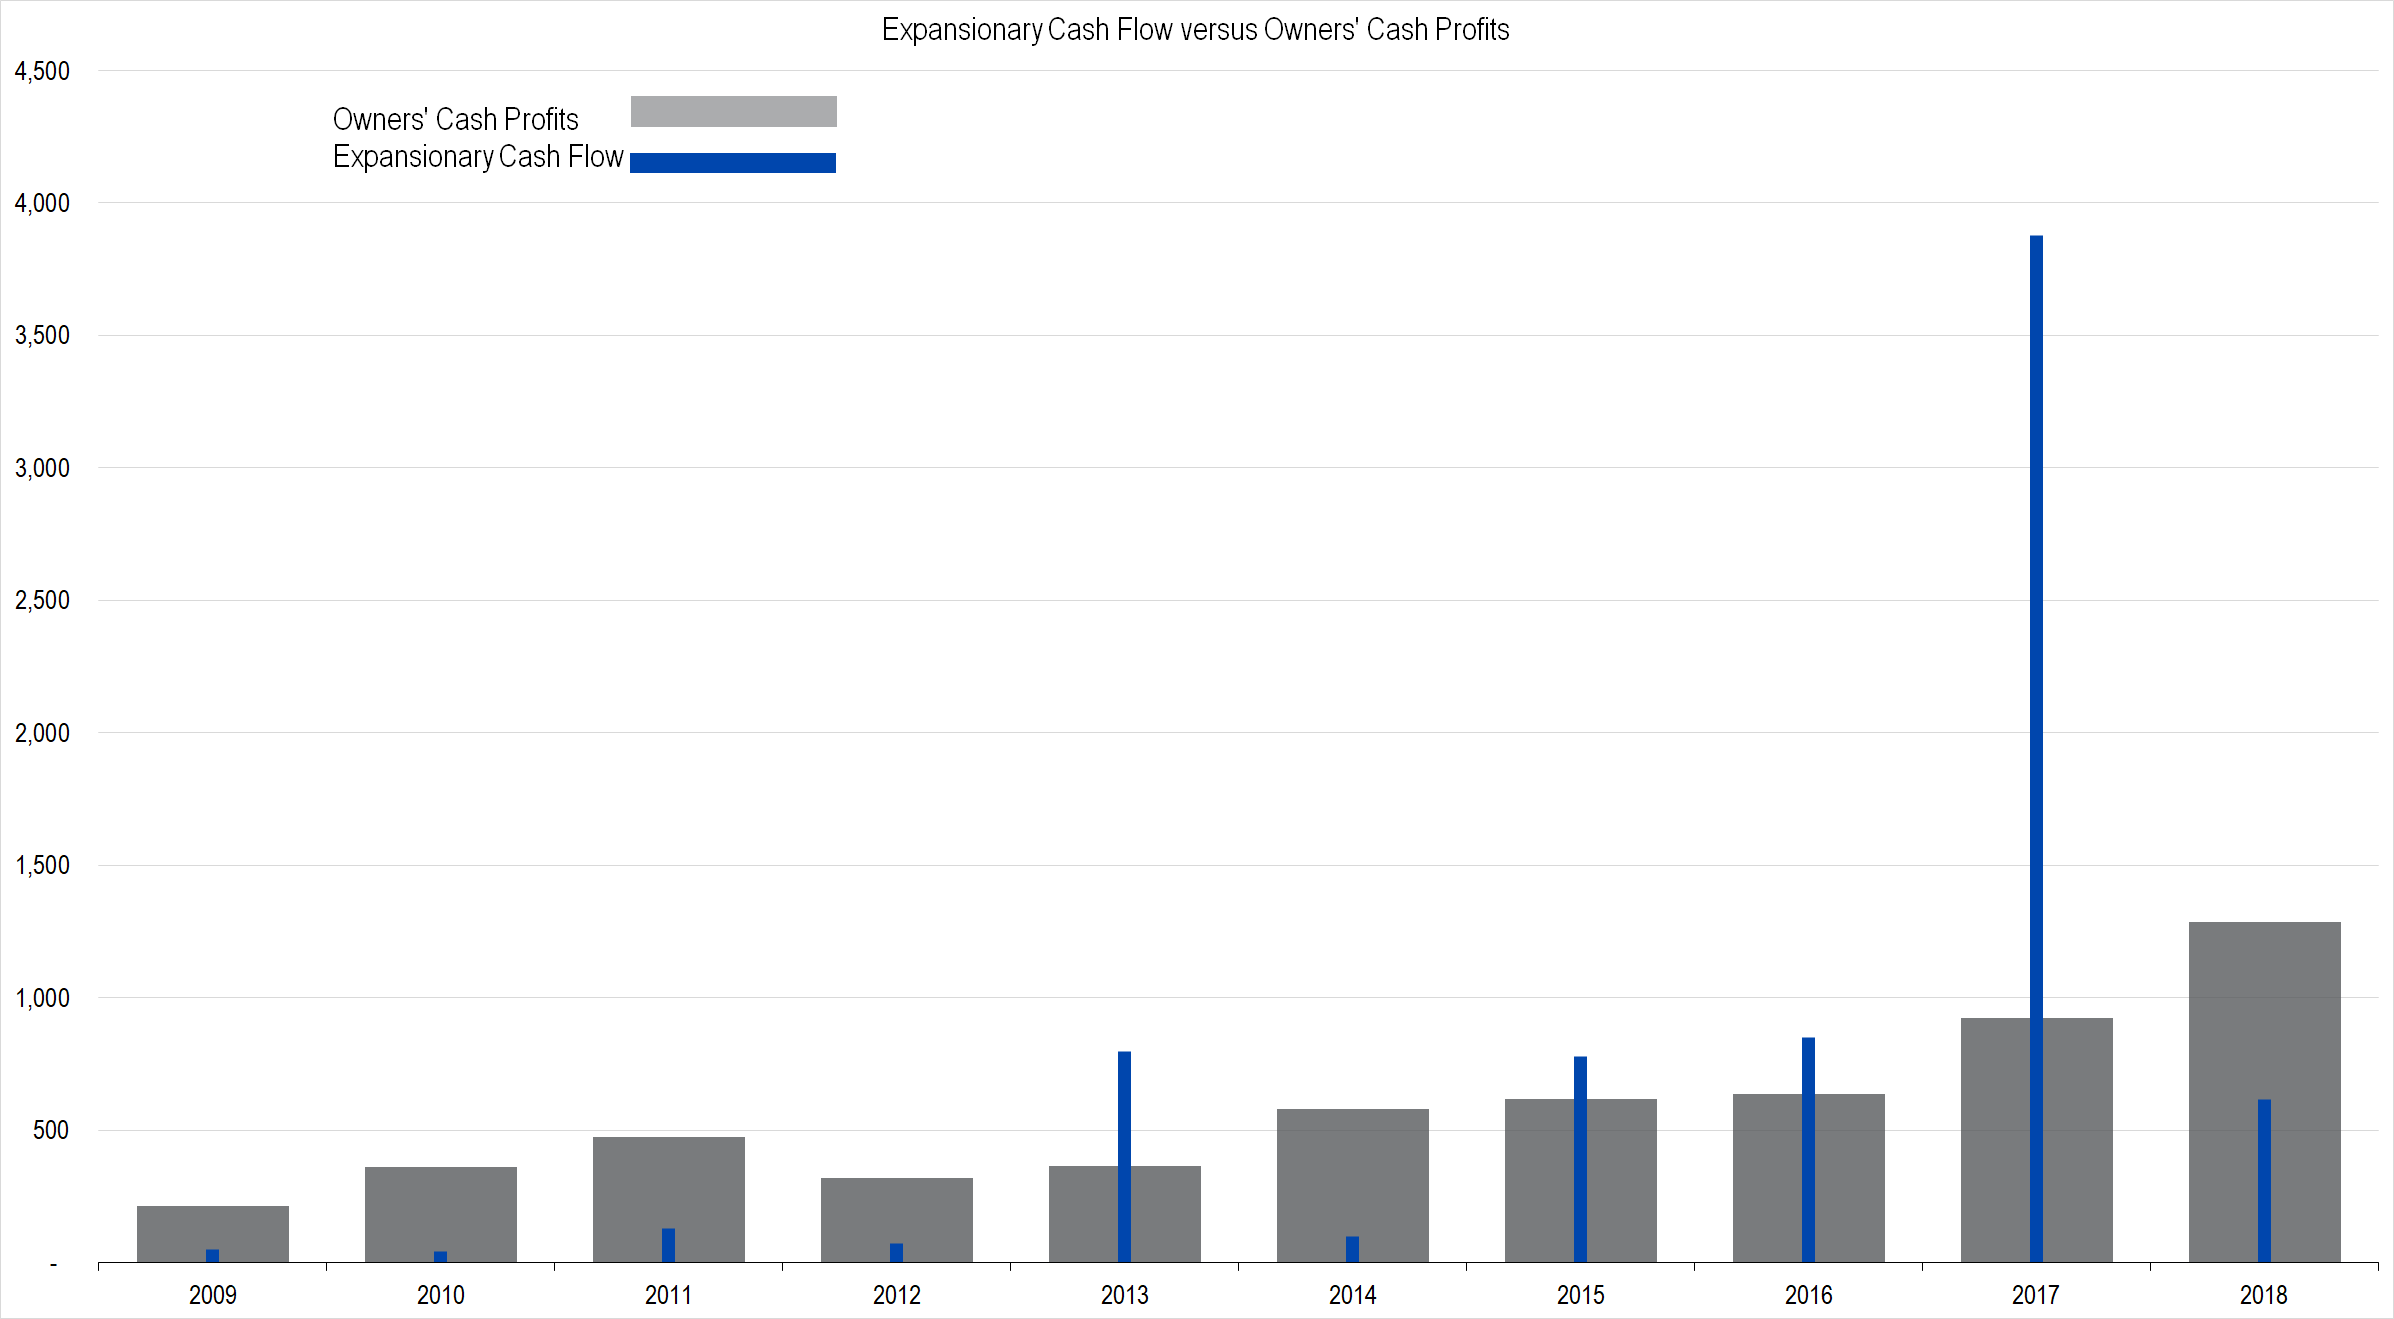
Figure 7. Source: Company Statements, Framework Investing Analysis
The notable FY 2017 investment where Expansionary Cash Flow (ECF) totals 419% of OCP includes the cash and stock acquisition of Atmel Corporation. In FY 2016, Microchip acquired Micrel, also for a combination of cash and stock. The fiscal year before, Microchip acquired Taiwanese firm ISSC and Supertex, both of which look to be cash transactions.
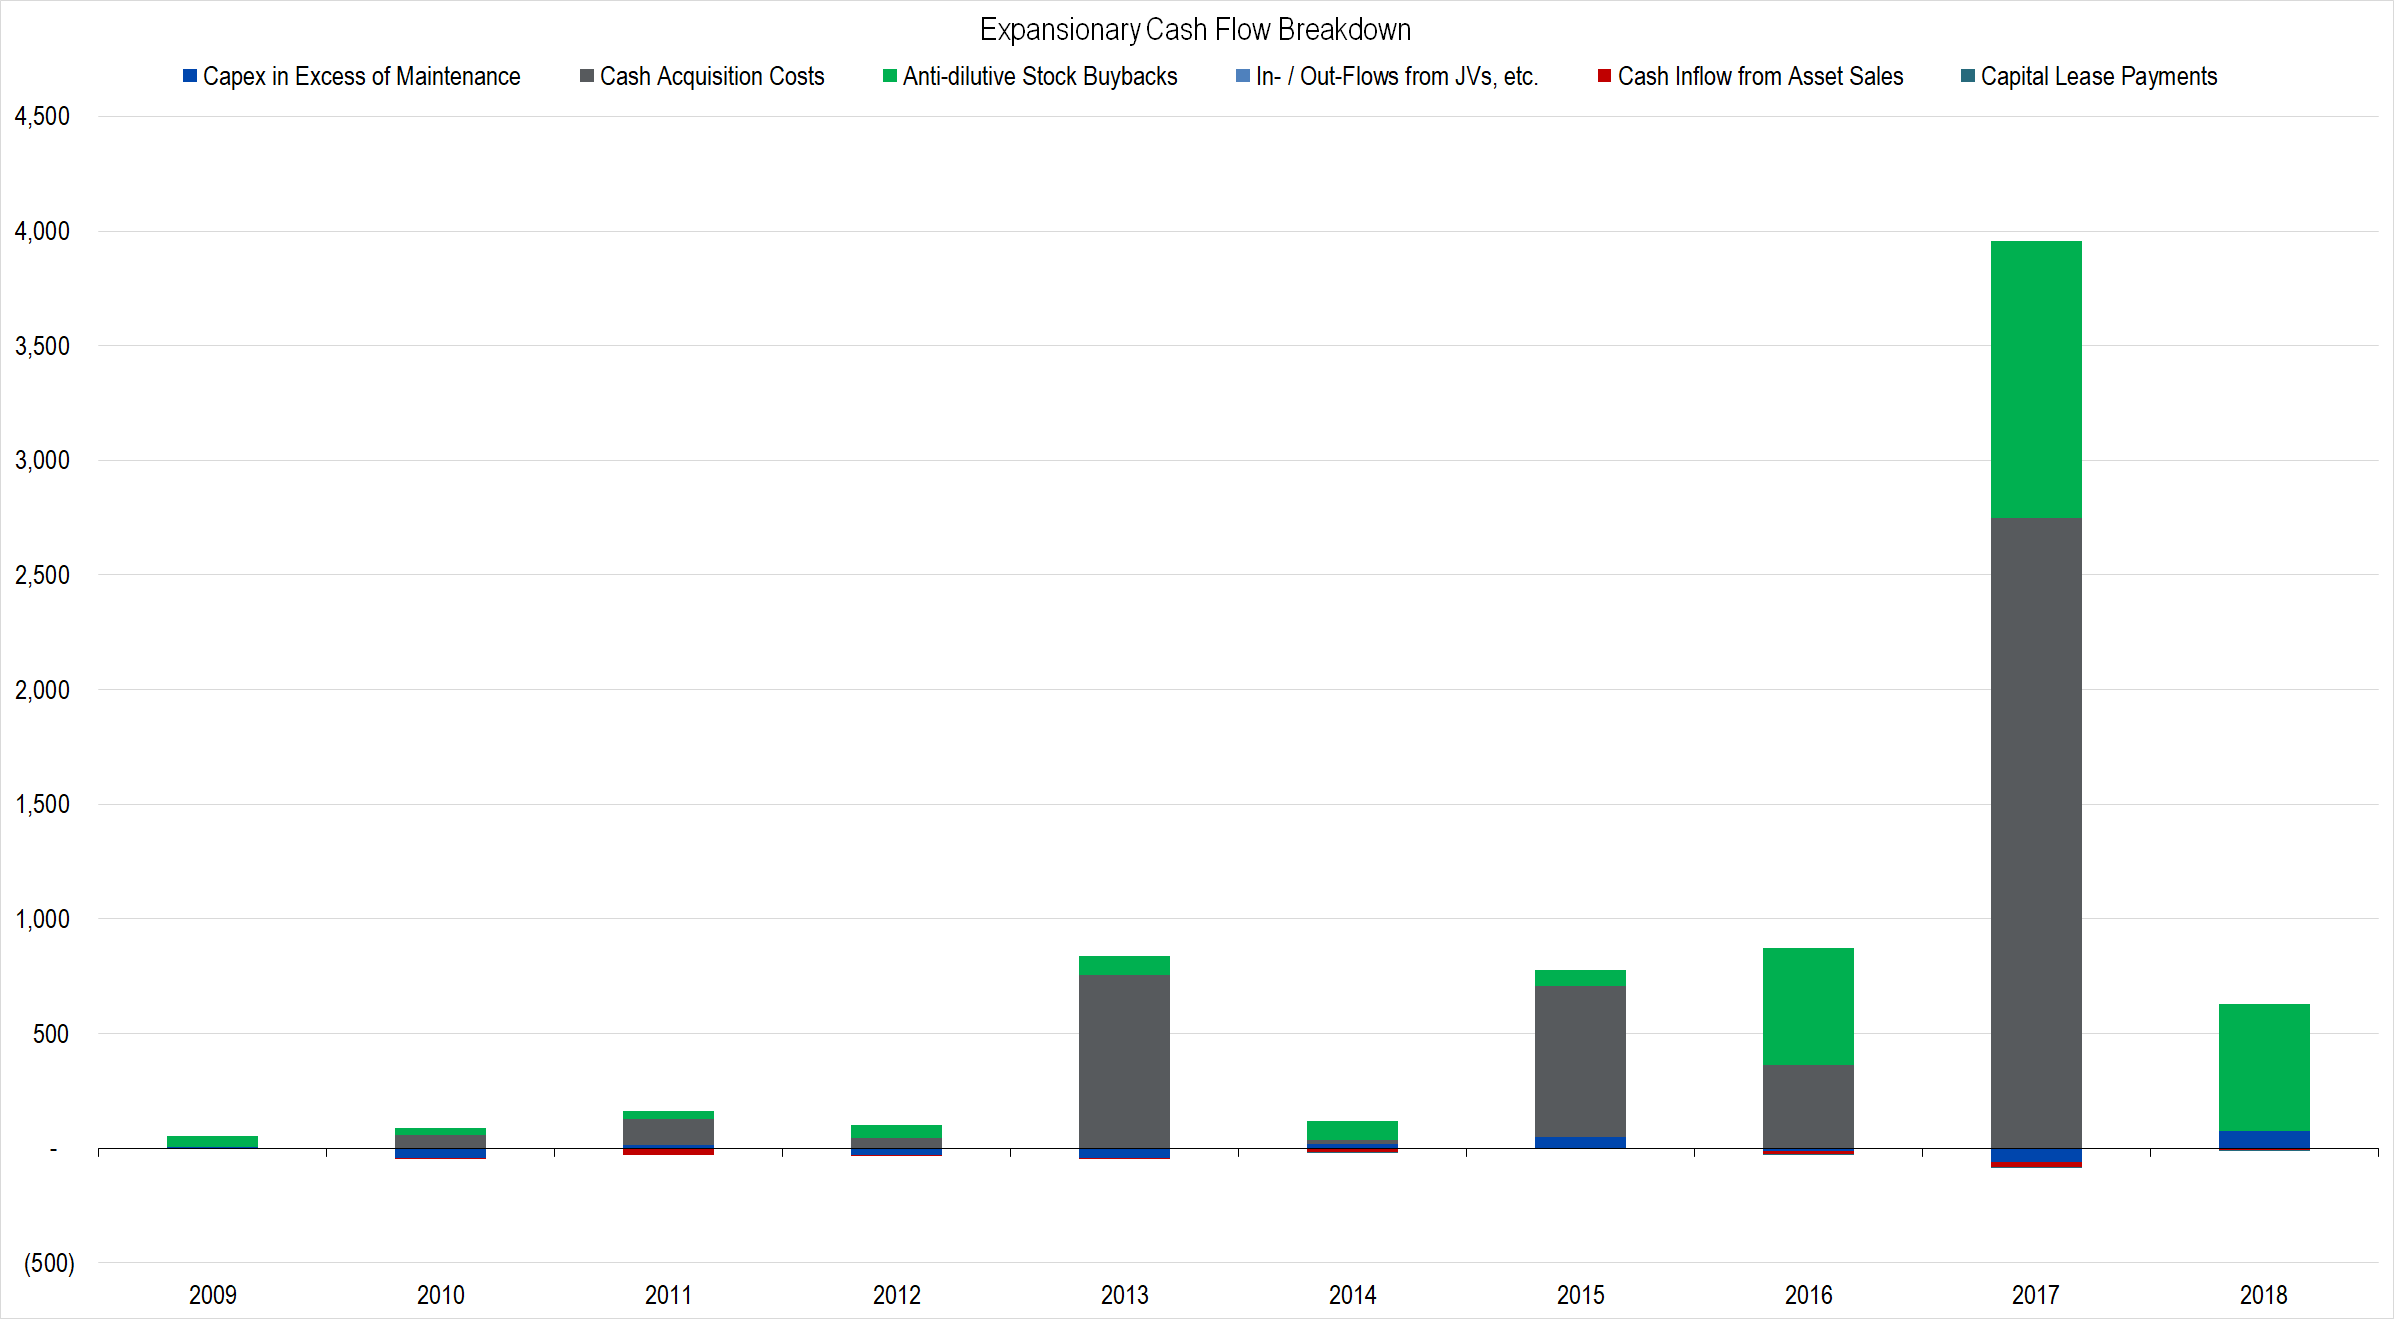
Figure 8. Source: Company Statements, Framework Investing Analysis
You can see the effect of the acquisition-related stock issuance by the height of the green “Anti-dilutive Stock Buybacks” column in the figure above. Fiscal year 2018 also saw the issuance of over 6 million new shares, but the majority of that was related to issuing shares for a convertible bond offering. In a normal year, I would expect Microchip to issue around 2 – 3 million shares each year.
With all its acquisitions, it is a skillful enough operator to increase the profit margins of the acquired firms. As such, its acquisitions have allowed its profits to grow more quickly than its revenues. The average 5-year rolling growth rate of revenues over the past 10-year period has been 17%, compared to a value of 19% for OCP growth. Impressive.
When measured from the fixed starting point of 2009, Microchip’s profit growth looks phenomenal!
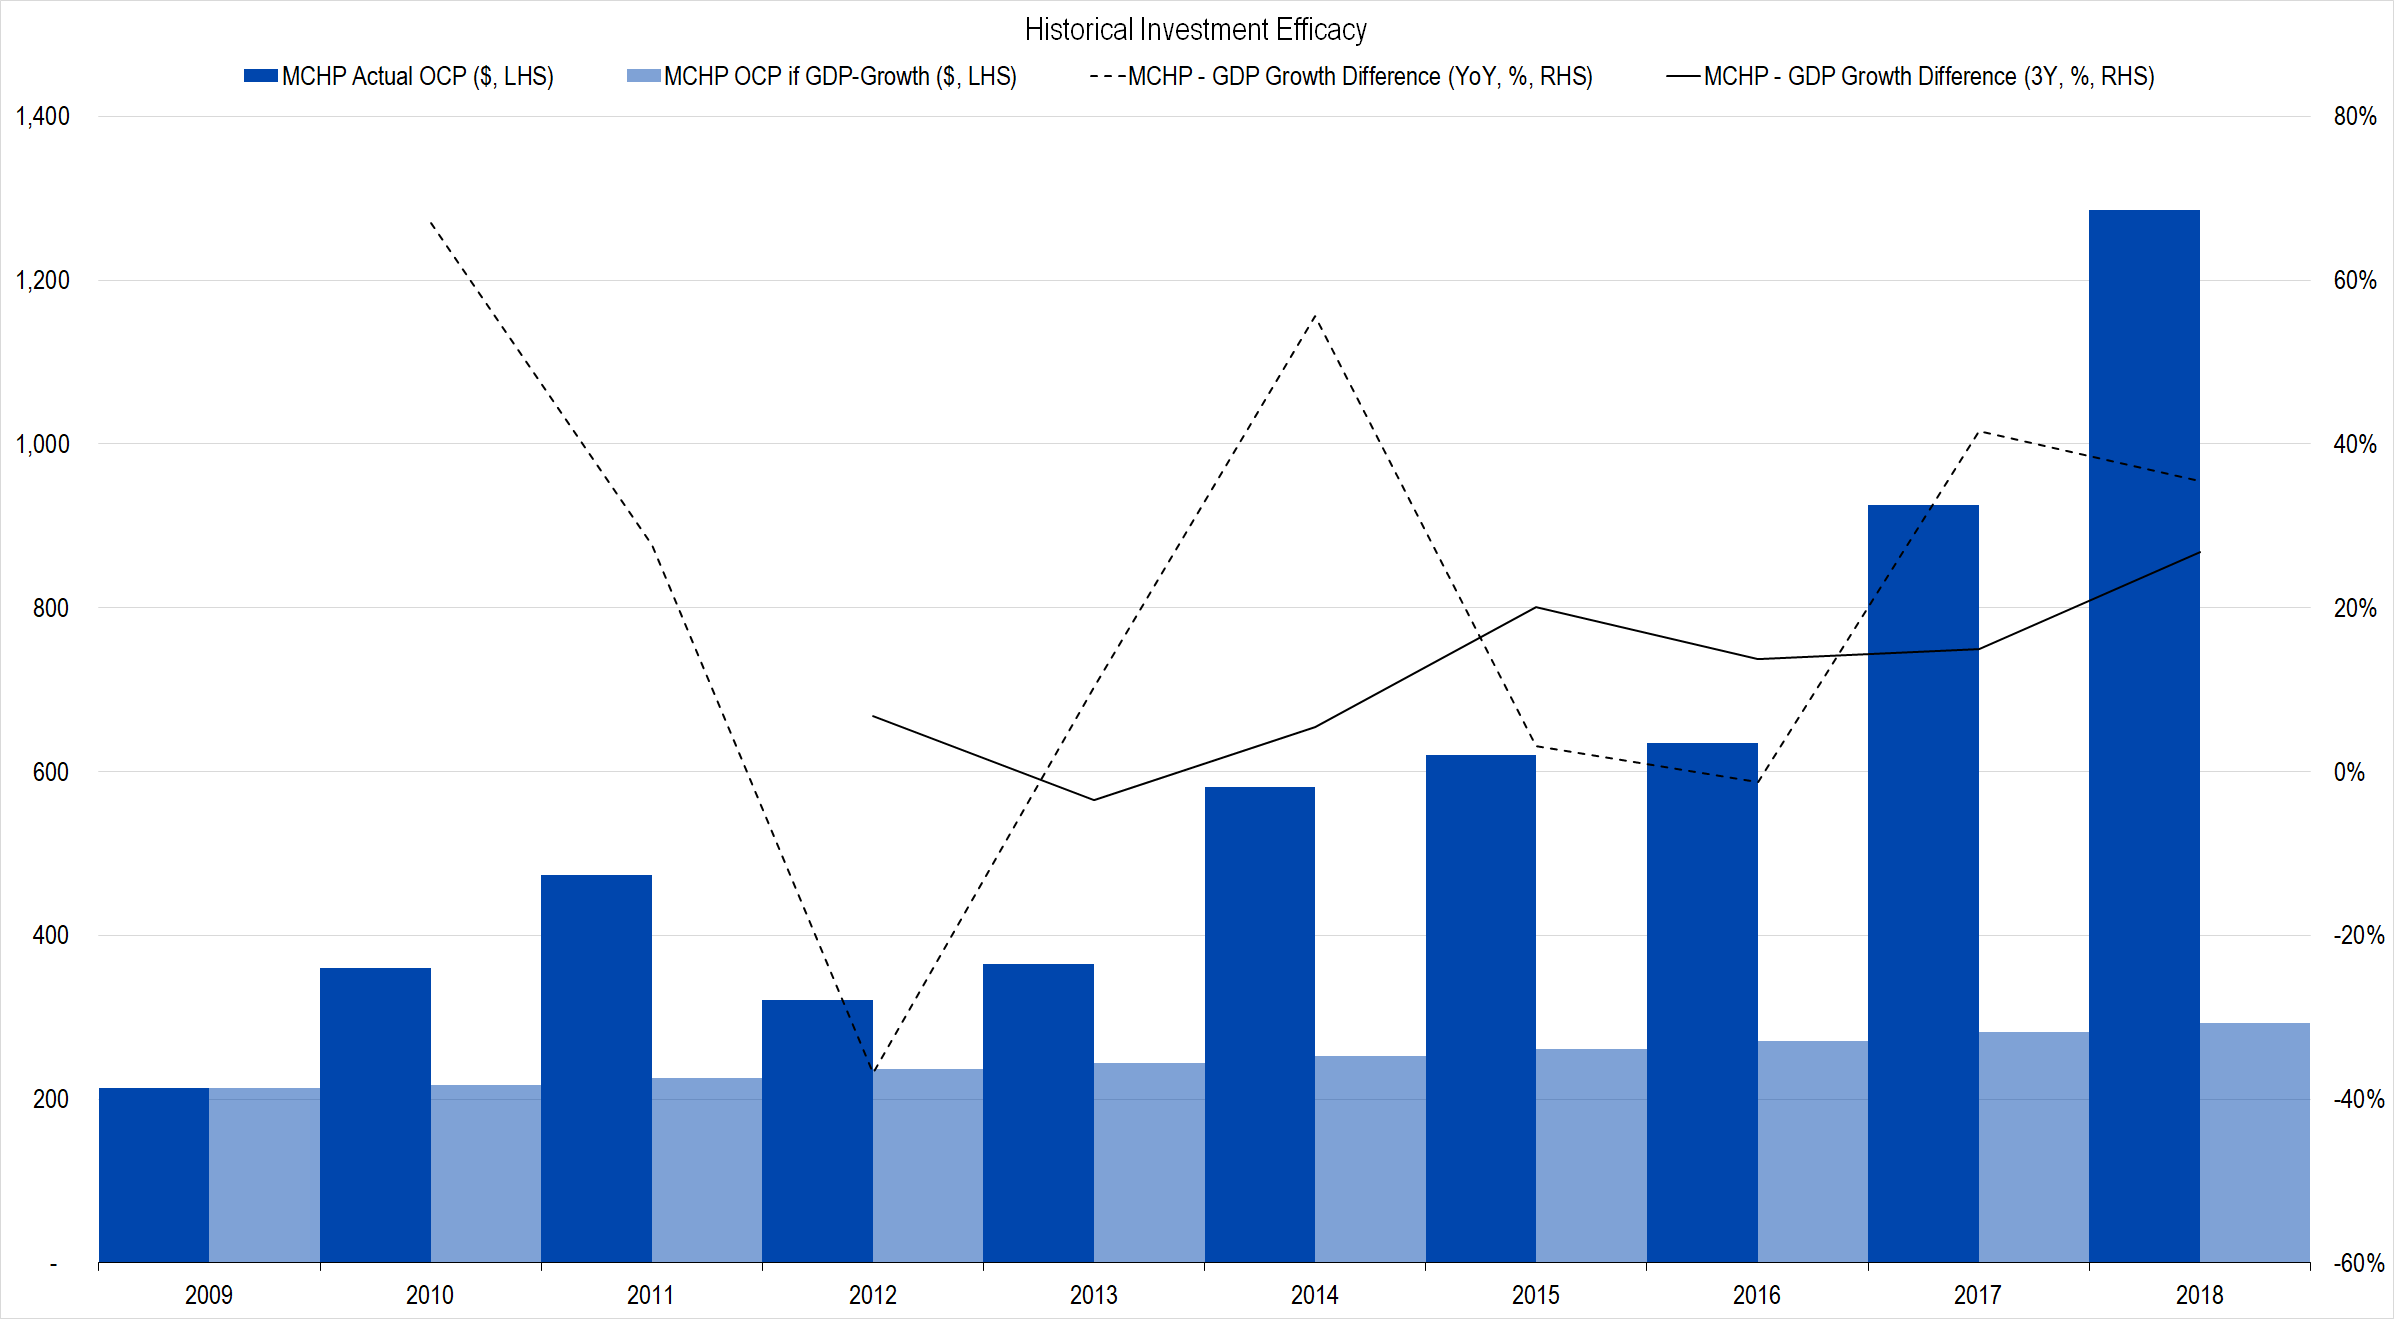
Figure 9. Source: Company Statements, Framework Investing Analysis
Free Cash Flow
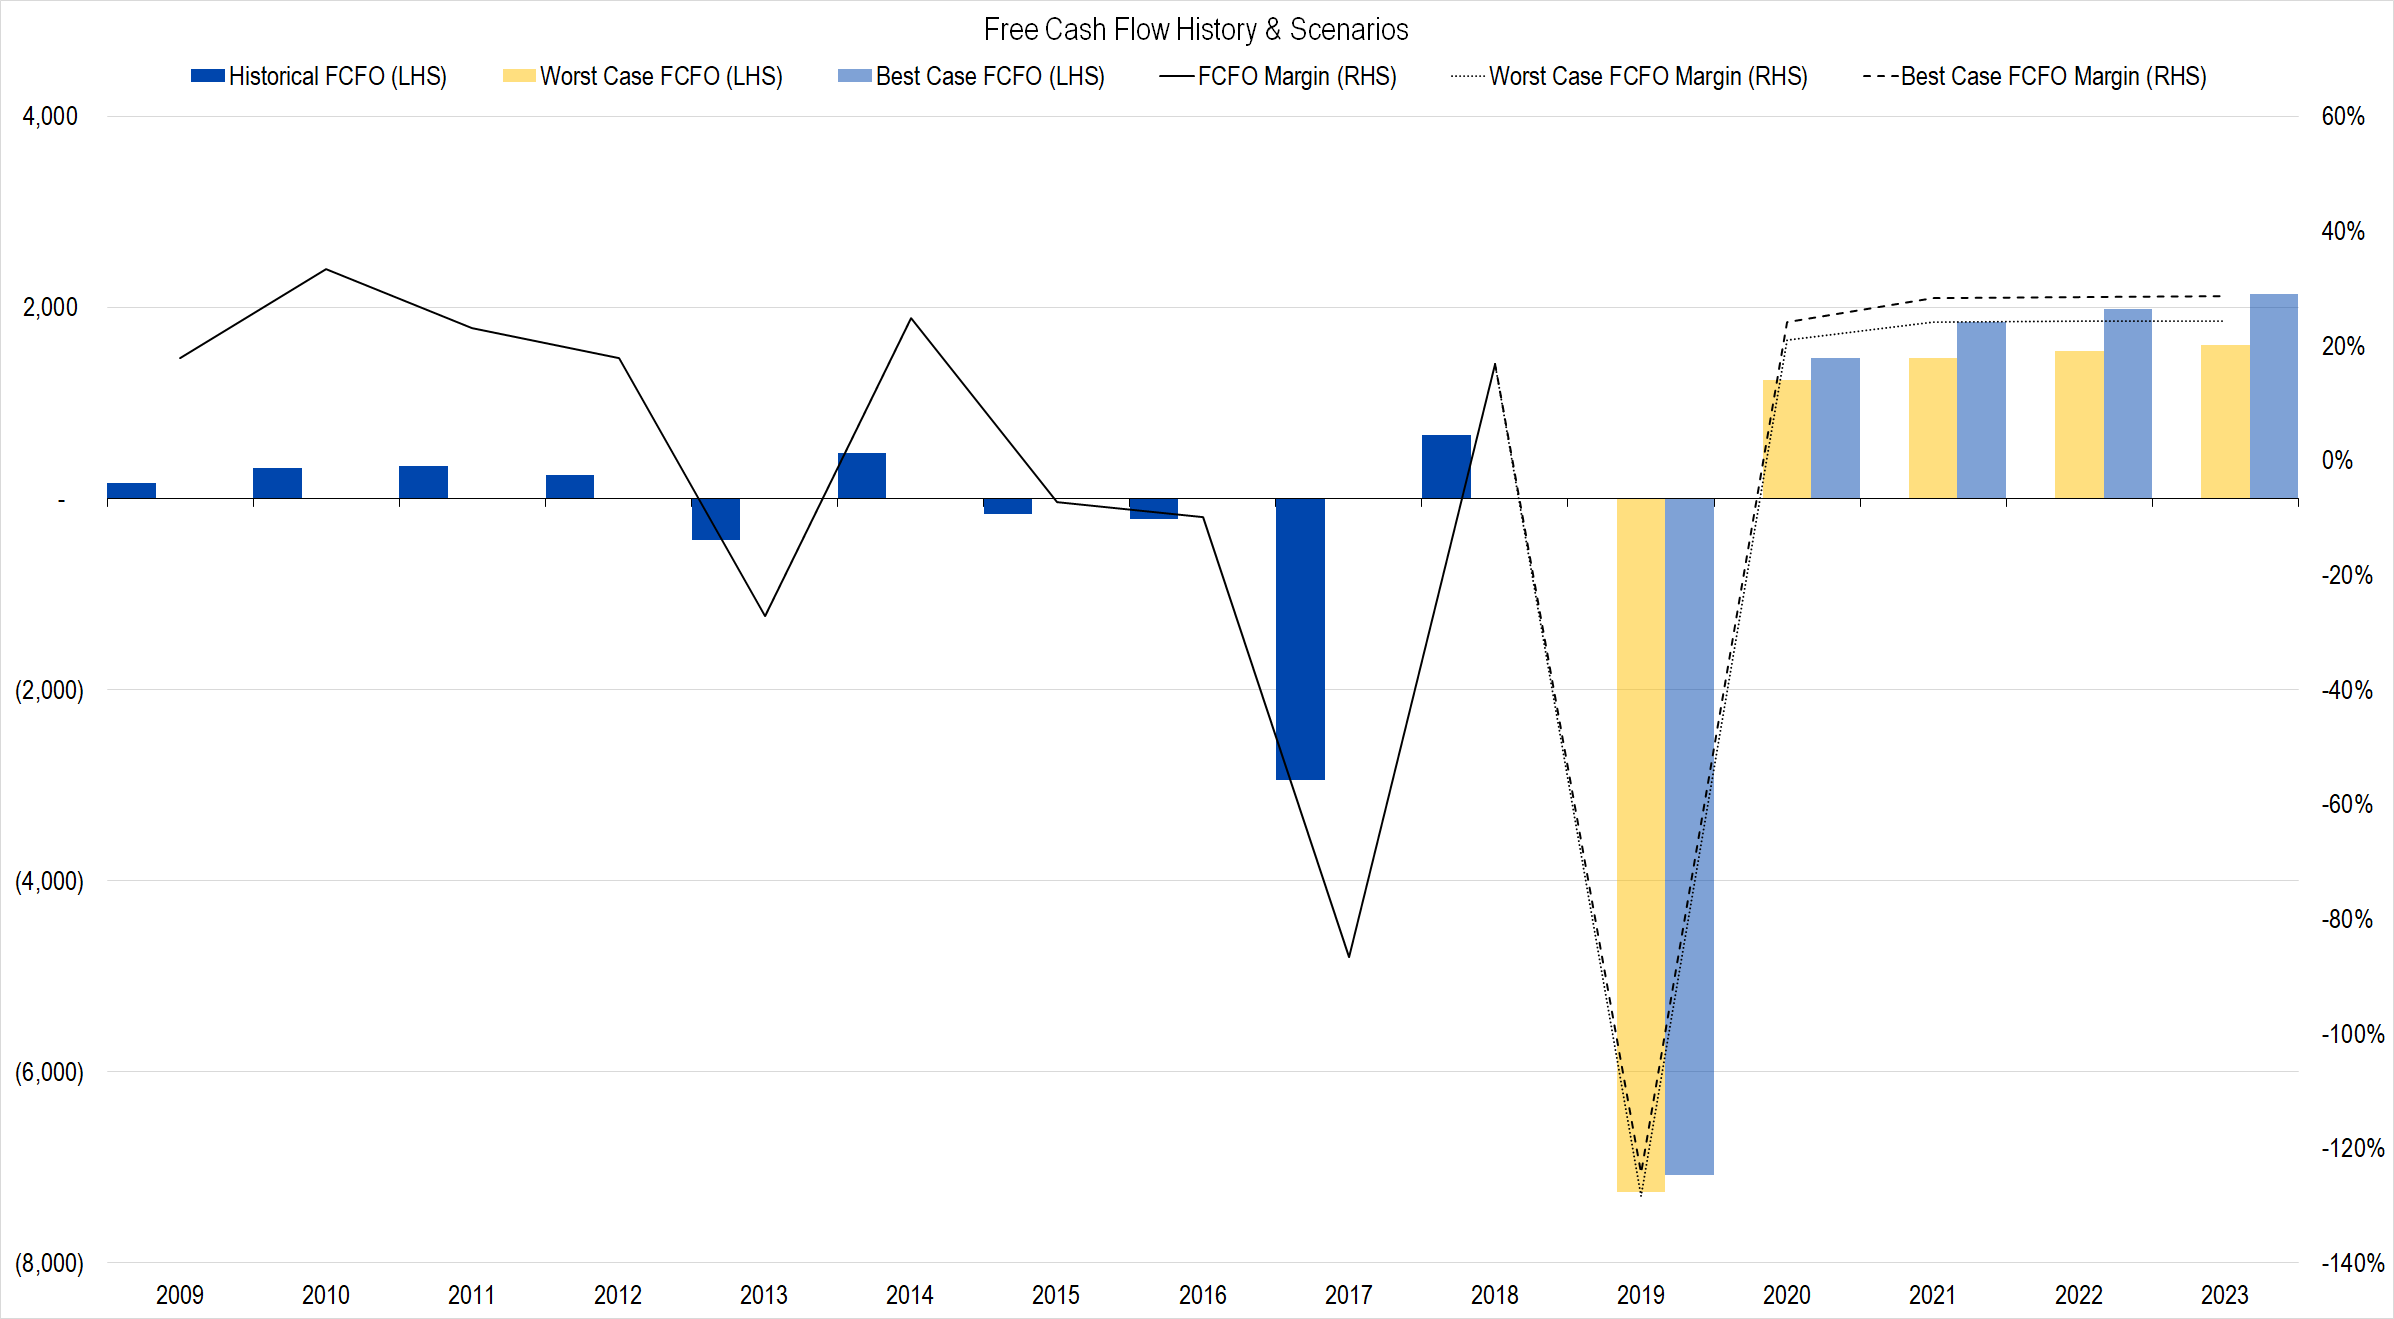
Figure 10. Source: Company Statements, Framework Investing Analysis
Clearly, Microchip’s Free Cash Flow to Owners (FCFO) has been pulled down due to its acquisition activity. According to Bjornholdt, though, the firm will not be making a large acquisition again for several years, due to the added stress to the balance sheet and to company managers brought about by the Microsemi acquisition.
With acquisition activity reduced over the next few years, it seems entirely plausible that the company could make in the mid- to high-$0.20 range of FCFO per dollar of revenues.
Medium-Term Growth
My model assumes a five-year “Investment stage” period starting in Microchip’s fiscal 2024.
Considering the factors that I discussed in the A Closer Look at Microchip article, I believe the company’s medium-term cash flow growth will at least be able to keep pace with the nominal growth of the economy (which I assume to be 5%).
In the best-case, I would expect that number to be closer to 10% average FCFO growth, driven by strong demand for its chips and by cost efficiencies.
Note that these worst- and best-case growth assumptions are lower than the 7% and 12% assumptions I used in my first model. I think that the higher growth rate range is relatively more likely, but am unable to overcome an anchoring bias to the present stock price.
Either my initial forecast was too generous or my present forecast is too pessimistic. Whichever it is, my X-System is likely anchoring to Microchip’s closing stock price.
Valuation

Figure 11. Source: CBOE (data), Framework Investing Analysis
Combining best- and worst-case scenarios for the drivers of revenue growth, profitability, and medium term growth, we find the eight scenarios above. The average of all scenarios is $112 per share, representing a potential gain of 49% over Friday’s closing price.
I will publish a Valuation Waterfall as well as option investment structuring ideas as well in a separate article. Below, please find the updated version of my valuation model.
Framework Integrated Valuation Model – Microchip (MCHP) ![]()
