We have published a great many articles on Caterpillar in addition to creating a Guided Tear Sheet mini-course on the company. One of the problems with publishing materials about a company’s valuation is that one tends to become psychologically anchored to one’s published or expressed view. Anchoring also occurs if one has invested in a security, so for me, who has both published about and invested in Caterpillar, I doubly worry about the effects of my own anchoring bias.

When an investor is anchored to an opinion, they tend to overlook data that is contrary to the opinion or understate its importance. As investors, we should be very conscious of this bias and take pains to control our X-System reactions when making decisions.
Because the Caterpillar investment has worked against the position I proposed and took in January, I have taken some time to approach my valuation of Caterpillar with fresh eyes. My main focus has been on the revenue modeling, since this is the area in which I believe there is the most uncertainty. This article addresses each of the valuation drivers, but focuses on Revenues and Medium-Term Growth the most.
This article assumes that the reader has already digested our ChartBook report on the company.
Revenues
Revenue growth this year has been robust, and there is clearly a lot of market excitement regarding Caterpillar’s prospects, especially as they relate to the improving fortunes of the mining business.
Our model takes a “statistical” view of revenue and cash flow growth at Caterpillar, which means we do not attempt to model the company’s revenues by making predictions about the price of commodities like iron or steel. Clearly, we are in a demand upswing at present, so we wanted to see whether our best-case revenue growth assumptions truly reflected a best-case scenario.
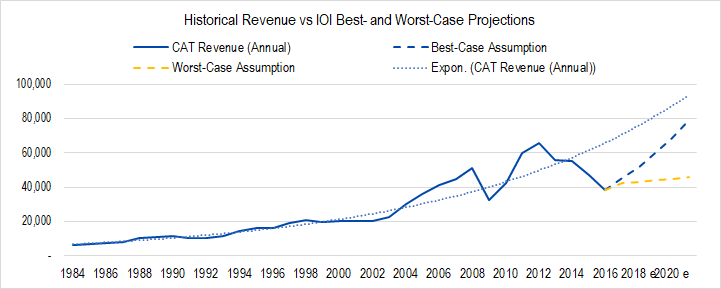
Figure 1. Source: Company Statements, Framework Investing Analysis
The angle of the blue dashed line representing our best-case scenario is clearly steeper than the blue dotted line that represents an exponential trendline of Caterpillar’s historical revenues. This difference satisfied me when I made my original projections, but as I looked at this chart with fresh eyes, I wondered if I had unnecessarily rejected the possibility of a faster revenue growth rate.
The trendline shown in the figure above includes the last five years – years that have seen a monotonic (i.e., one-way) decline in revenues. Clearly, if I measured the long-run growth rate from initiation of this series through the company’s 2012 peak, the growth trend would have been more robust. My best case, should, I thought, be at least be in the ballpark of the trend to 2012.
The compound annual growth rate (CAGR) of Caterpillar’s revenue growth from 1984 through 2012 was a phenomenal 8.6%. The recent fall in revenues has reduced the CAGR for the 1984-2016 series to a still-respectable 5.7%.
In our best-case scenario, the 1984-2021 CAGR is 8.1% – 51 basis points lower than the 1984-2016 historical growth. The first thing to note is that our growth assumption is in the ballpark of the best historical growth rate. Put in context, the absolute difference in final outcomes after five years of growth at 8.6% and 8.1% would only be around 2% (148 versus 151 for a starting value of 100).
The next thing to note is that from an economic perspective, it is hard to imagine a repeat of the very rapid growth in Caterpillar’s sales from the mid-2000s to the 2012 peak. This period was influenced so heavily by the rapid demand for new Chinese infrastructure, and we believe that a boost in demand of that magnitude is unlikely to repeat itself in the next five years. The best candidates for such rapid infrastructure growth are India and Africa, and for various reasons – not the least of which is the degree of centralized economic control and policies – we do not believe such robust growth will occur in either region. China itself is showing good demand again, but there are signs that increasing indebtedness will limit the building boom compared to the one we saw in the last decade.
Our 2017 forecasts are a best-case of $45.1 billion and a worst-case of $42.4 billion. Compared to the company’s 2017 revenue guidance of a range of $42.0 billion to $44.0 billion, our forecasts are in-line and from a half a billion to a billion dollars more optimistic.
Profits
We believe that our model has already given a very generous allowance to Caterpillar’s ability to generate high profits on a consistent basis.
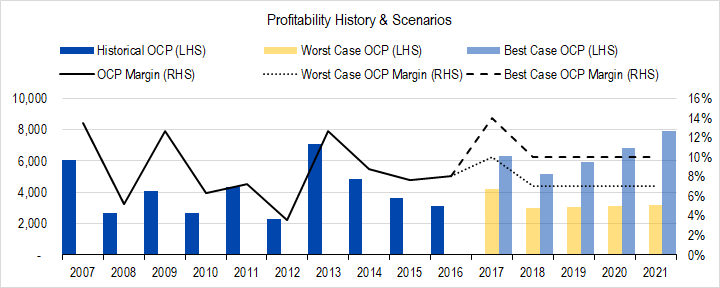
Figure 2. Source: Company Statements, Framework Investing Analysis
Our 2018-2021 profitability assumptions might look low in comparison to prior peaks, but when we look at our assumptions from a five-year average perspective, it is easy to see the generosity of our forecast assumptions.
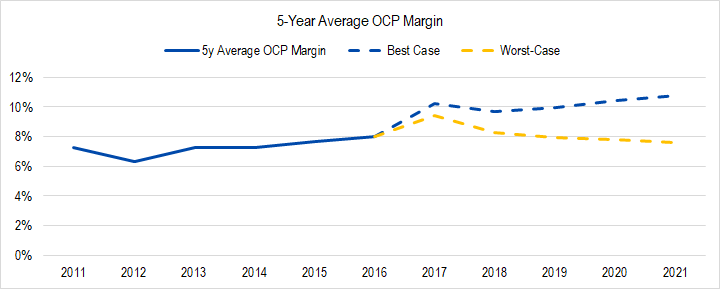
Figure 3. Source: Company Statements, Framework Investing Analysis
In essence, we are saying that, in the worst-case, Caterpillar will be able to generate higher profits than in any prior five-year period except for 2016. Our best-case forecast is off the charts optimistic, with the firm generating more than 20% better cash-based profits than during any prior five year period.
It’s worth noting that because of Caterpillar management’s acumen and foresight, extended periods of low revenue growth (or revenue decline) are usually associated with higher profitability and vice versa. As such, if we assume the best revenue case, it is more likely that the firm will generate closer to our worst-case profitability forecasts. The valuation scenario associated with this combination of factors is in the high-$70 per share region, around a third lower than the present price.
(See also our comments below on Medium-Term Growth.)
Investment Level
As we mentioned in our 2Q17 earnings summary, Caterpillar has been underspending on investments this year, compared to historical trends. Investment spending is, from the managers’ point of view, discretionary, and values tend to be lumpy. As such, we do not have any reason to believe that our investment spending assumptions are unreasonably high (which would push down Free Cash Flow to Owners). On the contrary, our investment spending assumptions for the next five years are low, as discussed in the above-referenced ChartBook.
Medium-Term Growth
One of the most notable things about Caterpillar’s long-term profits is its stair-step pattern, which we pointed out in the January ChartBook.
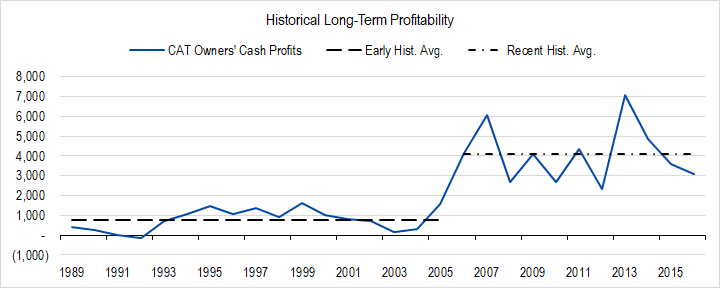
Figure 4. Source: Company Statements, Framework Investing Analysis
The stair-step upward obviously corresponds to the Chinese infrastructure boom-driven demand for mining equipment. Our long-term profitability scenarios assume another stair-step upward over the next 10 years in the best-case, and at least the company’s ability to maintain average profits in the worst-case.
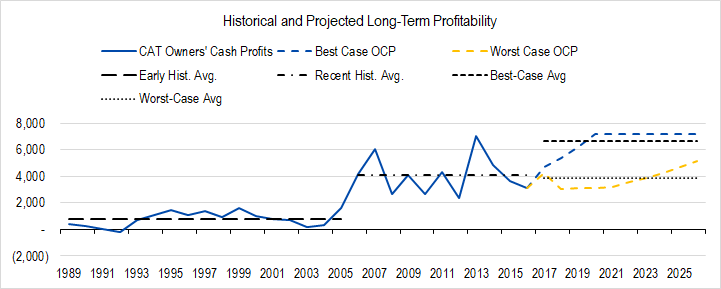
Figure 5. Source: Company Statements, Framework Investing Analysis
With several large acquisitions within the past few years we think Caterpillar will reduce spending in the short-term, gradually getting back to a spending pattern more in-line with its historical averages. Building these assumptions into our model, we get the following:
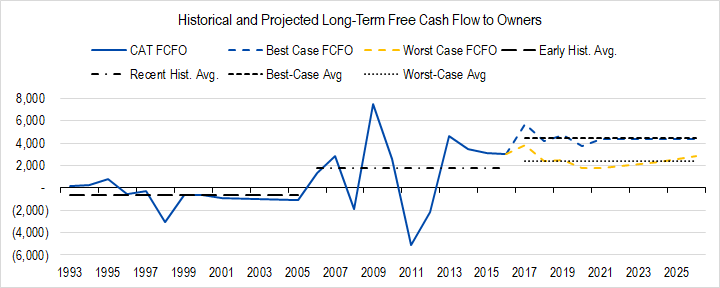
Figure 6. Source: Company Statements, Framework Investing Analysis. Note that we have removed data for the years 2002-2004 due to a business and accounting change that created artifacts in the data that we thought were unreliable.
We have looked at our assumptions for medium-term cash flow growth using the same methods we did to analyze long-term revenue growth. Because Caterpillar’s profitability and capital expenditure requirements tend to be so stable over time, we looked back to our revenue growth assumptions and assumed that any increase in FCFO was due to revenue increases. We were mainly interested in testing our assumption that one five-year period of excess growth would not be followed by another five-year period of excess growth.
Our present valuation scenarios assume rapid growth in the near term is likely to be followed by tepid growth in the medium-term and that tepid growth in the medium-term is likely to be followed by rapid growth in the medium-term.
When we tested scenarios of a full 10-year period of rapid growth, we saw that in this case, our model generated growth that would have been as strong as that during the Chinese infrastructure boom, but three years longer in duration. Due to reasons we discussed in the revenue growth section above, we believe that such scenarios are very unlikely to happen. In contrast, the fast-slow and slow-fast scenarios look reasonable considering historical patterns. Happy that our model is a realistic representation of likely future best- and worst-case outcomes, we were able to discard all of the valuation scenarios that implied either best-best or worst-worst growth. (See below for examples.)
Valuation
While we have no better sense of which of our valuation scenarios is more likely – we have no more ability to predict demand for industrial commodities than anyone else and even “expert” claims of ability are dubious – we do believe that actual future results will be within the range of our operational forecasts. These forecasts generate the valuation range shown below.
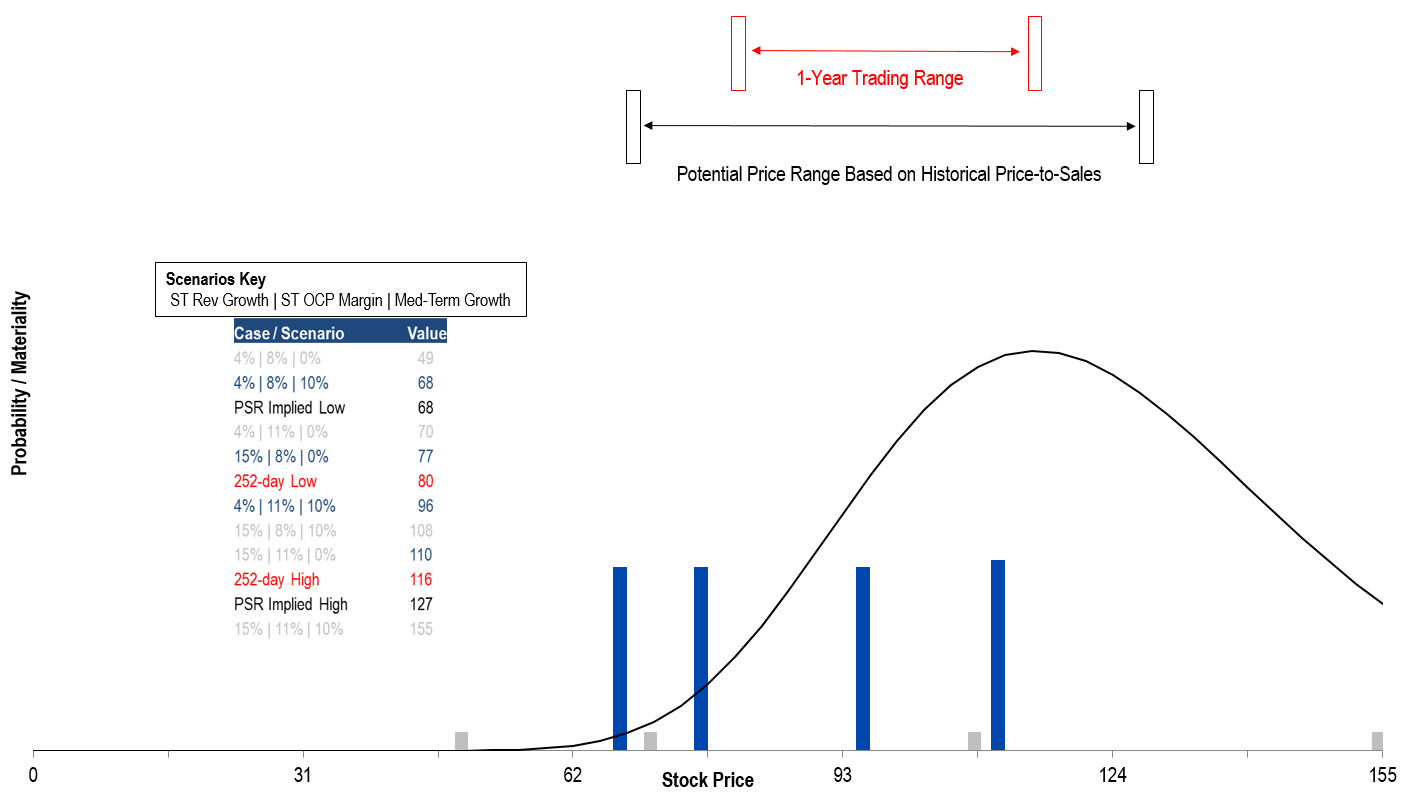
Figure 7. Source: CBOE, Framework Investing Analysis. For more information about this “Complex Valuation Diagram,” please see this lesson in our Valuation Launchpad.
As mentioned in the discussion of medium-term growth above, we do not believe the firm will experience slow near-term growth (4% average revenue growth per year) coupled with slow medium-term growth (0% average FCFO growth per year) or fast near-term growth (15% average revenue growth per year) coupled with fast medium-term growth (10% FCFO growth per year), so have grayed out those scenarios.
This leaves us with four valuation scenarios: $68, $77, $96, and $110 per share. If we had to guess, we would say the fair value lies somewhere between $77 and $96 per share – mid-$80 range.
Because the present stock price is above our highest valuation scenario, we assign this a “high” conviction rating.
Cautionary Note on Human Vanity
No one in the market cares what this or any valuation model calculates as a fair value for Caterpillar or any other company. When Buffett announces that he has made a new investment, the stock in which he invested usually sees a nice initial pop, but as investors in IBM know, this pop can be only temporary.
In the short-term, stock prices fluctuate randomly, pushed about by the competing emotions of fear and greed that are constant companions to market participants. Long-term, we have good reason to believe that the market must weigh the cash flows likely to be generated by the firm. Rosy expectations for future growth suddenly moderate; gloominess about present business conditions suddenly clear.
Our rating of “high conviction” for this stock and for any other is based on our assessment of the value of the firm over long periods. Over the short-term, we have no idea whether an investment will be a “winner” or a “loser.” Be very suspicious of anyone who claims to have such an idea!
We will be posting another report regarding the In-the-Money bearish put option we featured earlier in the year and which has been making us cry and gnash our teeth all summer.