After posting my last article on Union Pacific, in which I characterized the firm as a monopolist, I got pages of angry comments from readers (mostly investors who have taken bullish positions in Union Pacific, rather than the bearish position that I hold) informing me of how little I understood about the railroad business.
One recurrent complaint about my article was that, in some reader’s minds, I had failed to appreciate the fact that Union Pacific – like all railroads – must invest money in their own rails, terminals and other essential infrastructure.
The sky-high profits that I offered as evidence of Union Pacific’s excessive profitability (profitability in line with software companies like Microsoft and Oracle as I point out in this video) were misleading – in my critics’ view – because much of those profits had to be paid out to maintain and improve the railroads’ critical infrastructure. This argument interested me, and I went back into my model to see where the excess profits Union Pacific generated were going.
Because I use a cash-based measurement of profit that takes the expense required to maintain a business as a going concern (I named this measure Owners’ Cash Profits in my book – it is similar to Buffett’s measure called “Shareholder Earnings”), I knew that the excess profits I had measured were “real,” but wondered how those profits were being spent. Were they, as my critics supposed, being plowed back into the business to improve efficiency?
I found, in fact, that the contention that Union Pacific’s excess profits were needed to support the business was emphatically not the case.

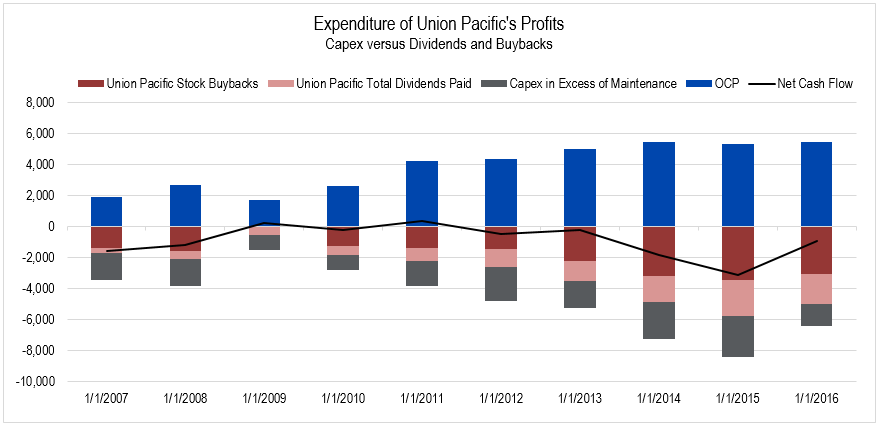
Figure 1. Source: Company Statements, Framework Investing analysis
In the figure above, the company’s Owners’ Cash Profits (OCP) are shown as blue columns. As I mentioned above, these profits already reflect a deduction of capital expenditures required to maintain Union Pacific as a going concern. You can see that, over the last three years, Union Pacific’s OCP have been just shy of $6 billion.
The three layers below the horizontal axis represent expenditures – the gray is for capital expenditures (“capex”) in excess of those already deducted; maroon shows cash spent on buybacks; salmon represents cash distributed as dividends.
Finally, the black line represents the net cash flow – in years where profits exceed these three classes of expenditures, the line is positive.
There are two things to note about this diagram which are vital for owners of Union Pacific to understand.
First, note that the amount spent on dividends and stock buybacks far exceed the amount spent on capital expenditures – 74% higher on average, in fact. This single observation clearly refutes my critics’ argument that the company does not generate excess profits, but only what is needed to maintain its competitive position. If this were the case, the company would presumably be spending much more on capital expenditures rather than buybacks!
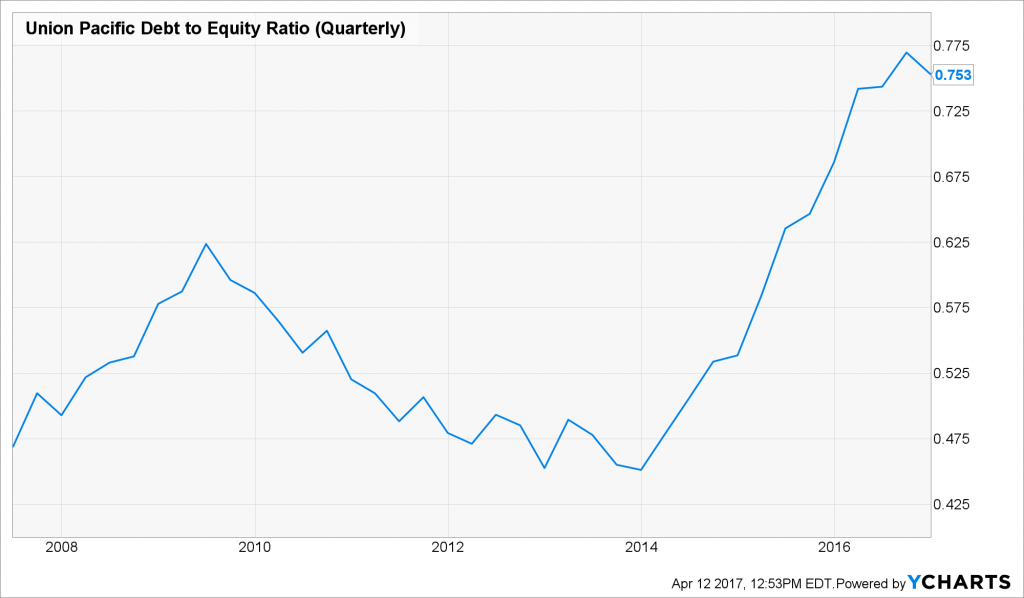
The second point is even more critical for owners to understand. Namely, note that the net cash flow line has consistently shown a negative value for the last five years. The only way that a company can consistently spend more than the profit it is generating is by issuing debt. Indeed, we see that Union Pacific’s debt-to-equity ratio has ballooned over the last 10 years.

Figure 2. Source: YCharts
In essence, Union Pacific has been borrowing from Peter to pay Paul – issuing debt to buy back its own shares and keep the dividend payments flowing.
If you are an owner of Union Pacific, this might seem like a very good thing for the company’s management to do – you are getting a nice, fat dividend check and your ownership stake is becoming more and more concentrated due to the buybacks.
While this view is understandable in the short-term, I would argue that it is a myopic one longer-term, and has the potential to cause owners a lot of pain in the future.
Union Pacific’s increased debt load weakens its balance sheet and raises the fixed-cost hurdle the company must jump over each quarter. This fixed-cost hurdle is the cost of debt servicing termed “financial leverage.”
Union Pacific’s business has been strong over the last ten years, but if the United States hits an economic rough patch or if, as I’ve suggested, President Trump’s trade policies cause a slowdown in the international trade that forms the lion’s share of Union Pacific’s business, the financial leverage hurdle will be harder for the company to clear.
Also, it’s worth adding that owners should be suspicious of companies that are engaging in large buyback programs (as I point out in this video). In Union Pacific’s case, the company spent the most money on buybacks in 2014-2015 – the two years which saw the highest average price for the company’s stock in its history. Numerous academic studies have shown that companies buying back their own stock tend to use the “Buy High, Sell Low” strategy, which is not one associated with investing acumen!
In addition, stock buyback programs often serve to hide cushy executive compensation packages. The company is issuing execs stock as compensation, then using profits that would have otherwise flowed through to owners to buy that stock back. We estimate that in 2014-2015 alone, the company spent $450 million buying back stock it had issued to its executives. While $450 million might not seem like a lot to rich guys like us, it does add up eventually.
Is Union Pacific a monopolist extracting economic rents from society? My answer is still yes. Is it increasing its financial leverage in a way that will be dangerous if the economy stalls? An intelligent investor would have to answer “yes.”
This article originally appeared on Forbes.com

