
Union Pacific announced fourth quarter earnings last week, and full-year 2017 operational metrics came in well within the range of operational measures we published in June 2017.
This article reviews the firm’s earnings announcement and compares actual results to our valuation driver forecasts. After a tough year with our bearish investment in Union Pacific in 2017, we have not been enthusiastic about reinitiating a position. After reviewing our model and confirming that our views on the effects of the tax change on Union Pacific were as we expected, we may publish a new Framework Tear Sheet on Union Pacific in the next week and reinitiate our bearish position.
Revenues
Union Pacific generated $21.2 billion of revenues in 2017, 6.5% higher than the $19.9 billion of revenues generated in 2016.
Volumes in 2017 were up only slightly in the fourth quarter, and carloadings for the year were middling — better than 2016’s nadir, but still low. The standout freight type remains Industrial Products – due to the transport of Frac sand to the Permian and Eagle Ford basins, as discussed in a prior article.
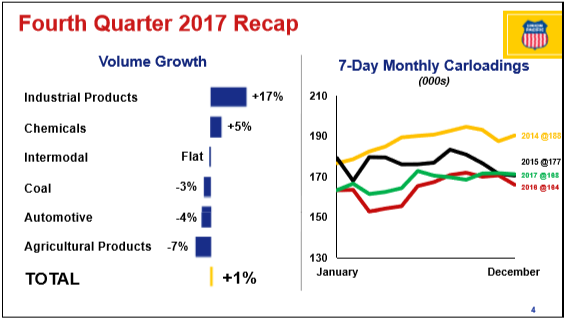
Figure 1. Source: Union Pacific Investor Relations presentation
The rise in oil prices at the end of the year prompted a flurry of fracking activity, and Industrial Products revenue increased by 28% in the fourth quarter of 2017, compared to the equivalent time period in 2016. For the full year, freight revenues (including a boost from the fuel price surcharge due to rising energy prices) were up 7%, and a big driver of this was the 22% rise in Industrial Products revenues.
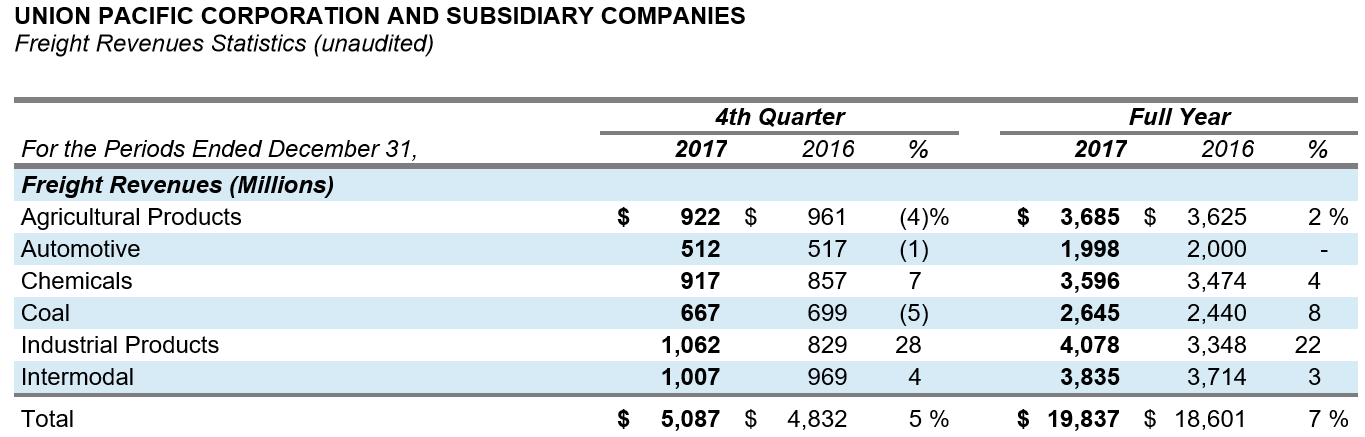
Figure 2. Source: Union Pacific Investor Relations presentation
According to the firm, the effect of increasing fuel prices that it passes through to its clients in the form of fuel surcharges, was the single largest factor in the 4Q revenue increase of 5%.
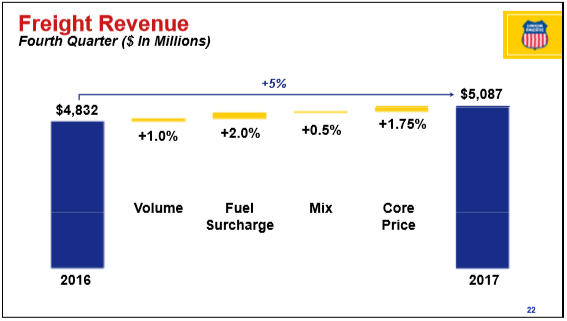
Figure 3. Source: Union Pacific Investor Relations presentation
This revenue walk diagram was not available for the full year, but we suspect the picture is much the same. Strong demand for frac sand is likely driving pricing increases, though pricing in Chemicals is also likely good.
We have been updating our expectations and our own model throughout the year, so we decided to take a look back to an early model and compare full-year results to our early revenue forecasts.
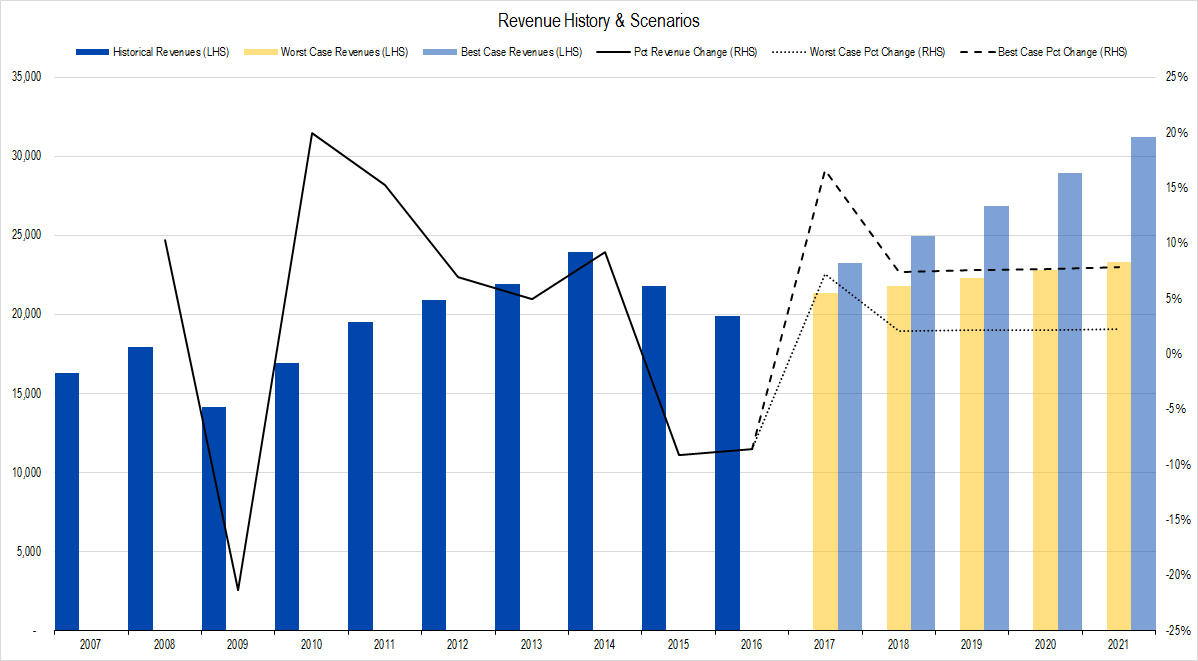
Figure 4. Source: Company Statements, Framework Investing Analysis
The revenue forecasts above are from the model we created after the firm’s 2Q17 earnings announcement. Our worst-case revenue forecast for 2017 was $21.4 billion, slightly better than the firm’s actual value of $21.2 billion. The firm’s revenue run-rate at the end of 3Q17 implied full-year earnings of $21.1 billion, so the firm did generate some revenue momentum in the fourth quarter.
Profits
Union Pacific does not provide a full Statement of Cash Flows with its earnings announcement, but rather an overview. As such, our estimates of the company’s Owners’ Cash Profits (OCP) are approximate until the 10-K (annual financial statement) is released.
The company reported $7.2 billion in Cash Flow from Operations during 2017. We estimate that the firm probably paid on the order of $2.4 billion in maintenance capital expenditures, implying OCP of $4.8 billion and an OCP margin of 22.7%. Our most recent model — the only one that is comparable because of our reassessment of the firm’s maintenance capex levels — forecast worst-case OCP margins at 23% and best case at 25%, so again, the firm’s actual profitability looks about the same or slightly worse than our worst-case assumptions.
One interesting point to note is that despite 2017 EPS being roughly triple that of 2016 due to changes in the tax law, cash flow and OCP were both lower.
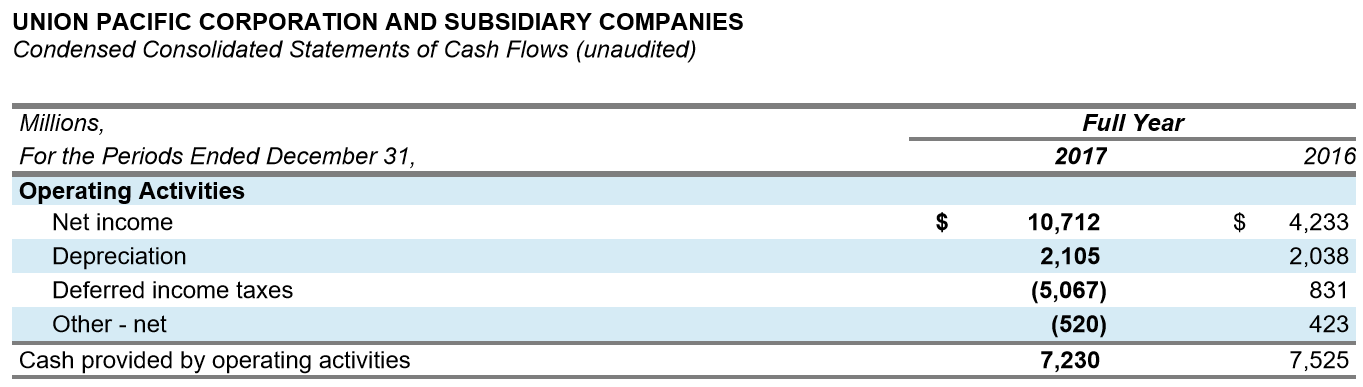
Figure 5. Source: Company Statements
The boost to earnings came from a non-cash charge discussed in the tax-related article linked above, so owners saw no pick-up in cash from the rule change.
Investments
No company provides enough disclosure in its earnings announcement to accurately calculate Framework’s measure of investment spending: Net Expansionary Cash Flow. From the disclosure UNP does offer, we think total Net ECF came in at around $900 million for the first half of the year – 19% of estimated OCP.
Our estimate of investment spending as a percentage of profit was higher than this when we published our original model a year ago. Part of the discrepancy was simply a classification issue, but it became obvious to us that the firm was pulling back hard on investment spending, and we spent the year pulling down our estimates.
Our most recent model assumed the company would spend 15% of its profits on investment spending, increasing to a base level of 25% for the last three years of our five-year near-term forecast.
The model we mentioned earlier in this article forecast Free Cash Flow to Owners (FCFO) ranging from $3.4 billion to $4.4 billion during 2017. We estimate that the actual FCFO generated by the firm was $3.9 billion — exactly at the midpoint of our forecasted range.
Valuation
After a hard year with this position, I am worried that I’m missing something somewhere in my valuation. No matter how many times I look at the numbers, though, the best-case valuation cases just look so improbable as to verge on impossible.
I’ll sit down over a very hot cup of tea (for all you Douglas Adams fans out there) and come to peace with my assumptions. Expect a revised valuation and new investment strategy soon.