
Union Pacific announced third quarter earnings this morning and again we find the company’s actual results tracking very closely to our worst-case operational forecasts. While the stock price is moving against our bearish investment in the company this morning, we are confident in our valuation of Union Pacific, and continue to consider the company significantly overvalued.
This article reviews the firm’s earnings announcement and compares actual results to our valuation driver forecasts.
Revenues
Union Pacific generated $5.4 billion of revenues this quarter and $15.8 billion in the first nine months of the year. Compared to last year’s nine-month cumulative revenues of $14.8 billion, Union Pacific’s revenues have increased by 6.9%.
Volumes were down overall, and down in all but one freight type – Industrial.
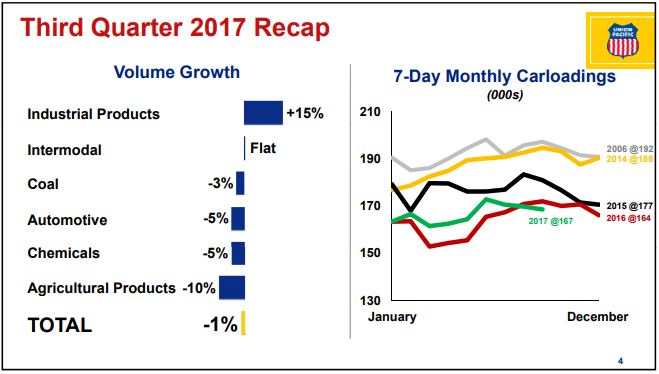
Figure 1. Source: Union Pacific Investor Relations presentation
The Industrial freight type had the largest share of revenues for the first nine months of the year thanks to a 20% increase in sales year-over-year, and represented just over one-fifth of sales for the firm. This rapid increase is largely due, as it was in the second quarter, to increased shipments of frac sand. To put Industrial’s freight revenue growth in historical perspective, see the figure below.
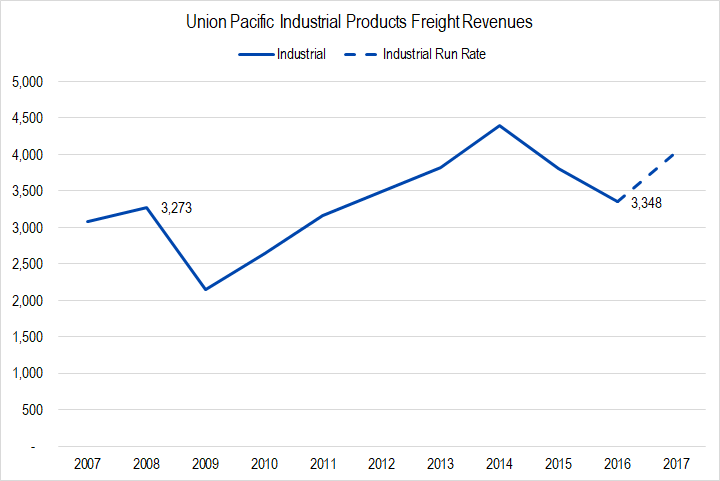
Figure 2. Source: Company Statements, Framework Investing Analysis. The 2017 run rate is calculated as the 9-month revenue total divided by 0.75.
The company also reported a pick-up in military transport and waste volume.
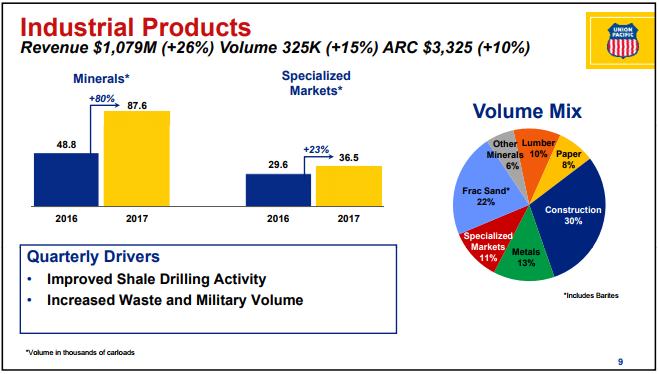
Figure 3. Source: Union Pacific Investor Relations presentation
Despite the drop in volumes in most freight types, the fact that revenues increased demonstrates that the firm retains pricing power. This contrasts to information we received from an industry survey and detailed in our video Rail Pricing is Changing. We will keep watching this metric, and after full-year results are in, will take a look at how the price is changing after the effects of the fuel surcharge are stripped out.
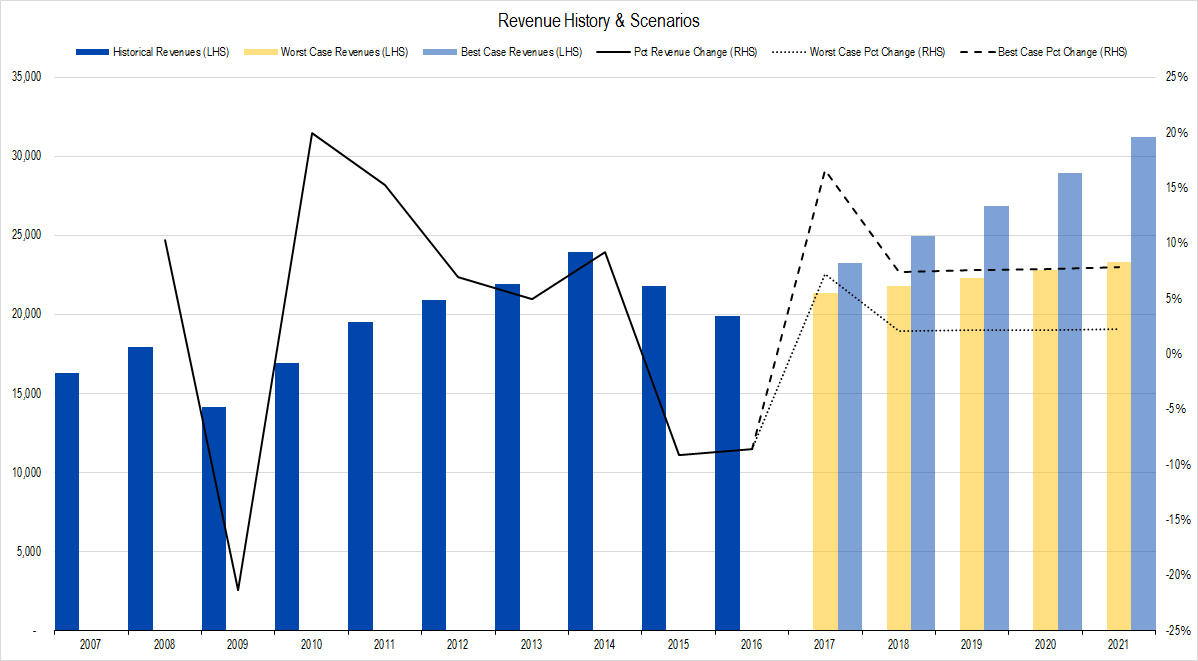
Figure 4. Source: Company Statements, Framework Investing Analysis
Our worst-case revenue growth assumption for 2017 is for an expansion of 7.2%, implying total revenues of $21.4 billion this year. Our best case assumption is for a revenue boost of 16.6%, implying total revenues of $23.2 billion for the year. An simple extrapolation of full-year revenues given the three quarters already recorded yields a value of $21.1 billion. Clearly, actual results look like they will come in much closer to our worst-case scenario than to our best-case one.
Profits
Union Pacific does not provide a full Statement of Cash Flows with its earnings announcement, but rather an overview. As such, our estimates of the company’s Owners’ Cash Profits (OCP) are approximate until the 10-Q (quarterly financial statement) is released.
The company reported $5.3 billion in Cash Flow from Operations in the first nine months of 2017. It reported a Depreciation expense of $1.6 billion this half; these figures imply OCP of $3.8 billion and an OCP margin of 24.0%. This figure is just 100 basis points higher than our worst-case profitability forecast and a full 300 basis points worse than our best-case one.
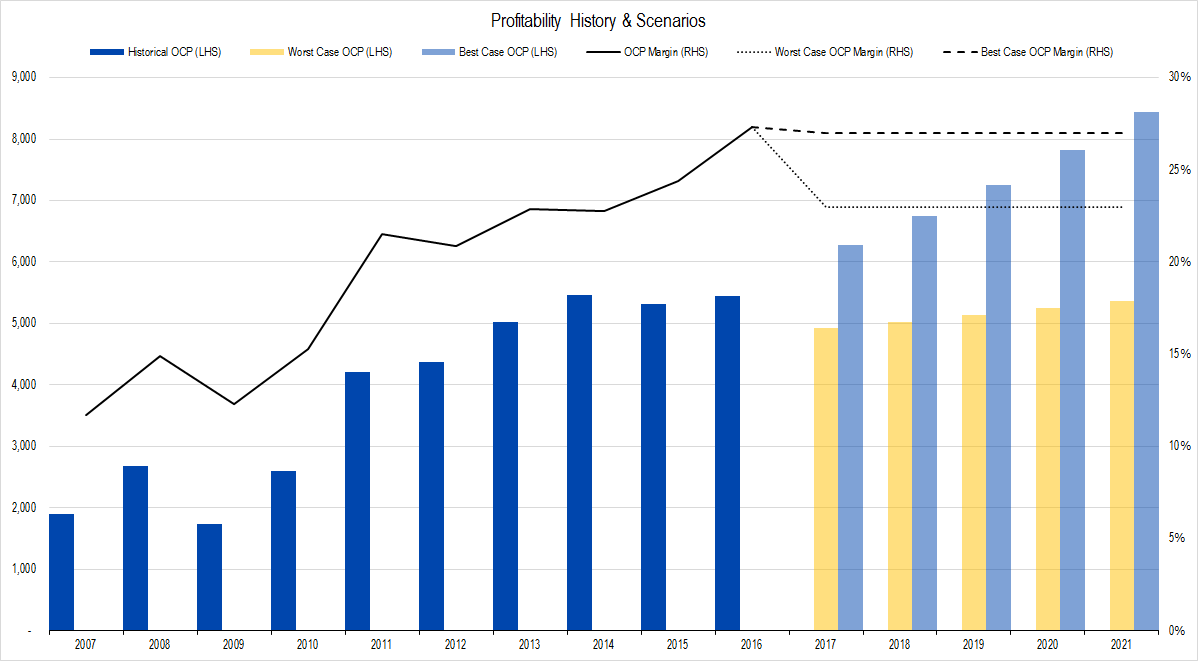
Figure 4. Source: Company Statements, Framework Investing Analysis
On an absolute basis, our worst-case OCP forecast is that the firm will generate around $4.9 billion this year, compared to the firm’s actual OCP run-rate of $5.1 billion.
Investments
No company provides enough disclosure in its earnings announcement to accurately calculate Framework’s measure of investment spending: Net Expansionary Cash Flow. From the disclosure UNP does offer, we think total Net ECF will come in at just less than $900 million for the first half of the year – 23% of OCP so far.
Our model assumes the company will spend 30% of its profits on investment spending so actual Free Cash Flow to Owners (FCFO) in the first half should fit well within our projection window and will be closer to the worst-case assumption.
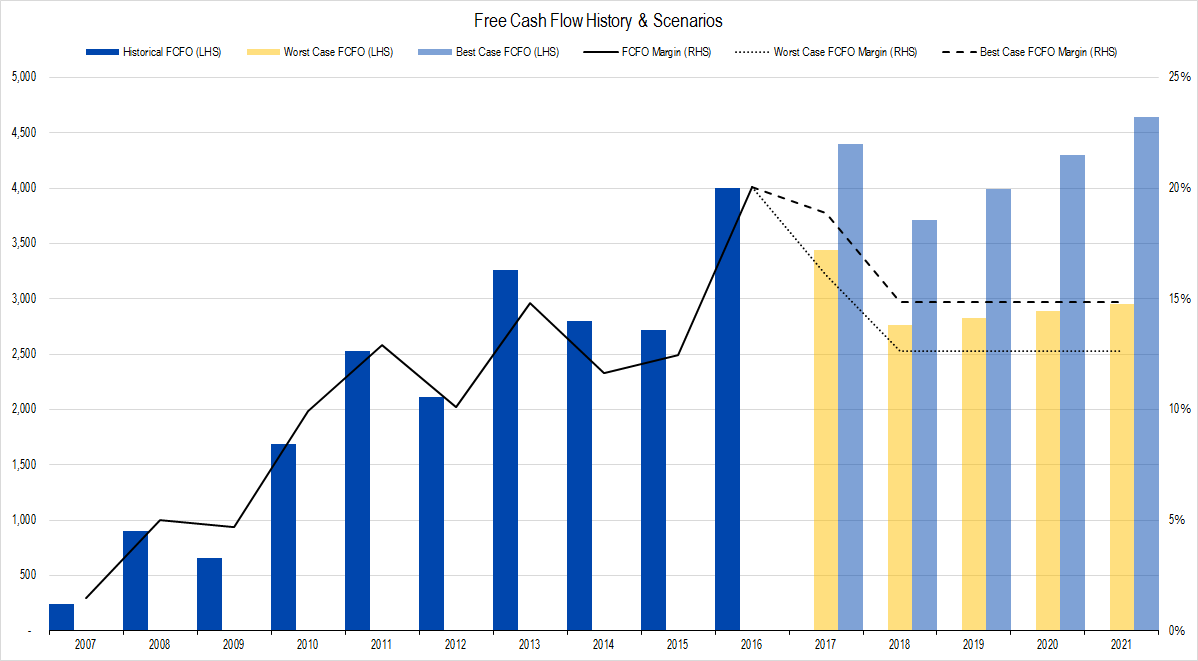
Figure 5. Source: Company Statements, Framework Investing Analysis
Valuation
There is no reason to alter our medium-term growth view based upon short-term earnings results, so we are leaving these unchanged. Considering this year’s operational results – especially revenue growth nearer our worst-case scenario – we estimate that the firm’s fair value range lies between $66 and $83 per share. Note that the Valuation Waterfall diagram below has been updated for a reduced share count and the time value of money.
 Loading...