In our IOI Office Hour session last night, we were talking with our members about Under Armour (UA / UAA), when one of the group asked about Under Armour’s quality ratio.
The Quality Ratio
The quality ratio is a measure of gross profitability divided by total assets, that was first defined by Robert Novy-Marx, a professor at Rochester University in a paper called Quality Investing.
The member asked if we should be worried that Under Armour’s quality ratio had been on a pretty steady decline for some time.
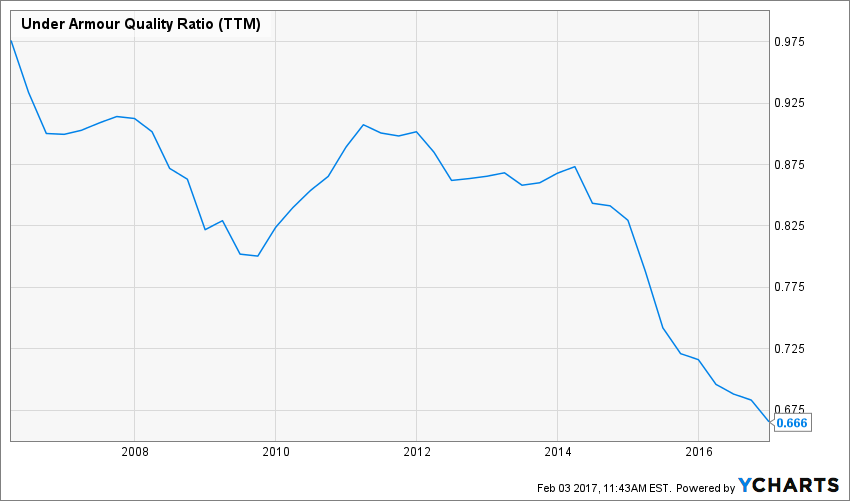
Figure 1. Under Armour’s Quality Ratio
He mentioned that Under Armour’s competitor, Nike (NKE) had been able to maintain a more stable quality ratio over time, and the contrast between the two firms gave him pause when he was thinking about buying Under Armour.
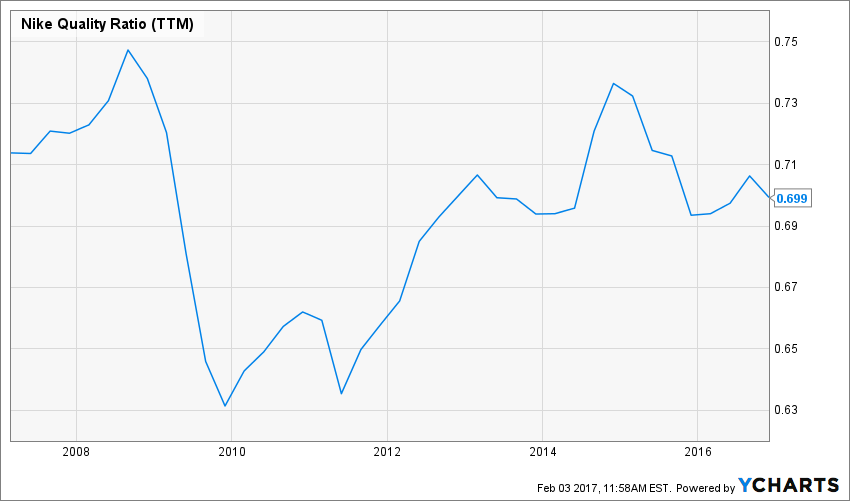
Figure 2. Nike Quality Ratio
This is a good question, so this morning, I sat down to take a look at the question and decompose it.
The quality ratio is made up of two inputs – gross margin and total assets. Let’s take a look at a comparison of both companies on these factors.
Gross Margins
Here is a comparison of Under Armour and Nike’s gross margins:
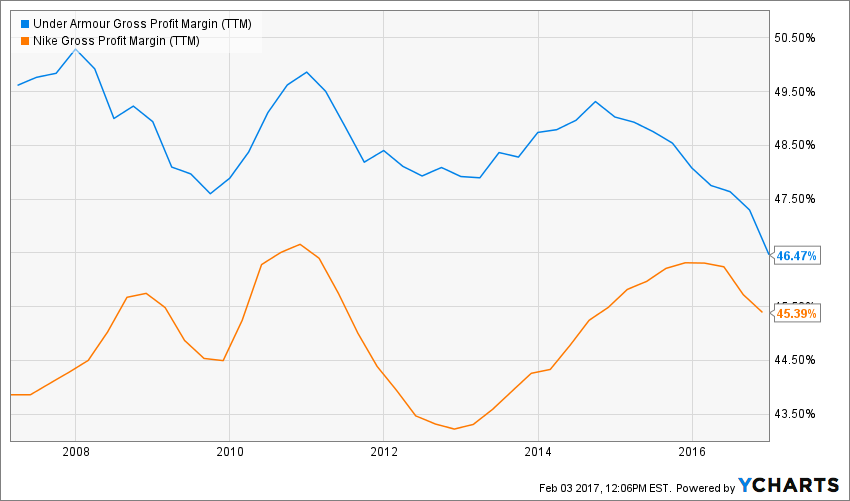
Figure 3. Gross Margins: Under Armour vs. Nike
We do see a quick drop-off in gross margin for Under Armour since the start of 2016, but I note that Under Armour’s gross margin is consistently above that of Nike. Also, with the exception of the 2016 dip, Under Armour’s gross margin looks more stable than that of Nike’s.
Setting aside the recent gross margin weakness for a moment, let’s next turn to the denominator of the quality ratio score – total assets.
Total Assets
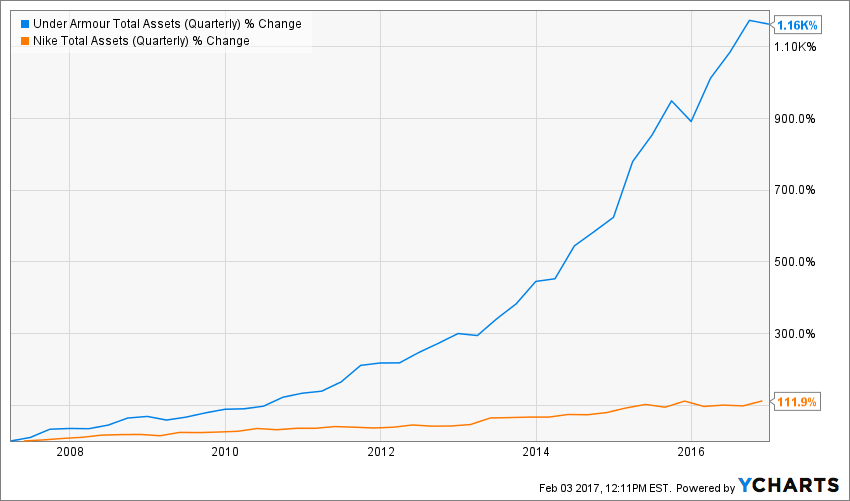
Figure 4. Total Asset Change: Under Armour vs. Nike
Because Under Armour is so much younger of a company than Nike, it’s sensible that it is building its asset base so strongly in comparison. Note that after a dip at the end of 2015, total assets increased very quickly during most of 2016 at Under Armour. In contrast, it looks as though Nike’s level of total assets is essentially unchanged during this period.
With assets growing this fast, it does not seem odd to me that Under Armour’s quality ratio downward trend is that surprising. Depreciation charges are growing very quickly at Under Armour, and depreciation charges hit mainly gross profitability.
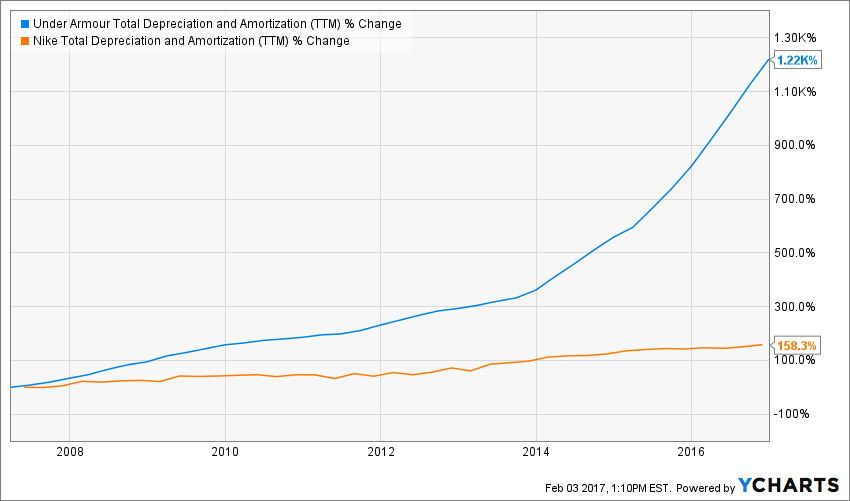
Figure 5. Change in Total Depreciation Charge: Under Armour vs. Nike
Root Cause of Gross Margin Decline
Our group is just starting to dig into the operational characteristics of the company, so we have not come to a firm conclusion regarding the root cause behind the gross margin decline. That said, I see two good possibilities:
- Write-downs of inventory
- Margin compression due to a new product line introduction
Regarding the former, this morning, an institutional investor who was on the call sent through what he had found in the financial statements after our Office Hour conference:
UA inventory write downs are buried in COGS. However, I don’t think its a material number. In the 2015 AR they do disclose “inventory obsolescence” as part of deferred tax assets, it looks to have been about $3M. More importantly I think it is showing up in gross margin as the discounted products deflate sales.
So the “inventory obsolescence” issue has meant that Under Armour has had to take some discounts to sell some of its inventory, and these discounts have pulled down the gross margin some. This discounting process is a very typical for a fashion-driven business like this, and according to the investor quoted above, the firm has contracted with a tech firm to implement a system to optimize its inventory planning process:
UA is collaborating with SAP (SAP) to provide enterprise resource planning (or ERP) solutions for inventory optimization, process improvements, and improved cost management. On the inventory side, the biggest benefit is expected to come from higher inventory visibility across selling channels and geographies.
The implementation of this system may also bring gross margin down somewhat, though its implementation is at least designed to increase profitability in the future.
Regarding the latter point – the profit pressures from a new product line – we can see from the IOI Model we’re using to value Under Armour that its “Connected Fitness” business is still in a very early stage of growth.
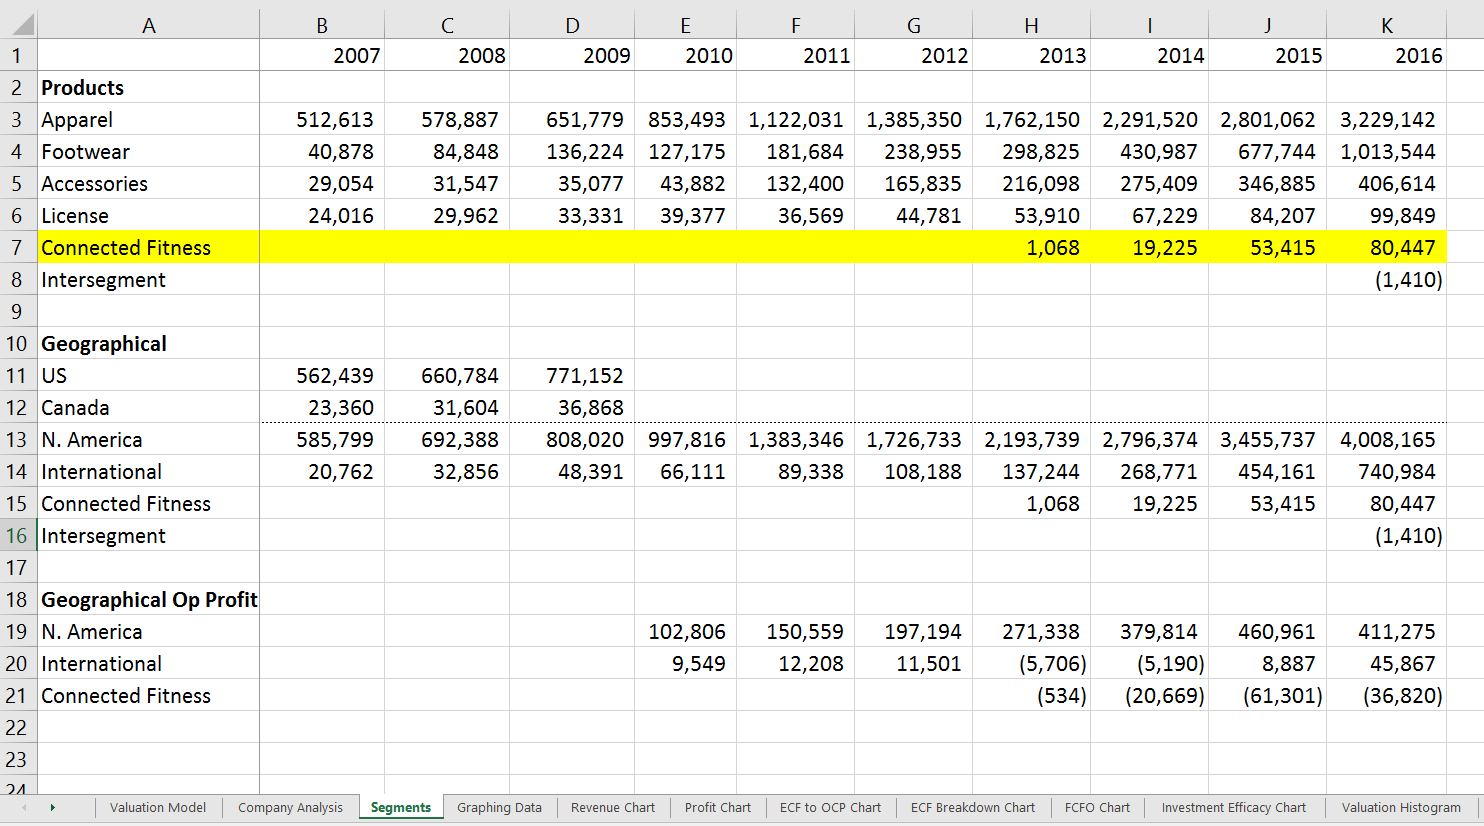
Figure 6. Source: Company Statements, IOI Analysis
Connected Fitness is a business like Garmin’s, that sells electronic activity monitors and similar devices. It is different enough from Under Armour’s line of stretchy lycra sportswear, that it’s a safe bet that the company is having to invest in building out scale to help that business develop and grow. Indeed, a quick look at our Expansionary Cash Flow graph from the model shows is that 2015-2016 has seen a very extensive increase in investment levels:
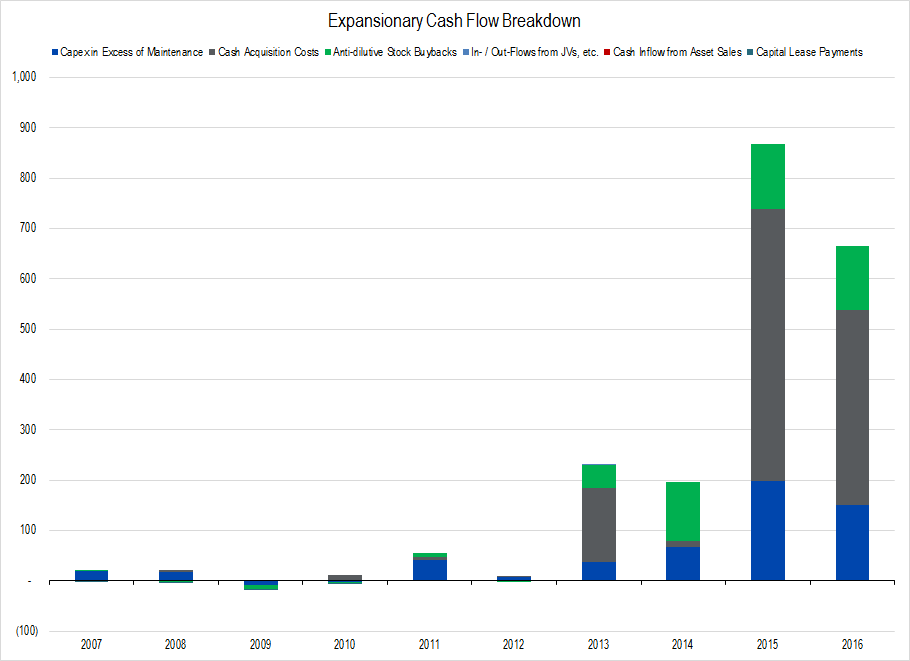
Figure 7. Source: Company Statements, IOI Analysis
We suspect that this added recent investment represents a big part of the fall off in gross margin during 2016. As long as the company can continue to generate robust revenue growth (overseas sales look like a particularly promising area for growth), the added scale should allow gross margins – and hence the quality ratio – to head back up in the future.