Framework members know that we are proponents of constructing a “hybrid” portfolio that includes both broad market exposure (passive investments) and stock-specific exposure (active investments).
Terrific active investment opportunities do not come along everyday, so the passive component of a portfolio allows an investor exposure to an ownership claim on the awesome creative potential of a well-functioning capitalist economy while accepting only “systemic” or broad-market risk.
Our recommendation of passive strategies does come with a caveat. Namely, if some significant proportion of investors are not actively attempting to find and exploit security mispricings, the price of an index will cease to reflect the potential of an economy to generate wealth[1].

Oaktree Capital’s Howard Marks’ appearance on CNBC
When index prices overshoot the potential of an economy to generate wealth, it is called a bubble, when they undershoot, it is called a crash. Overshoots and undershoots are good friends – one always loyally follows the other.
A massive amount of money has flowed into passive strategies in recent years – according to Howard Marks at Oaktree Capital, 37% of equity trading today is passive and over $1.4 trillion has flowed to passive index mutual funds and ETF’s over the past decade.
The possibility that the surge in passive investing (and its close cousin, closet indexing) has decoupled prices from economic potential is something that should concern and engage all of us as investors.
Before talking about what’s wrong with passive investing, let’s take a closer look at the academic theory underlying this phenomenon – the Efficient Market Hypothesis (EMH) – and its implications on investment portfolios.
The Efficient Market Hypothesis and its Implications
This year’s winner of the fake Nobel Prize in Economics[2], University of Chicago professor Richard Thaler, once famously characterized EMH in terms of two components:
- The Price is Right
- No Free Lunch
“The Price is Right” is the contention that no matter the price at which an asset is trading in the market, it represents the true value of the underlying company.
“No Free Lunch” is the contention that it is exceedingly difficult for investors to consistently select baskets of securities that will outperform the market as a whole without taking on excessive risk.
Setting aside what proof might or might not exist for either or both of these contention’s, let’s look at how someone who accepts the EMH – hook, line, and sinker – would allocate investment assets.

Because the Price is Right, there is no benefit for looking for mispriced securities. Because there is No Free Lunch, the best one can do is to invest in a broad-based index.
Most of the time, this allocation represents a pretty good investment choice in our opinion. Especially for young people who have years to retirement, consistently setting aside some portion of their paychecks and investing it in the index at whatever price it happens to be trading at the moment is a great solution for two reasons.
First, fees on index funds are extremely low. One of the most important, yet least discussed, qualities of an effective investment plan is keeping costs down.
Second, the index generates pretty good returns.

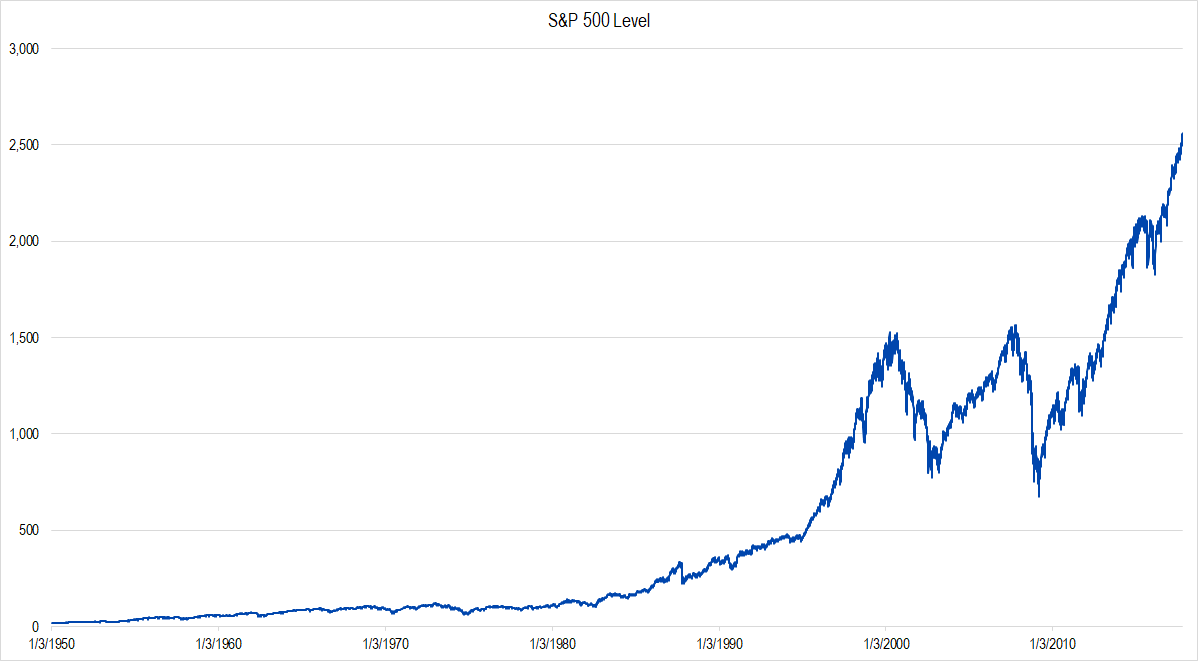
Figure 1. Source: YCharts
Over time, an investor in the index has generated nominal returns of around 10%. Compounding being the wonder that it is, 10% per year is enough to turn a young, consistent saver into an elderly, contented spender.
If index investments are cheap and generate good profits what’s the problem with passive?
The Problem with Passive
In short, the problem with passive is that you might not like what the market gives you.
The index is not like a juke box, into which you slide your coin and immediately enjoy 10% returns. Over shorter periods, index returns can slip and even – gasp – turn negative.

Figure 2. Source: YCharts (data), Framework Investing Analysis
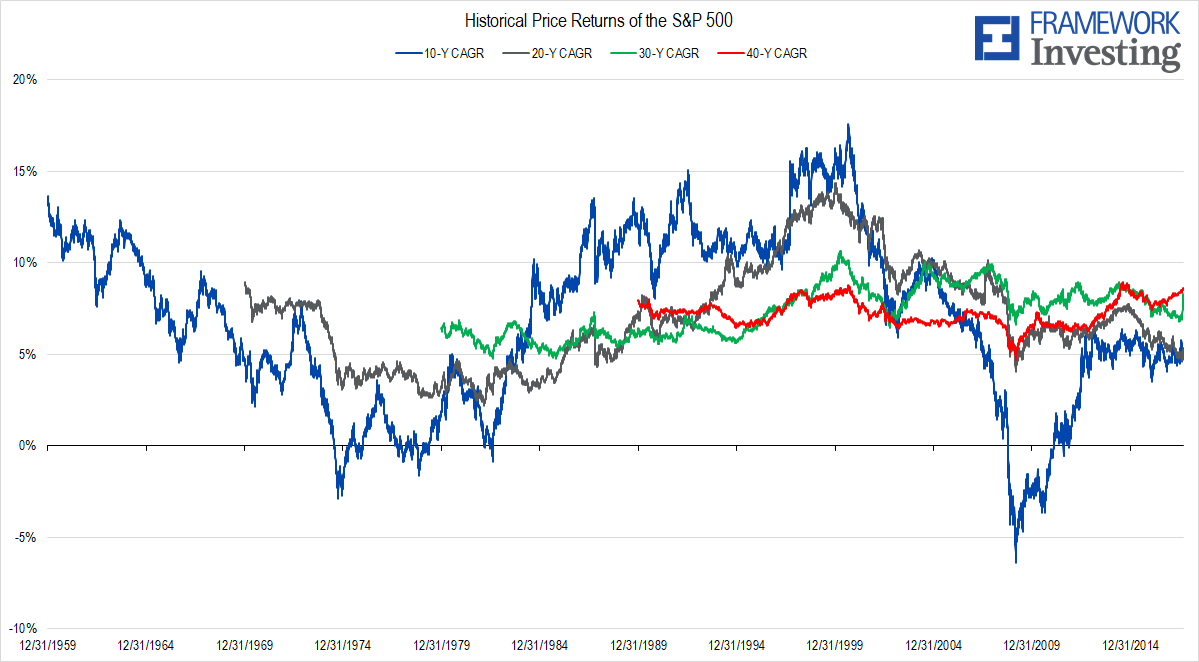
The chart above presents period returns under an admittedly unreal set of assumptions; namely, in each case, an investor has a chunk of savings at time A that s/he invests in the index, then pulls out at a later time B. The blue line assumes that time B occurs 10 years after time A and the red line assumes that it occurs 40 years after. (We ignore dividends, but you can mentally shift those lines up by around 2%-3% to account for dividend payments.)
Clearly, the 40-year compound annual growth rate (CAGR) line is the steadiest and most reassuring. It shows an investor who generated only one instance of disappointing growth – around 5% per year for an investor cashing out at the depth of the financial crisis – but who has, for most of the history, generated capital growth in the upper single-digits per year. Adjusting for dividends, the red 40-year CAGR line ends up generating close to the expected 10% per year.
In comparison, the blue 10-year return is very volatile – ranging from a low of a loss of more than 5% per year to a high of a gain of more than 15%.
Herein lies the root cause of the trouble with passive investing: human decision-makers tend not to be disciplined, thoughtful, and patient. Instead, they are jumpy, reactive, and quixotic. They pour money into stocks when index levels are high because they want a “piece of the action” and pull their money out as prices fall so they can feel “safe.”
Rather than jumping into the market as the Korean War starts and pulling out when John F. Kennedy wins the 1960 election, most people are tempted to start investing late in Clinton’s second term and convinced they should pull out when Lehman declares bankruptcy.
In other words, the price of the index deviates due to behavioral factors and “dumb money” investing.
Without active, fundamental analysis, human investment whims begin to drive prices away from a reasonable projection of the economy’s power. When prices overshoot, the assumption that the market will be able to generate our 10% benchmark returns becomes far harder to support.
Right now, passive investing feels great – someone who bought the index in March 2009 has generated average annual returns in the mid-teens percent with very few bumps along the way.
We think that a large proportion of passive investors are extrapolating the recent low-risk / high-return history into the future without consideration for changes in the operating environment or an appreciation for the statistical concept of “return towards the mean.”
We have no idea what catalyst or event (if any) will trigger a reset of prices to expectations, but we do believe that pure passive investors may dislike what the market gives them over the next 10 years.
Notes
[1] For those of you keeping track of academic citations, this caveat is at the heart of the Grossman-Stiglitz Paradox.
[2] There is some controversy about whether Alfred Nobel would have wanted his name to be associated with this prize, which was established in 1968. Some believe that The Sveriges Riksbank Prize in Economic Sciences in Memory of Alfred Nobel is a well-conceived of and orchestrated marketing campaign to remake economics into a hard science.
This article originally appeared on Forbes.com

