 |
| Source: The Framework Investing (2014, McGraw-Hill) |
In Chapter 7 of The Framework Investing, I write about the overcharging for out-of-the-money (OTM) options that leads to implied volatilities being much higher than those for at-the-money (ATM) options. This effect is known as the Volatility Smile (a.k.a. Volatility Smirk, Volatility Skew).
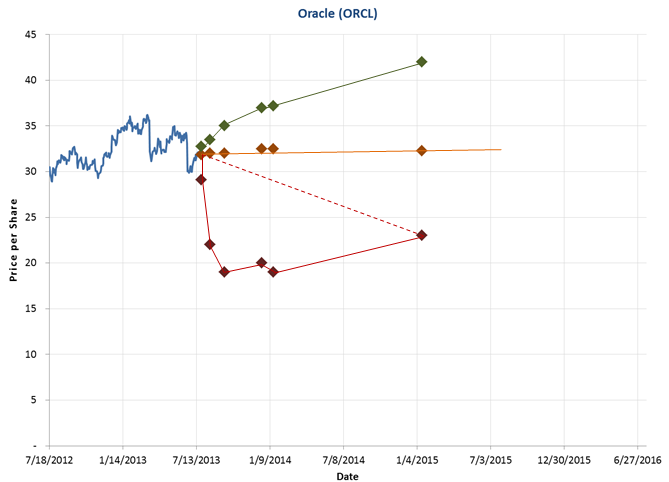
Another way to think about the Smile is as a deformation of a stock’s BSM Cone. Compared to the uniform, symmetric cone specified by option pricing models, in the market, BSM Cones drawn using actual prices can be terribly distended:
 |
| Source: The Framework Investing (2014, McGraw-Hill) |
Looking through some old files the other day, I happened on an academic paper [1] that addressed the origins Volatility Smiles in index options, and thought that it was important enough to post it in The Framework Investing website‘s Archives section.
This paper discusses the author’s observations regarding possible causes of the ’87 crash and of the reaction to the option market to the crash. In it, I found the following passage, which documents the birth of the volatility smile in options on the S&P 500.
In an early paper, I showed that exchange-traded options on US stocks between August, 1976 and August, 1978 had approximately flat smiles. Moreover, evidence suggests that from 1983 to before the crash in 1987, smiles of index options were approximately flat. This evidence supports the Black-Scholes formula…
However, in the post-crash market, from about April 1988 for at least the next decade, S&P 500 Index options had very steep smiles. For example, on a typical day (January 2, 1990) the implied volatility varied from 22% for options that had strike prices 8% less than the concurrent index to 13% for options with strike prices 8% more than the concurrent index. This represents an extreme aberration from the predictions of the Black-Scholes formula.
Emphasis mine.
Within the same paper, the author–a tenured professor at the University of California, Berkeley–points out a fact that serves as one reason I give in The Framework Investing for not taking the Black-Scholes Model (BSM) too seriously.
The BSM is a mathematical representation of the Efficient Market Hypothesis (EMH). One pillar in the EMH is that securities returns are Normally distributed (i.e., stock market returns follow a bell curve, implying that prices are lognormally distributed). You do not have to have a PhD in Mathematics from MIT or Berkeley to tell, after a few seconds of visual inspection of the market’s actual return distributions over different time periods that it is not.
In the paper quoted here, the author wryly notes that
Adherents of geometric Brownian motion or lognormally distributed stock returns (one of the foundation blocks of modern finance) must ever after face a disturbing fact: assuming the hypothesis that stock index returns are lognormally distributed with about a 20% annualized volatility (the historical average since 1928), the probability that the stock market could fall 29% in a single day is 10^(-160).
In simple terms, were percentage returns distributed in a bell curve (as is human intelligence, length of pinky fingers, etc.), a market fall like the one we saw in 1987 would be unlikely to have occurred since the Big Bang, let alone during the lifetime of anyone reading this blog posting.
It turns out that this mathematical error is an outgrowth of a structural weakness in the EMH and the BSM that can prove phenomenally helpful to intelligent investors who understand where to look.
For those of you who would like to understand where to look, read through The Framework Investing today!
NOTES:
[1] “Comments on the 1987 Stock Market Crash: Eleven Years Later”. Rubinstein, Mark. Risks in Accumulation Products, Society of Actuaries, 2000