Procter & Gamble’s (PG) stock has risen 22% since its September 2015 lows, in comparison to a rise of only about 6% for the S&P 500. For those lucky investors who got in at the bottom, we think it is about time to get out – our valuation shows that P&G is fully valued and then some.
(This article is but one of many we have published on P&G recently and will be publishing soon. See this page for more information.)
Good things are happening at P&G. It’s restructuring program has boosted profits and it has also announced plans to pump up the volume on its share retirement and dividend program; a move that will return billions of dollars to shareholders over the next four years.
Despite these positives, looking at P&G through the lens of our valuation methodology, we think that the current stock price reflects the recent good news.
The graphical representation of our best- and worst-case valuation scenarios are shown in the figure below. Our best- and worst-case valuations for P&G are $57 / share on the low side and $94 / share on the upside. Most of our valuation scenarios are lower than the present stock price.
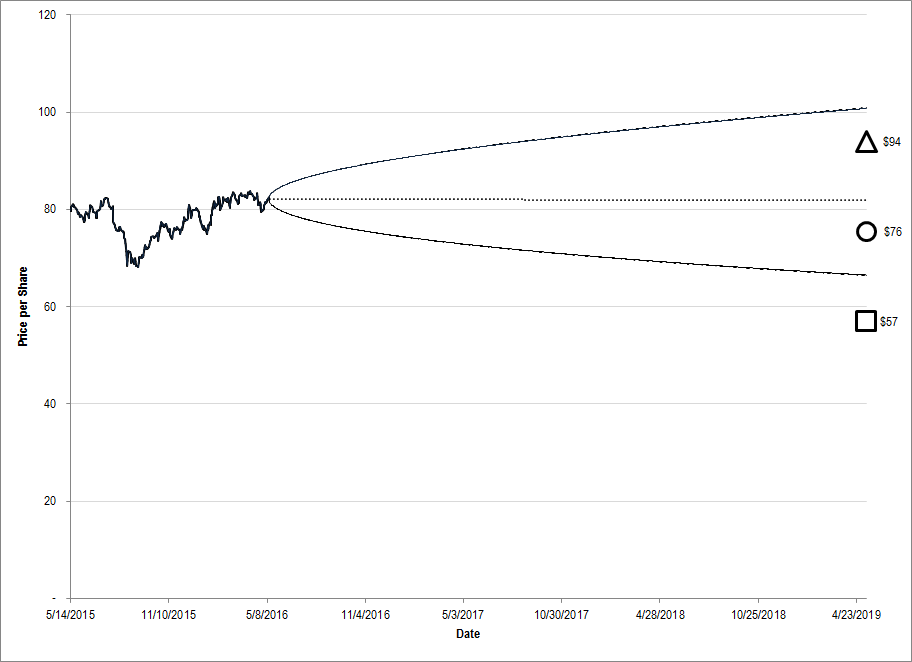
Figure 1. Source: CBOE, YCharts, IOI Analysis. The cone-shaped region represents the option market’s best idea for the future price of the stock. The geometric shapes to the right of the diagram represent IOI’s estimated valuation range.
There are only three drivers which can affect the value of a company: Near-term revenue growth and profitability and medium-term cash flow growth. (We just posted a video of how these drivers work together to create a valuation range for Union Pacific, and will post another for Apple soon!)
Revenue Growth
P&G’s restructuring program has been aggressive in its paring of non-core brands, with the firm jettisoning over 100 of these lines over the past few years. We think these divestitures make good strategic sense, especially considering that revenues are down only about 10% in return for about $6 billion of extra cash in its coffers.
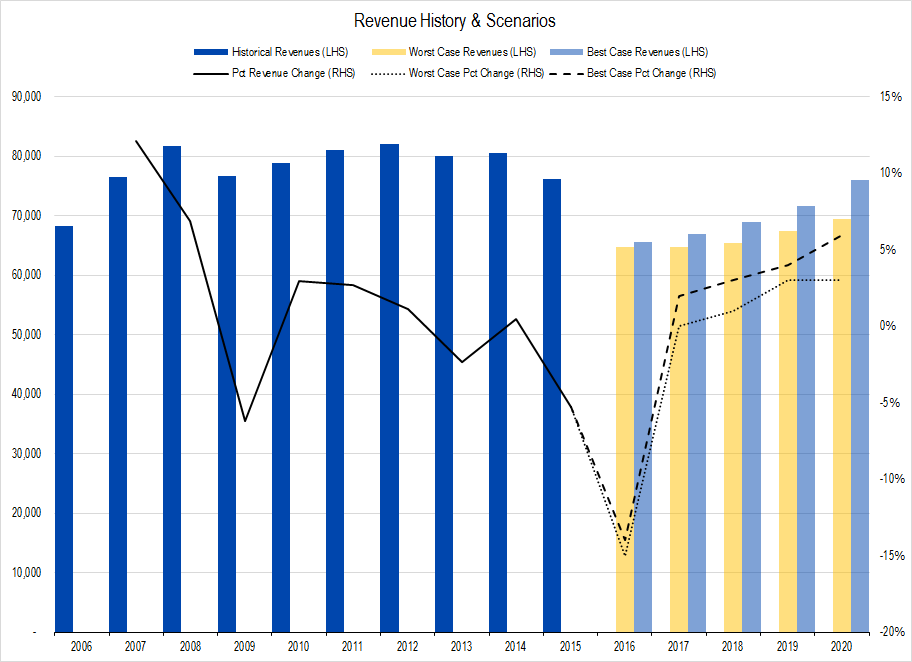
Figure 2. Source: Company Statements, IOI Analysis. the 2016 drop represents divestitures for the fiscal year ending this month.
Our best-case revenue projection calls for an average 0% growth over the next five years (including this fiscal year’s big divestiture-driven decrease) and our worst-case projection sees an average 2% fall in revenues over the next five years. These revenue growth rates depend on how successful the firm is in building its business in China, India, and South America and doing better providing compelling products to Baby Boomers in the developed world.
Profitability
As P&G management has focused more on its core brands, it has become more efficient at converting its revenues into profits. In the 1990s, the firm generally managed to generate an Owners’ Cash Profit margin in the high single-digit percentage range. Since the turn of the century, its OCP margin has been in the low- to mid-double-digit percentage range. During the trailing twelve month (TTM) period, P&G has generated OCP margins of over 17% and our best-case scenario, we think they could average as high as 19%.
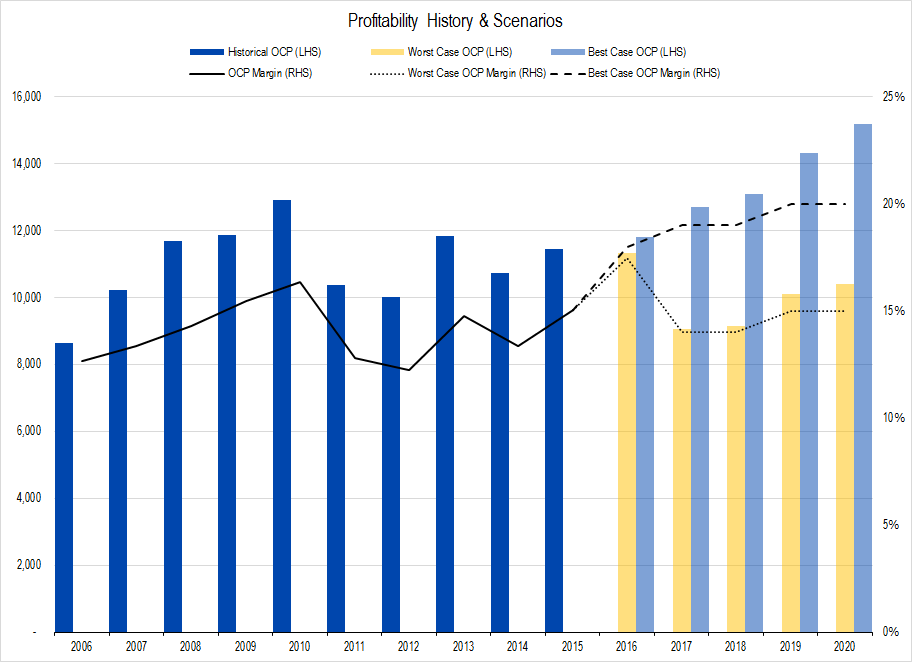
Figure 3. Source: Company Statements, IOI Analysis. We think that profitability has shifted upward. Our best-case scenario implies a profit level higher than ever generated by P&G.
Medium-Term Growth
A company’s ability to expand its medium-term profit and cash flow at a quick pace depends entirely on the success of its present investments in its business. P&G’s case is complicated by the fact that it is presently divesting rather than investing so future growth will depend upon initiatives not yet announced.
As such, we have a pretty wide range of medium-term cash flow growth projections – best-case of 8% per year, worst-case of 3% per year. These figures came from an analysis of P&G’s historical operations back to 1996.
Pulling all this together, we get a valuation range of from $57 / share to $94 / share with four valuations clumped at the lower end of this range as shown in the figure below.
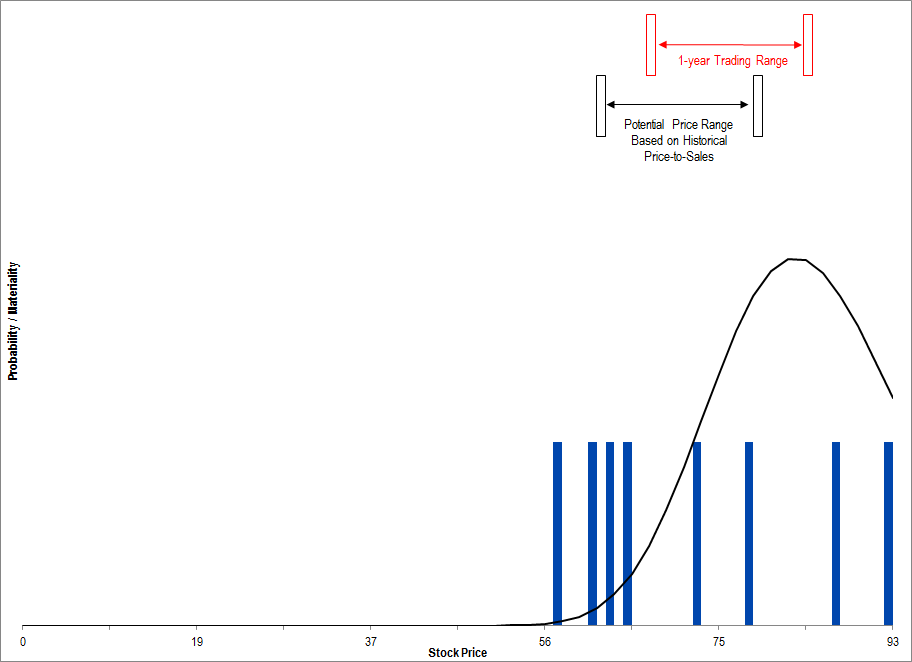
Figure 4. Source, CBOE, IOI Analysis. Curve represents the option market’s perceived price range. Blue columns are IOI valuation scenarios which are based on best- and worst-case values of each of the valuation drivers. Six out of eight valuation scenarios are below the present stock price.
The take-away? If you own P&G today or are thinking about a new purchase, be aware that the risks are to the downside. P&G’s 3.2% dividend yield looks attractive in this zero interest-rate world, but those sensitive to capital losses should take care.