
Executive Summary
- Union Pacific (UNP) reported first quarter earnings before market open on April 27. Its reported earnings beat average analyst expectations and the share price is up in morning trading.
- Revenue growth was below our worst-case forecast, while profitability was near the high end. The firm increased spending on capital items this quarter in comparison to 1Q16, but looks to still be assuming a conservative posture on investments.
- While there is still a month and a half to go before expiration of the call spread which we featured as one leg of a “bearish diagonal,” the present stock price generates an unrealized loss on this position. We are continuing to hold our own position at a loss and will increase our exposure to this bearish investment using an In-the-Money put option.
Details
Union Pacific reported 1Q17 earnings that bettered Wall Street expectations for the company; that announcement is posted on UNP’s website.
Investors reacted positively to the announcement and have bid the share price up during trading today.
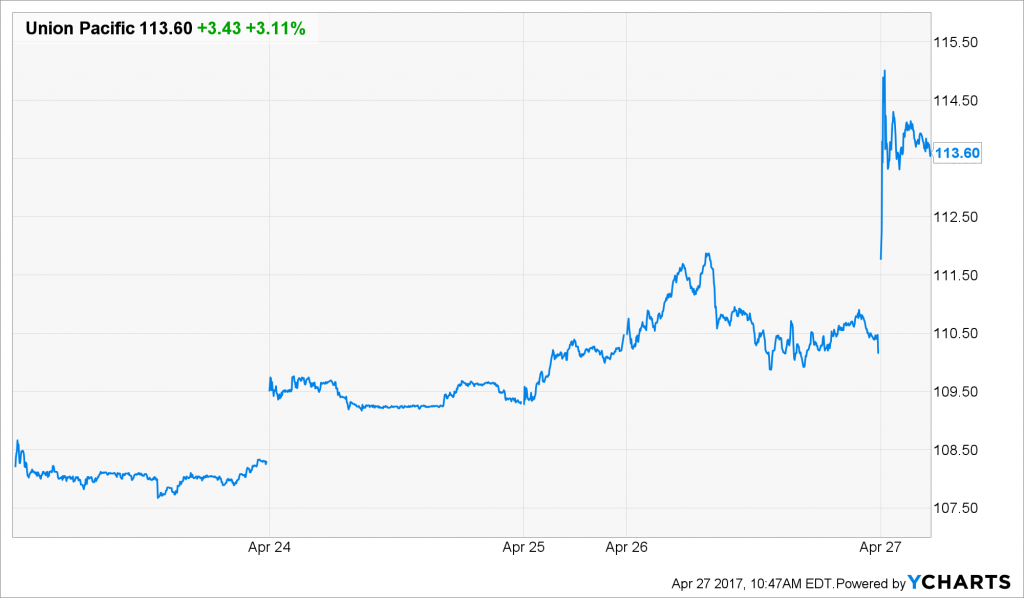
Figure 1. Source: YCharts
While news media reports that Union Pacific bettered Wall Street expectations, the cash flows generated by the firm are tracking considerably below our worst-case assumptions for this year. We detail the firm’s operating performance versus our expectations below.
Revenues
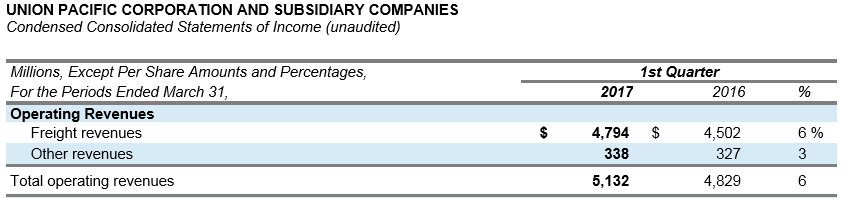
Figure 2. Source: Company Statements
As shown above, 1Q17 revenues were 6% above 1Q16 revenues. This was largely due to increasing volumes in coal and continuing pricing power in several freight categories. Our worst-case revenue growth scenario is 7%. Valuation scenarios associated with our worst-case revenue assumptions range between $61 and $77 per share.
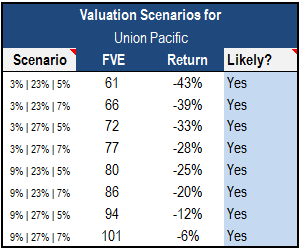
Figure 3. Source: Framework Investing analysis
In addition to the earnings announcement itself, the presentation slides for the call contain useful color regarding freight revenues by type.
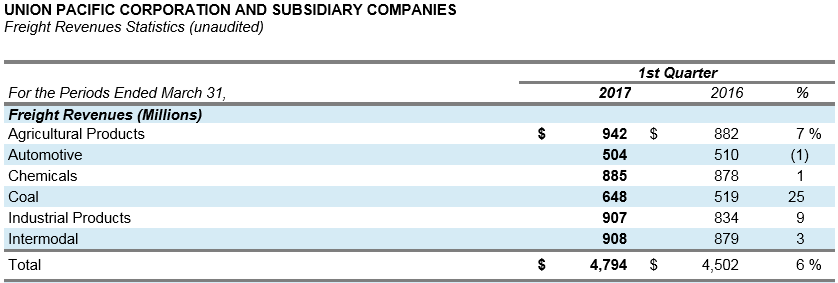
Figure 4. Source: Company Statements
Six percentage points of Agricultural products’ 7% increase was due to increased volume, thanks to export-related grain shipments.
Other than coal’s increase (16 percentage points of which were due to increased volumes), the Industrial Products category stood out to me. Because of increasing oil prices, North American fracking operations have picked up, and this has driven demand for frac sand. In the presentation linked above, the company calls out frac sand as the main driver behind the Industrial Products increase.
The firm reported that Intermodal’s revenue increase was due to pricing rather than volumes, but the company also reported that competition was picking up in this freight type.
Profits
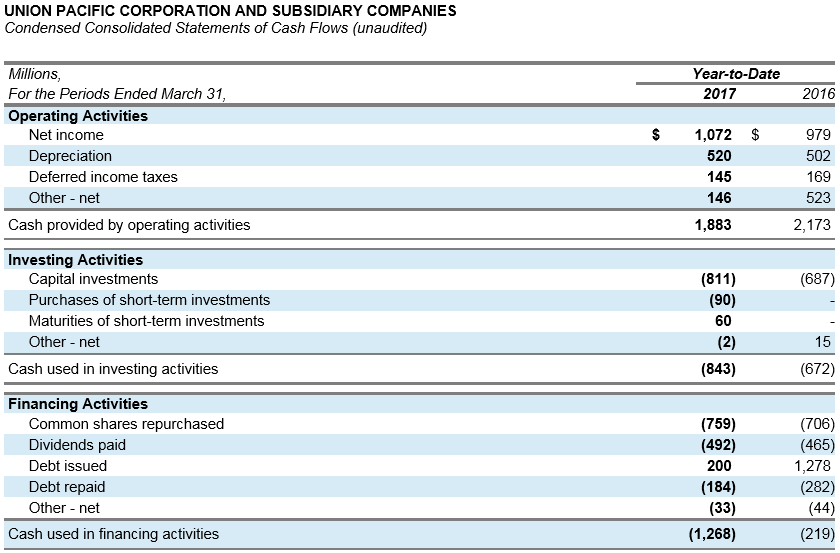
Figure 5. Source: Company Statements
The Statement of Cash Flows provided by the company is stripped down, but we have made a back-of-the-envelope calculation for both Owners’ Cash Profits (OCP) and FCFO.
We calculated Year-to-Date OCP as coming in at $1,352 million (assuming a 2% inflation rate added to Depreciation), which implies an OCP margin of 26.3% – slightly below our best-case profitability assumptions.
We caution readers that quarter-to-quarter OCP can be volatile due to dynamics surrounding working capital-related cash flows.
Free Cash Flow to Owners
The firm spent $124 million more on capital improvements this quarter than in the first quarter of 2016, but its investment level is still low. Using our depreciation-plus-inflation assumption for maintenance capex, we find that the company spent $280.6 million in growth capex during the quarter.
While stock issuance data are not available on a quarterly basis, we made the assumption that the firm’s “typical” compensation-related stock issuance equaling around $150 million was split in four equal parts.
Deducting growth capex and our rough assumption for antidilutive stock buybacks, we figure that the firm generated roughly $1 billion in FCFO this quarter. This implies Expansionary Cash Flow as a percentage of OCP of 26%, slightly shy of our forecast for 30%.
Take these FCFO calculations with a grain of salt. We will not have hard numbers for this measure until February 2018, and we made these calculations only as a rough check of our forecasts.
Investment Strategy
I like unrealized losses as little as the next guy, so of course, I am not pleased about the price action of the shares. That said, I have not seen anything in these numbers that indicate that our valuation assumptions or mental model are incorrect.
Our original Tear Sheet highlighted a strategy that we call a “bearish diagonal” that pairs a short call spread with a long OTM put option as shown below.
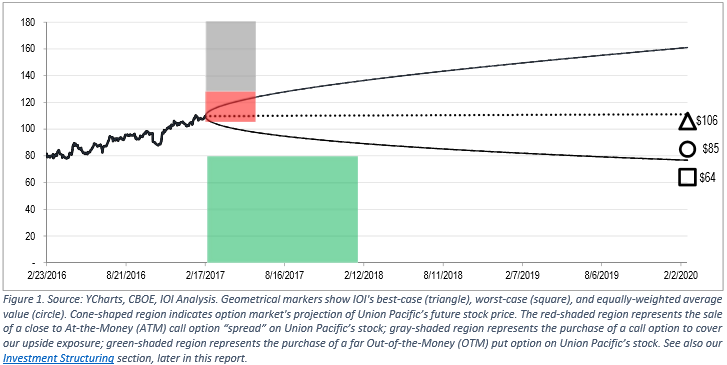
(Note that the valuation range shown above and in the diagram below is skewed upward a few dollars due to the calculation error mentioned in this post.)
We personally made this investment and also increased our exposure using what we call a “hedged short” position – an In-the-Money put option purchase.
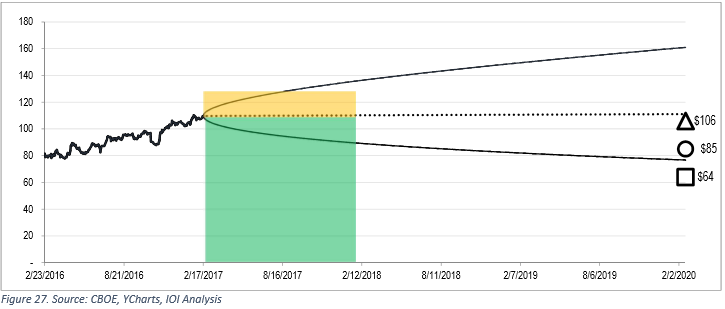
Like Caterpillar, we expect Union Pacific’s stock price to rise for a few days on the heels of this report, and will look to increase our position in this investment on an opportunistic basis.
We have risked 2.5% of our portfolio on the short call spread, spent 0.64% on the long-tenor OTM put option, and risked another 2.3% of our portfolio on the hedged short position (some portion of which was time value). We will likely increase our exposure roughly 50% from these levels.