You can find a transcript of the above video, complete with all the graphs used, on the Framework Investing website.
Nike’s Profits
Our Five-Minute valuation of Nike (NKE) was prompted by a question from a long-time Framework Investing member, Wilson M.
He got interested in the sports equipment giant based on a bullish stock report from an analyst at my former employer, Morningstar. The analyst, Michael Wong, writes:
“Despite near-term pressures, we expect profitability improvement resulting from the firm’s efforts to build out its direct-to-consumer network will lead to operating margins to 18% by fiscal 2027, up from less than 14% in fiscal 2017.”
“Direct-to-consumer” refers to Nike’s plan to sell more to customers from its own brick-and-mortar outlets and from its website; Wong believes Nike can convert more of its revenues to profits if it cuts out the middleman.
Let’s test this contention.
Nike’s DTC business is not new. The firm started breaking out DTC revenues in 2012 and already it was generating sales of $3 billion. Since then, the DTC business has more than tripled, and contributes around a quarter of overall revenues. In comparison, Nike’s traditional “Wholesale” channel has grown by 25%, a compound annual growth rate of 4.4%.
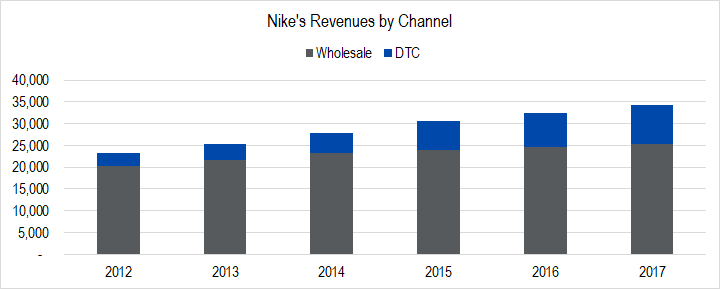
Figure 1. Source: Company Statements, Framework Investing Analysis
With the highly-profitable DTC growing so quickly, you would expect that Nike’s operating profitability would be steadily heading upward.
Here is a graph of Nike’s operating margin (a/k/a EBIT margin).
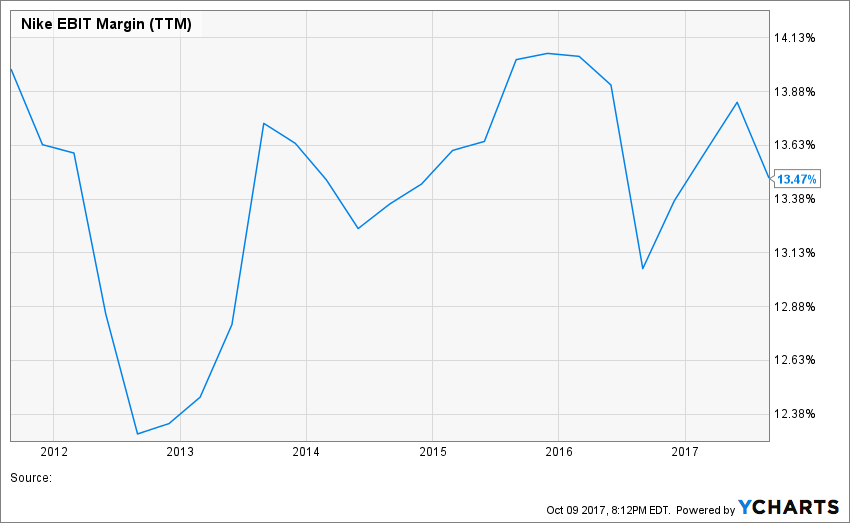
Figure 2. Source: YCharts
From the perspective of the four-year period from 2013 to the beginning of calendar 2016, the margin does indeed seem to be increasing, but the series certainly doesn’t seem to reflect a steady increase in structural profitability.
If we look back a bit further, it’s hard to spot a recent uptick in the company’s profitability at all. On the contrary, history suggests fairly stable profit margins of between 12.5% and 14.5% with an occasional dip.
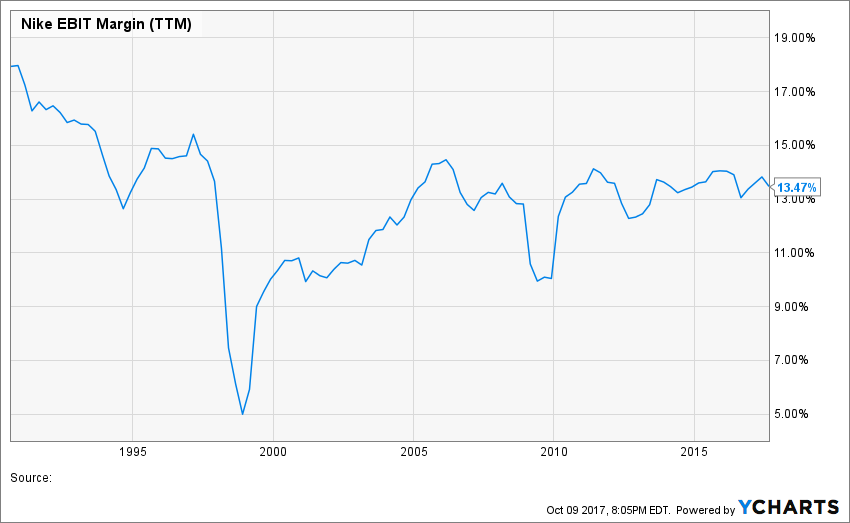
Figure 3. Source: YCharts
Operating profit is an accounting measure, and, as mentioned in the video, we prefer to analyze cash-based profitability using a measure called Owners’ Cash Profit (OCP).
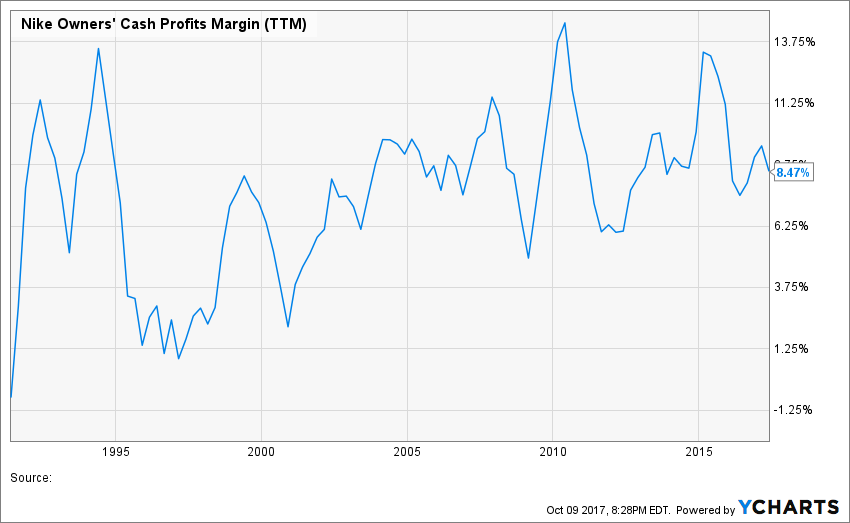
Figure 4. Source: YCharts
Again, looking at OCP margin, it is hard to spot a consistent uptrend; on the contrary, measured by OCP, margins also appear stable.
All these measures reflect the past, and investing based on historical numbers is like driving a car while looking in the rear-view mirror. Wong may be right that Nike’s profitability will increase in the future.
As mentioned in the video, we have built margin expansion into our best-case profitability forecast. We think that a durable OCP margin expansion of 100 basis points reflects a more realistic structural improvement than the lasting operating profit margin expansion of nearly 500 basis points built into Wong’s fair value estimate.
Erik will be holding video conference calls between October 12 and October 15, 2017 to discuss our Nike valuation. Please register for a complementary trial membership to Framework if you would like to attend.
This article originally appeared at Erik’s blog on Forbes.com under the title “Video: Five-Minute Valuation of Nike (NKE)”