After a rocky start to the year, equity markets are up a few percentage points for the year. We don’t like to think about performance over time periods in the range of months, but we also know it is a basic human desire to take stock of things periodically, so have pulled together a summary of IOI recommendation performance in 2016.
Before we dig into that, we’d like to suggest a few points for your consideration.
- “Performance” is hard to judge
- All bets are not created equal
Performance is Hard to Judge
Performance is easy to judge if you use a convenient metric – market price – figuring out whether a price has gone up or down would not be hard for a third grader. However, we would like to suggest that market price is a transient marker that leads people astray more often than it provides them insight.
We believe a better metric to use is one that is more difficult to judge (at least over a short time period) and requires more self-control and patience to measure – accuracy of valuation assumptions.
You’ll see periodic posts from us looking back at our valuation assumptions regarding a particular company, comparing our expectations to actual results (here is one on Oracle). For us, seeing how the company has performed is a vital part of a feedback loop that makes us smarter, more effective investors over time.
Measuring accuracy is harder to do because over a short time period, there is limited data regarding a company’s operations and seasonal factors can push one quarter’s results up or down – making a determination of accuracy difficult. It’s also hard from a psychological perspective, because while you’re waiting for operational data, the price of the stock may be tanking or soaring. It’s tempting to make a knee-jerk, X-System reaction to sell or increase position size, but we encourage people to allow the slower-cycle C-System process to work and allow time to take its course.
All Bets are Not Created Equal
Portfolio management is a big topic – big enough that many books have been written about it already and many more will be written in years to come. We have some very strong ideas about what makes a well-constructed portfolio and why, but laying all these out would mean we would have to publish a book ourselves!
At the very least, we want to give a bit of insight into how we conceive of the proper size of an investment in a portfolio, and we will split our performance summary in these terms as well.
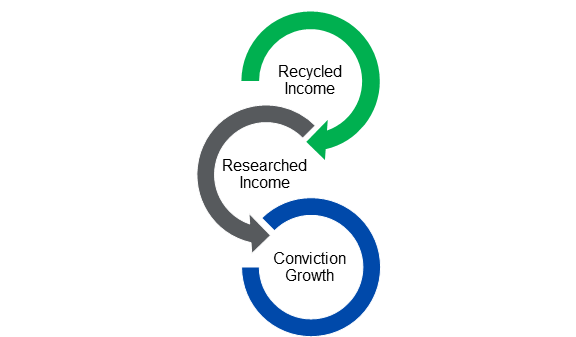
Like most people, we think about investment in terms of those that are attractive for producing income and those that are more focused on increasing the size of one’s capital base. These different objectives have different implications for the “sizing” of investments (i.e., the proportion of one’s portfolio that any one investment makes up). We like to think about the income-growth distinction and about sizing in terms of three buckets:
- Recycled Income
- Researched Income
- Conviction Growth
Recycled Income are the smallest, lowest effort investments, the kind you will find in our Covered Call Corner spreadsheets. We call them “recycled” because we are usually selecting option tenors lasting only 3-6 months long and consistently cycling through them as opportunity presents itself. “Income” comes from the fact that these investments are designed to generate option premium-based cash inflows. In the manner of a “quant” style portfolio, these investments are small and we know from the start that not all will be successful. We figure that over time, if our process is sound, we will win more often than we will lose, and will generate more income when successful than the costs generated when they are not.
Researched Income investments are those in companies which we have researched more carefully, but for which the potential for a gain seems less compelling than the income potential for accepting exposure. A perfect example is the recent analysis of Apple (AAPL) and our short put investment in it. In our view of Apple, the upside potential is undervalued but uncertain whereas the downside potential is overvalued and more certain. In this kind of a case, we are happy to generate premium income from the overvalued range of exposure and forego a less certain gain of exposure. Because we understand the valuation of these investments better, we are prepared to place more capital behind the investment and potentially to increase that investment if the choice presents itself.
Conviction Growth investments are those which we have researched carefully and for which a gain of exposure appears to be the best choice. We have various tools on hand to capture value from these investments – stocks, moderately levered In-the-Money options, and high-leverage Out-of-the-Money options. As alumni of IOI Training programs will know, we believe in a “balanced investing meal” approach. The meat and potatoes part of the meal is always the underlying stock. We sometimes choose to add flavor to the meal with moderately levered options overlain on the underlying stock and yielding a fairly low overall level of margin. Occasionally, we will add the spicy side dish of a more highly-levered option when opportunity presents itself.
Not all of the Conviction Growth investments will be those in which we have a strong conviction. We will sometimes make a very small investment in opportunities like that but often the value of these investments will be even smaller than Recycled Growth investments.
We think about these different classes of investments as being part of a chain. We may start with a company as a Recycled Income investment, but something will catch our eye about it and we will put a bit more research into it and it will become a Researched Income investment or perhaps even a Conviction Growth investment. If price moves against our Researched Income investment, we may increase our position size, at which point it becomes more of a Conviction Growth investment.
The visual we use to express our conception of portfolio management would look something like this:
With those preliminaries out of the way, we offer our recommendation performance summary for the first half of 2016.
 Loading...