After Oracle reported its first-quarter earnings, I decided to review the accuracy of my original projections for Oracle – published in the fall of 2013 – versus what actually has happened at the company in the intervening time. This article details what I found.
The defining characteristic of an IOI valuation is a clear understanding of three things:
- The firm’s operating characteristics in the present,
- How those operating characteristics influence the amount of cash the firm will create on behalf of its owners, and
- How that cash flow is likely to grow in the future.
Understanding these three things allow you to create a rational, testable valuation range for a company. When that valuation range differs from the range of future prices implied by the market can you find clear opportunities for investments that tilt the balance of risk and reward in your favor, either using options, stocks, or both.
Clearly, understanding the operational dynamics of the company is key to being successful. And there is no way to accurately gauge your understanding without going back and tracking your earlier projections with what actually happened.
I made my first valuation of Oracle in June 2013 and modified it in September of that year after I had had more time to study the company. This analysis is based on my September 2013 model, the highlights of which are below:
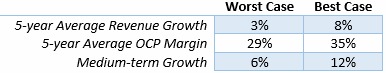
These assumptions generated a fair value range from $30 – $47 per share with a most-likely value of around $38 per share.
In comparison, in my most recent model, the driver values look like this:
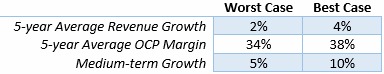
These assumptions generate a fair value range somewhat higher than the range listed above (please see our IOI Tear Sheet on Oracle for details).
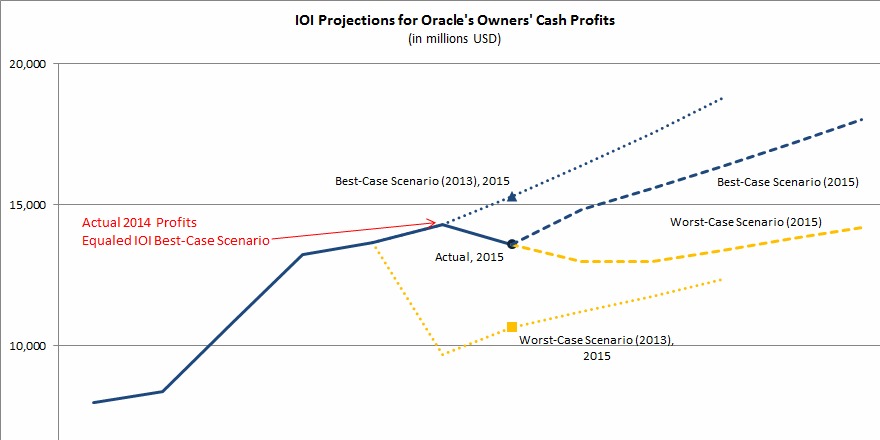
The two most important drivers in the explicit valuation stage (see the online appendices to my book for an understanding of the three valuation stages) are profitability and free cash flow, which I measure using OCP and FCFO, respectively. Comparing my 2013 profit projections to actual results, then overlaying my 2015 profit projections and plotting it all out on a graph gives me the following:
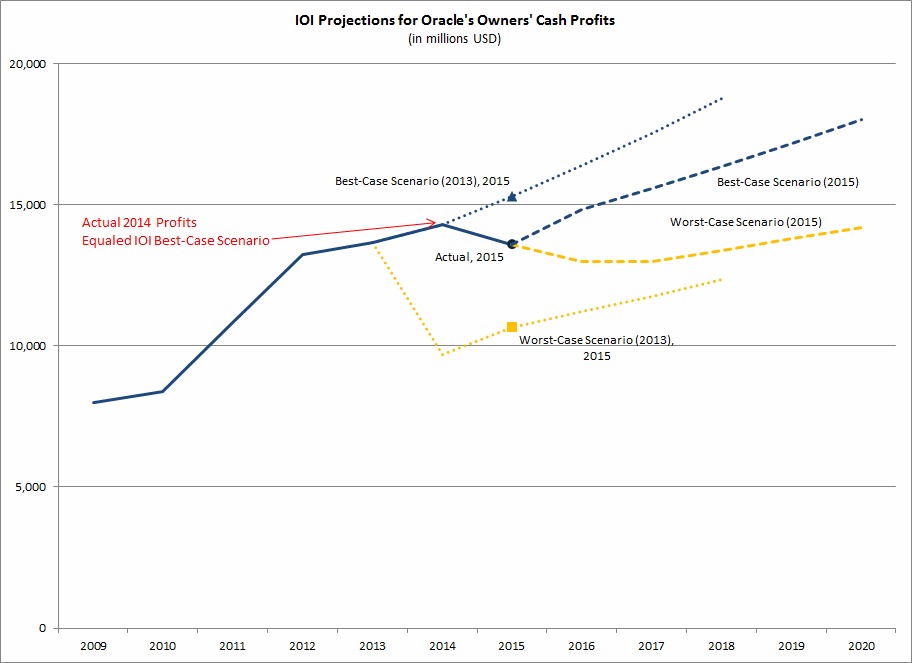
Figure 1. Source: Company Statements, IOI Analysis
The first thing to notice is that the actual profitability for 2015 lies between the best- and worst-case profitability scenarios from my 2013 valuation (represented by the blue and gold dotted lines, respectively), and that in fact, it is skewed toward the best-case scenario. Actual profitability for 2014 was essentially the same as my best-case assumption for that year.
The second thing to notice is that my projected range of profitability has become much tighter in my 2015 valuation (represented by the blue and gold dashed lines) than it was in my 2013 one. The root cause for this tightening is a combination of my realizing two things:
- Revenue growth is likely to be weaker than I had forecast, due to headwinds from the move to Cloud computing, and
- Profitability is likely to be stronger than I had originally forecast. Even though Oracle’s top-line growth over the past three years has been tepid, OCP margin has been dependably in the 36% range, making me think that higher profit margins are likely if and when revenue growth increases again.
As a result of these realizations, in my most recent valuation, ranges for revenue growth and profitability are both tighter than in my 2013 valuation, so the resultant profit projections are also tighter.
But valuations are not based on profitability alone. A company must invest to grow, and the measure of cash that is left after some portion of profits is spent on investment projects is what we call Free Cash Flow to Owners. A graph of aggregate actual FCFO during the years 2014 and 2015 compared to our 2013 projections for aggregate FCFO over this time period is below:
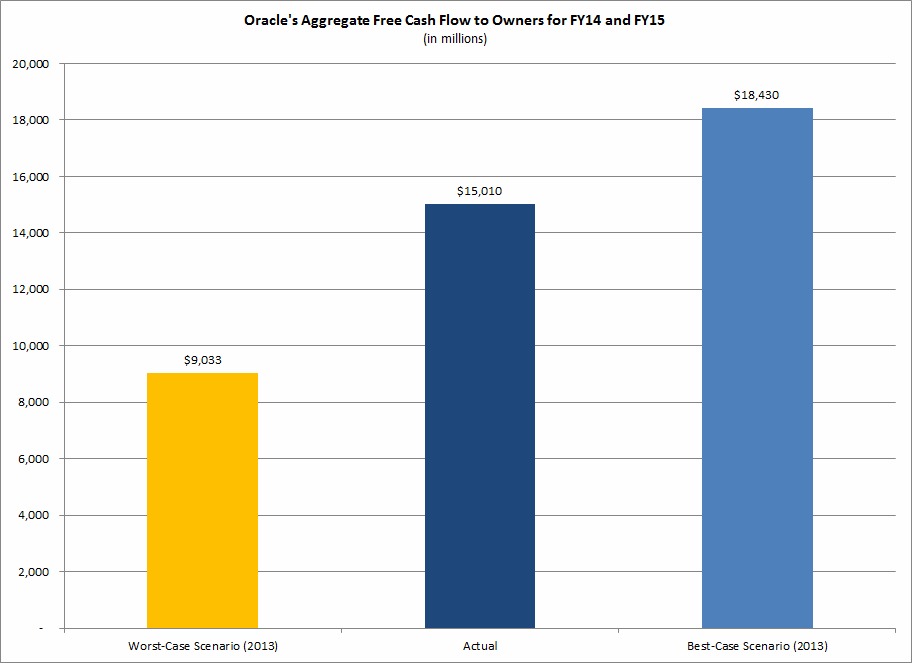
Figure 2. Source: Company Statements, IOI Analysis
Again, we can clearly see that the actual value lies within the range I had forecast and that in fact, it is trending toward the best-case FCFO scenario. This is good news for me (and for my gentle readers) since it indicates that my understanding of the firm is sound, and implies that my investment strategy will succeed.
There is one very important variable in my valuation assumptions which is not yet observable: medium-term (or what I call Investment Stage) growth rates. As you can see in the tables above, my original range of possible values was from 6% – 12% average growth in FCFO per year. My latest range is somewhat lower and tighter than the initial range for three reasons:
- Every year that passes, Oracle is growing larger, and it is relatively harder for a large firm to grow quickly.
- I had thought that Oracle might acquire Salesforce.com (CRM) and realized that this acquisition would boost FCFO growth considerably; I no longer think the possibility for such an acquisition is high.
- I worry that backdoor stock compensation will remain relatively high for a relatively long time, hereby removing one possible avenue for more rapid FCFO growth.
I will likely stick with this medium-term growth rate range unless I see compelling evidence to change it; this evidence would likely take the form of a change in the executive compensation policy.
For now, I’m happy to see that my understanding of Oracle’s operational dynamics seems on track. I hope that this article has given you more insight into the way IOI valuations are put together and how they are different from other analysts’ stock price projections.