
Executive Summary
- Even though Ackman?s investment in Target was unsuccessful, the option portion of the trade is well-documented, and an analysis of the structure of this investment is instructive.
- This article analyzes Ackman?s use of the ?listed look-alike? option market and how institutional option transactions are structured and traded.
- We find Ackman?s use of In-the-Money (ITM) options to be an intelligent, measured approach and discuss why, in general ITM options should be a go-to strategy for stock investors.
- We find that a combination of overleverage and poor timing lay at the root of Ackman?s losses in Target, and discuss what might have been done better.
Ackman?s Options
While researching the most recent YCharts Focus Report onTarget, I started to get interested in Pershing Square founder Bill Ackman?s ill-fated investment in the company?especially in the substantial option let of it. Derided as ?speculative? by Target?s management and taken as an example in the media of how ?dangerous? options can be, I was expecting something entirely different from what I found.
While Ackman?s investment in Target investment was not successful, the example holds some valuable lessons for intelligent option investors, especially those of you looking at using options in an institutional context. Unlike Ackman?s Herbalife put options, for which we had little hard data,[1]information regarding his call options on Target are well documented in an SEC form 13-D.[2]
Pershing Square built up a position of just over $2 billion in Target, using a combination of stocks, options, and swaps. Here is the breakdown of this investment.
Source: Target company filings, IOI Analysis
Let?s take a look at the $1.5 billion represented by the option leg.
The Option Leg
From the 13-D we can see that Ackman?s funds invested in the following listed look-alike[3]call options.
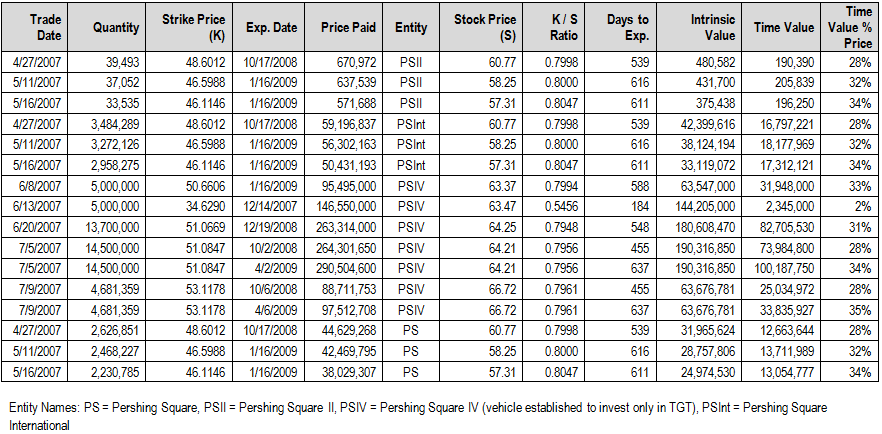
Source: Target company filings, IOI Analysis
Let?s concentrate on a few of these columns in particular?Quantity, Strike Price, and K/S Ratio?to understand how an institutional investor can use options in an investment regime. Then, we will look at what went wrong and what, if anything, could have been done to make this investment successful.
QuantityThe first thing to note is that the quantities are not necessarily in multiples of one hundred.[4]This is an example of the great flexibility of listed look-alike options available to institutional investors. Because the contracts are negotiated between the broker and the investor, the investor never has to worry about over- or under-exposure to a given stock.[5]
As long as an institutional investor is using the listed look-alike market, he or she can decide exactly the quantity of shares on which they want to transact options. This advantage is offset by the fact that an institutional investor transacting in the listed look-alike market does not have the protection of a regulated central counterparty taking the other side of his or her trade. In other words, the investor has counterparty risk with the institution (or institutions) that takes the other side of the trade.
Strike Price
For those used to seeing strike prices listed only in whole dollar amounts, the oddly irregular strike prices above (e.g., 53.1178) might seem unnatural.
For institutional investors trading in the listed look-alike market, however, the regularity of the listed market is unnaturally constrictive. When a listed look-alike trade is negotiated, it is in fact usually the Strike / Stock ratio (K/S) that is specified up front rather than the strike price.
Looking at the ?K/S Ratio? column in the table above, it is apparent that?with one exception?Pershing Square specified that the ratio was to be 80% (i.e., calls that were 20% ITM).
The exact strike prices are determined in a process related to the broker counterparty?s delta hedging of the options (the full explanation is a bit long-winded, so I have included it below in the notes[6]). As such, when Pershing Square?s traders began placing orders for these options transactions, they specified that they wanted to buy ?80 calls? on Target, which means calls that have a K/S ratio of 80%. A more highly levered OTM investment would have been in the 110 calls (OTM by 10%).
This observation leads naturally to a discussion of the K/S Ratio and an explanation of Ackman?s use of ITM calls.
K/S Ratio
Looking at the table above, many people would likely be surprised to see that Pershing Square?s entire option investment was made using In-the-Money (ITM) calls. I was happy to see that though and it showed me that Ackman had done a lot of thinking about crafting his option strategy.
I believe a strategy of buying ITM call options should be a standby for stock investors as it has many benefits?
- It uses less capital than an equivalent notional investment in stocks.
- It takes away some of the urgency associated with options expiration.
- It uses less capital on unrecoverable time value (versus OTM ones?where the entire amount of premium is time value by definition).
- It offers a lower percentage return than an OTM option strategy, it?s true, but for the same notional value it offers a much higher dollar return.
Each of these strengths is intricately related to two important characteristics of most option strategies: leverage and a finite economic life. I discuss these topics in detail in The Framework Investing, so I won?t rehash them here.
Suffice it to say that in my opinion, the Pershing Square strategy of buying the underlying stock, then layering on ITM options is a sound investment strategy that not only can be used, but should be used by fundamentally-oriented investors.
So, if this is such a great strategy, why did Ackman?s investment end in failure? We turn to that question in the next installment of this case study.
Notes:
[2]Form 13-D shows beneficial ownership of 5% or more of the shares of a public company.
[3]See our previous posting on Ackman?s Herbalife investment for a definition and explanation of listed look-alike contracts.
[4]Most listed options are traded in indivisible contracts representing 100 options each.
[5]For example, let?s say that as an individual investor, you have a $100,000 portfolio and want to take exactly a 5% position in Amazon (AMZN)?trading for $324 / share. Because the market price of the shares is so high, buying a 5% position would mean buying only 15 shares. Given these constraints, it would be impossible to take the same notional position (i.e., controlling the same number of shares of Amazon) using options. One listed option contract would give you notional exposure to 100 shares?over six times your target exposure.
[6]Once the K/S ratio is specified, the broker goes into the market and ?trades the hedge? referring to the broker?s delta hedge.
?Delta? is a mathematical relationship specified by option pricing models that among other things, gives the statistical likelihood that a stock will be at or above (in the case of a call) a certain price at the expiration of the option.
Let?s say that the call options Ackman selected had a delta of 0.75. In this example, the delta signifies that, according to the mathematical model used to price the option, there is a 75% chance that Target?s stock will close above the strike price at the option?s expiration. Ackman?s fund bought long calls, so the broker counterparty is obligated to deliver shares to Ackman if requested.
In order for the broker to be able to deliver this (very large) amount of shares, its traders purchase a quantity of stock equivalent to 75% of the nominal value of the option transaction (i.e., The broker buys 75 shares for every 100 shares Pershing Square controlled through the option contracts).
While the sell-side brokers were trading the hedge, Ackman?s traders were directing the broker to transact the hedge in the same way they might direct the purchase of a large block of shares (e.g., ?Stay under x% of average daily volume, buy at as close to VWAP [Volume Weighted Average Price] as you can, and don?t move the market.?).
The strike price is determined as a percentage equal to the K/S Ratio of the average price of this initial hedging transaction.
So, in the case of the first row of the table above, the average price of the hedging transaction turned out to be $67.11, so the strike price was specified as 80% of that figure.