
…there is nothing either good or bad, but thinking makes it so.
– William Shakespeare, Hamlet
Executive Summary
- While I’m beginning to think that “IBM” stands for “I’ve Been Mauled”, the company’s results – released after market hours yesterday – look fine to me.
- Currency conversion – a factor that I usually mostly ignore – contributed to the nominal quarterly revenue decrease of 2% on a year-over-year basis. On a constant currency basis, the company’s revenues were flat year-over-year.
- Framework’s best-case revenue scenario for this year is 0%; our worst-case revenue scenario is -2%. In other words, reported results for this quarter were in line with our model.
- Quarterly growth of “Strategic Imperatives” revenue was in line with our annual worst-case expectations of 7% (5% year-over-year nominally and 7% year-over-year on a constant currency basis). However, last quarter, SI revenue growth was 13% year-over-year. Taken together, SI growth over the last two quarters (10%) has been closer to our 2018 best-case scenario of 12% per year than to our 2018 worst-case scenario of 7%.
- IBM does not provide enough information in its quarterly release to calculate Owners’ Cash Profits (OCP), but as close as I can tell, profitability for the first three quarters of the year look roughly in line with last year. Last year’s OCP margin was 17% – equivalent to our best-case profitability projection.
In this article, we walk through these metrics and also look at IBM’s results from a more traditional perspective.
Revenues
IBM generated $18.8 billion of revenues in the third quarter of 2018, 1% below 3Q17’s revenue of $19.1 billion. Revenue change was influenced by a strengthening US dollar, which meant that overseas sales counted for less when translated back into our currency. Revenue splits for the third quarter were as shown in the figure below.
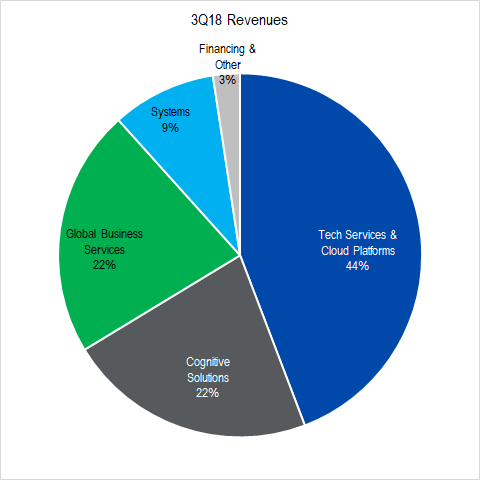
Figure 1. Source: Company Statements, Framework Investing Analysis
For the first three quarters of 2018, the company generated $57.8 billion of revenues, a 2% increase over the $56.6 billion of revenues generated in the first three quarters of 2017.
IBM’s Strategic Imperatives business has generated just shy of $40 billion over the past twelve months, and company managers reiterated their confidence that SI would generate $40 billion this year — in line with the long-term plans they announced three years ago.
Among the segments, revenues in the Cognitive Solutions segment (which contains Watson) declined a few percentage points quarter-over-quarter, and I have seen some cautious commentary regarding that result over the last since earnings were released.
According to management, the weakness in Cognitive Solutions is born of two factors: contract timing and slower than expected momentum in several businesses.
If management is telling the truth about contract timing, the modest shortfall this quarter will be made up by a modest outperformance next quarter. Management characterized the company’s deal pipeline as promising and thought the fourth quarter would see some large deals getting done.
Regarding momentum, the company has been struggling to commercialize its Watson artificial intelligence platform, and management reported that the weak sales this quarter was partially related to that struggle. Essentially, IBM is attempting to sell clients a service they have never bought before, so it is no wonder that the initial commercialization has been rocky. I have talked to people in the industry and have done some reading in industry journals about Watson; the impressions are mixed.
I’m certainly prepared to believe that this area is one which may serve as a headwind to IBM’s revenue growth, but at this time, results seem consistent with our best- and worst-case range of scenarios.
One bright spot from a revenue standpoint was IBM’s largest segment, Technology Services and Cloud Platforms. Strategic Imperatives within this segment grew at a 16% YoY clip as the company’s “hybrid cloud” offering (installations using partially on-premise servers and partially cloud servers) resonated with clients.
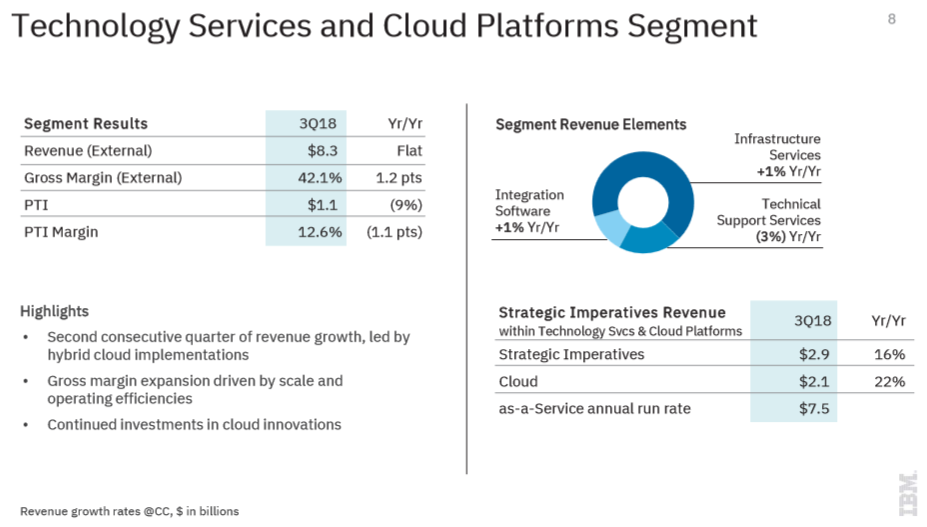
Figure 2. Source: IBM Investor Relations Presentation
In short, IBM revenue growth represent some negatives and some positives, but nothing that seems too shocking one way or another. I see no reason to modify our valuation model’s revenue growth assumption on the basis of this quarterly announcement.
Represented graphically, our best- and worst-case projections for IBM’s revenues over the next five years look like this:
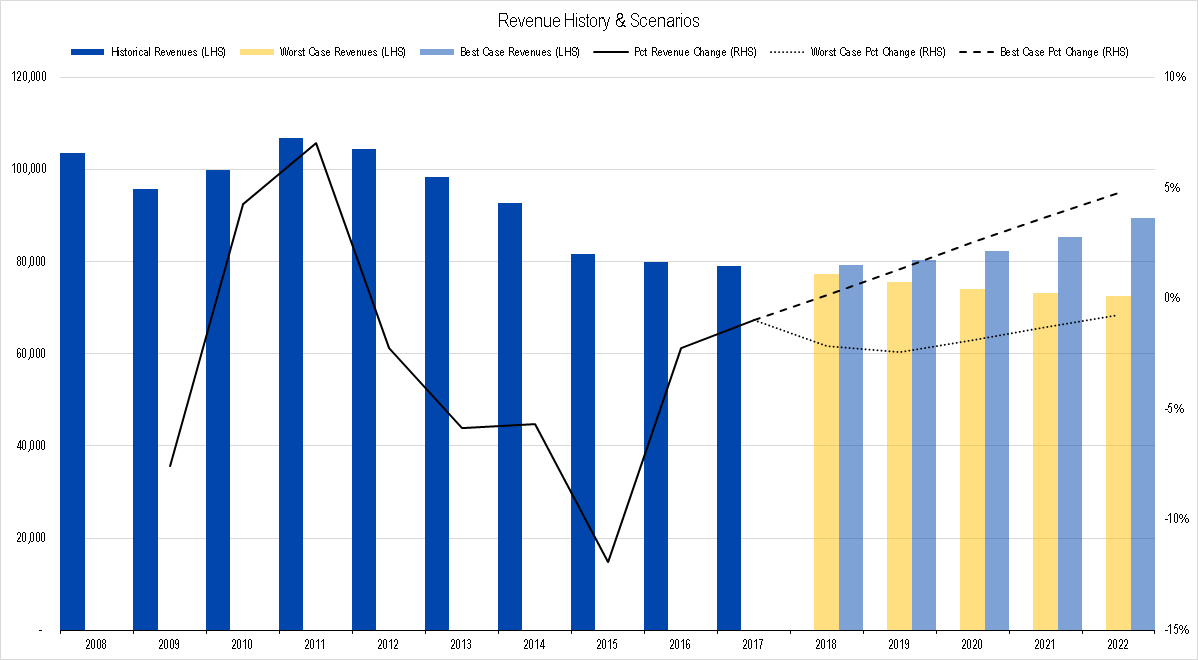
Figure 3. Source: Company Statements, Framework Investing Analysis
Profits and Investment Spending
The firm does not publish a full Statement of Cash Flows with its quarterly announcement, but rather just a high-altitude overview.
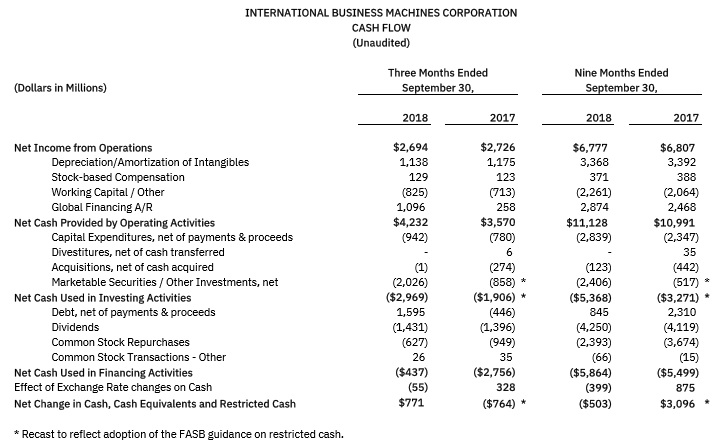
Figure 4. Source: IBM Press Release
Looking at the comparison between 2017 and 2018, though, the numbers that we use to generate our estimates of Owners’ Cash Profits look very similar. Last year, IBM generated an OCP margin of 17% which is also our the value of our best-case profitability scenario. Given the similarity in the numbers so far, I don’t see a reason to think the company will not be able to generate at least enough to meet our worst-case profitability scenarios for this year.
In terms of investments, the firm has spent more heavily on capex this year compared to last, but it has also spent less on acquisitions by an almost equivalent amount, so I see no reason why IBM should not generate a Free Cash Flow to Owners (FCFO) of about the same as last year’s value ($10.3 billion).
The firm announced that it would generate about $12 billion in what it calls “Free Cash Flow”. Depending on the amount of its stock issuance as currency, this guidance will be in the ball park of our FCFO forecast and our 2018 FCFO forecast may even be a bit light.
Long story short, I see no reason to change our profit or FCFO forecasts on the basis of this earnings announcement. Below is a graphical representation of our best- and worst-case profitability forecast.
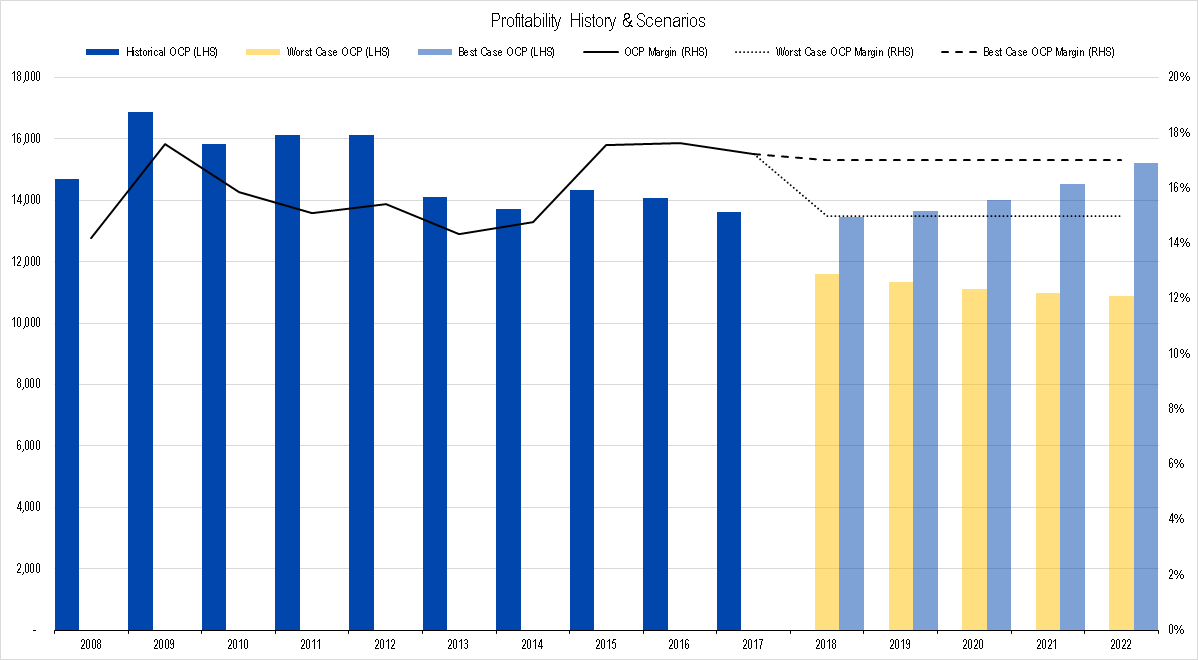
Figure 5. Source: Company Statements, Framework Investing Analysis
A graphical representation of our best- and worst-case FCFO forecasts are as shown below:
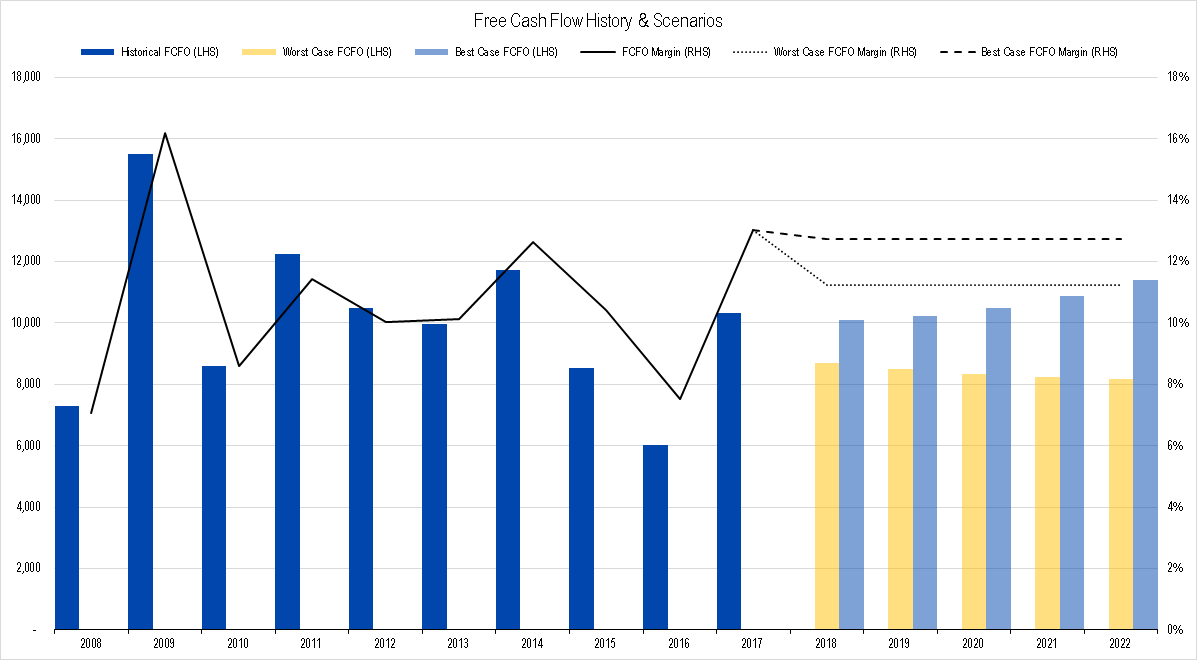
Figure 6. Source: Company Statements, Framework Investing Analysis
Alternative Analyses
I have been writing about IBM for a long time and have consistently thought that the shares were at least mildly undervalued. Still, I keep being mauled by stock price declines.
I started looking at a few different metrics – especially earnings – by which I could see IBM from the perspective of another investor.
When I looked at the EPS chart, I almost choked:
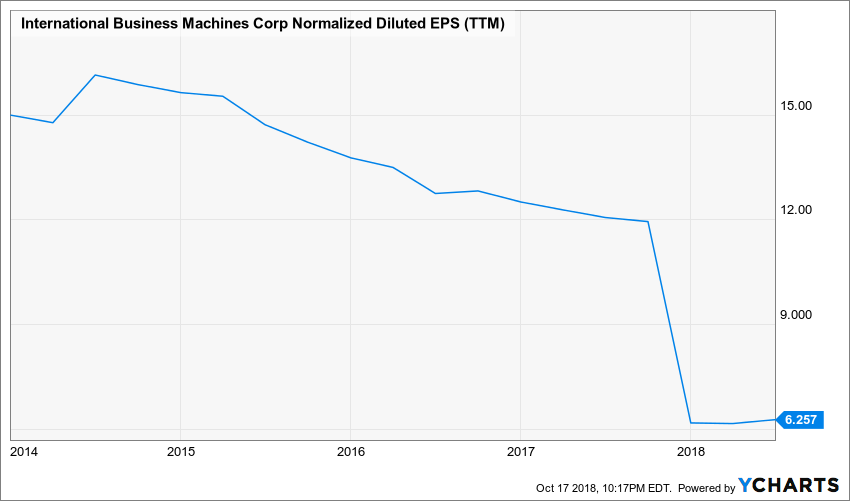
Figure 6.
And with the enormous drop in EPS came a simultaneous enormous jump in the P/E ratio.
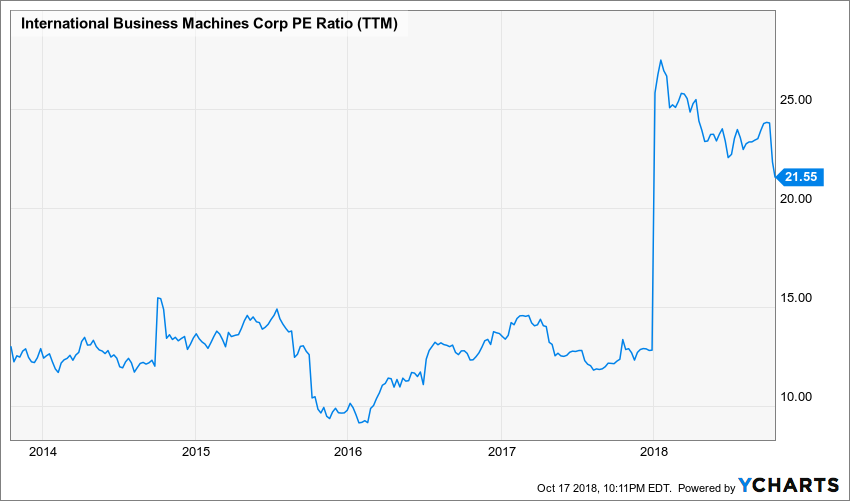
Figure 8.
The huge jumps shown, though, are artifacts of the change in tax regulations at the end of 2017. Comparing Net Income to Cash From Operations shows that the increased tax charge (caused by the lessening of value of IBM’s deferred tax assets) was non-economic (in the sense that it was a non-cash charge that did not affect the cash flow of the firm).
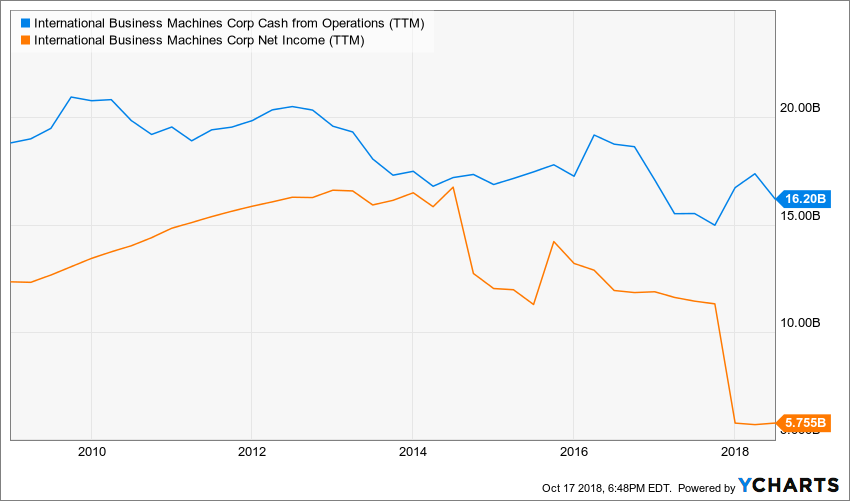
Figure 9.
That said, even the Cash From Operations shows about a 20% drop from the company’s peak. Remember, though, that IBM has been buying back shares. When CFO is divided by shares outstanding, the picture does not look too bad.
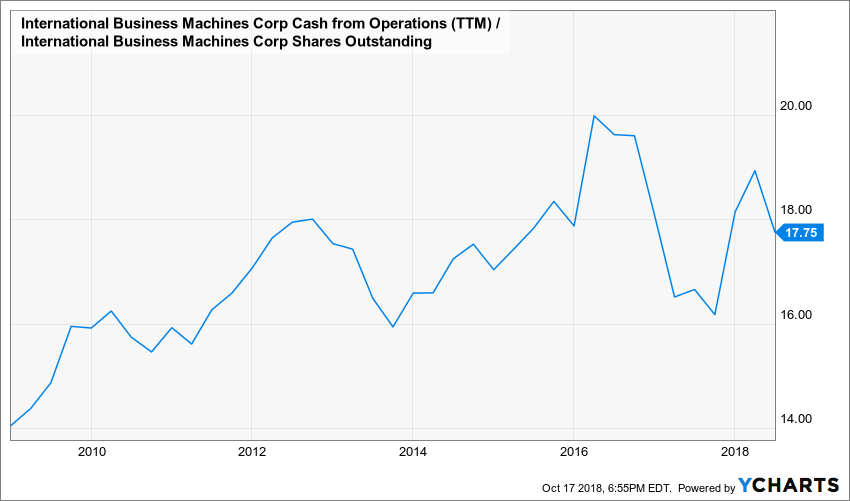
Figure 10.
If we average out the values from 2016 to the present (i.e., remove the hump and subsequent trough), it looks as though Cash from Operations / share has held steady.
“Holding steady” is not a great catalyst for capital appreciation in most cases, but it is clear that the company is at least generating a good amount cash from its business, the top-line of which has been shrinking for several years (see figure 3 above).
Steady profits with declining revenues suggests that the efficiency at which IBM converts revenues to profits is increasing. Also, the lowered share count and the generally upward-trending Cash from Operations per share suggest that owners’ positions have improved over the past few years.
To sum up, when looked at from a straight earnings perspective – whether viewed through the lens of EPS or P/E ratio – it looks as if there is something truly broken with IBM’s business model. To me, looking at IBM from a cash generation perspective, it looks like it is doing fine.
The biggest short-term threat I see to IBM is the uncertainty regarding the 22% of 3Q18 revenues generated by the Cognitive Solutions segment. Theoretically this business has enormous operating leverage, but if the technology is not helping its clients solve business problems, the segment’s revenue growth will be tepid.
While IBM’s revenue growth has been in line with my forecasts, I know that most people in the market are hoping for IBM’s sales to return to consistent growth. Until it does, investing in IBM may seem frustrating.