GE announced second quarter earnings Friday morning and looking through the numbers, we see some encouraging things on the top-line but think that profitability may come in close to our worst-case assumptions.
We have written extensively about General Electric and recently posted several Tear Sheets regarding bullish investments (levered long, bond replacement) in the company.
The comments here compare GE’s actual results to our operational projections for the current year.
Revenues
The firm’s Industrials business generated $54.1 billion during the first half of 2017, compared to $54.5 billion during the first half of last year – a decline of 80 basis points. The firm’s Finance business generated $5.1 billion of revenues during 1H17, compared to $5.7 billion in the same period last year, a decline of 9%. These figures were all adversely affected by currency fluctuations.
General Electric usually generates most of its Industrials business in the second half of the year, as shown in this chart.
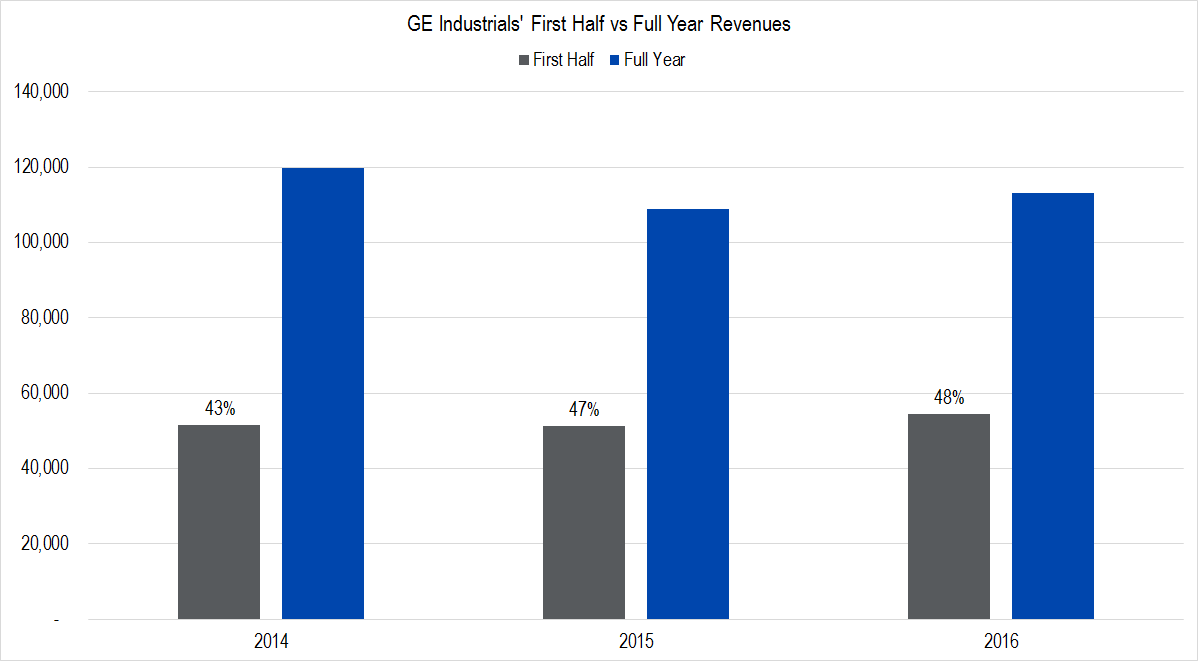
Figure 1. Source: Company Statements, Framework Investing Analysis. Percentages shown above gray columns indicate the amount of revenues generated during the first half compared to the full year
General Electric’s Finance business has generated 51% and 52% of its revenues in the first half of 2015 and 2016, respectively. These are the only two clean datapoints we have due to the divestment of the consumer-facing finance operations in 2015-2016.
If we assume that these seasonal patterns will repeat in 2017, we estimate that full year revenues for the firm will range from around $123.5 billion to around $127.3 billion, a 0% and 3% change from 2016, respectively.
This range agrees with, and is a bit tighter than, our present worst- and best-case revenue projections for 2017 of $122.5 billion and $129.9 billion respectively.
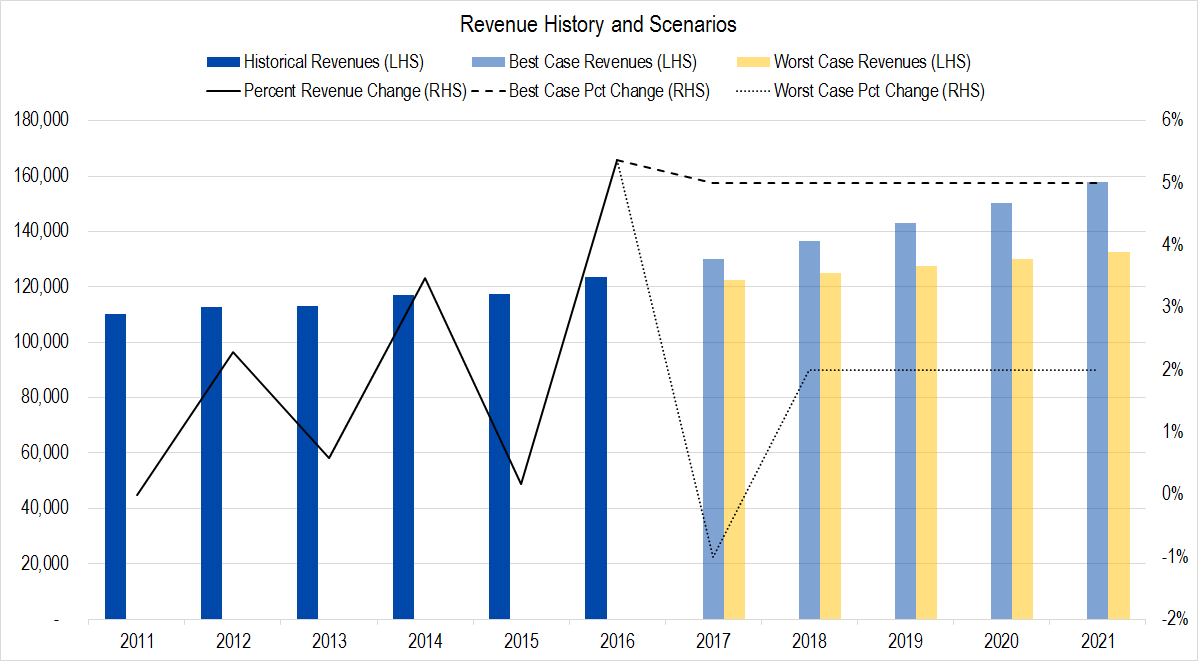
Figure 2. Source: Company Statements, Framework Investing Analysis
During the conference call, the managers said that while Oil & Gas revenues have been weak this year, the firm had a strong order book and was confident of a strong second half of the year for the Industrials businesses overall.
Another comment during the call stood out to me regarding GE’s transportation business (railroad locomotives), whose revenues were also weak during 1H17.
$GE‘s notes on US rail Renaissance (re bearish $UNP position) pic.twitter.com/kN0dMhSFpM
— EW Kobayashi-Solomon (@Framework_Erik) July 22, 2017
This tweet suggested two things to me. First, that it has not been my imagination that Union Pacific has battened down the hatches in terms of investment spending – there is “very little investment appetite” to quote Immelt.
Also, just below the quote shown, there was a comment that made me wonder if GE might be considering selling the transportation business. While there are some synergies between GE’s Transportation, Oil & Gas, and Power businesses with respect to engine design, manufacturing, and end markets, the main chunk of this business – designing and maintaining railroad locomotives – is essentially a stand-alone operation.
With the largest market share in the North American market (Caterpillar is a distant second place), GE Transportation would make an attractive carve-out or fetch a good price if sold. It is also presently the smallest of any of GE’s business lines by revenue, and revenue growth for the division is likely to be tepid. We can’t help but wonder if incoming CEO, John Flannery, might let this business go.
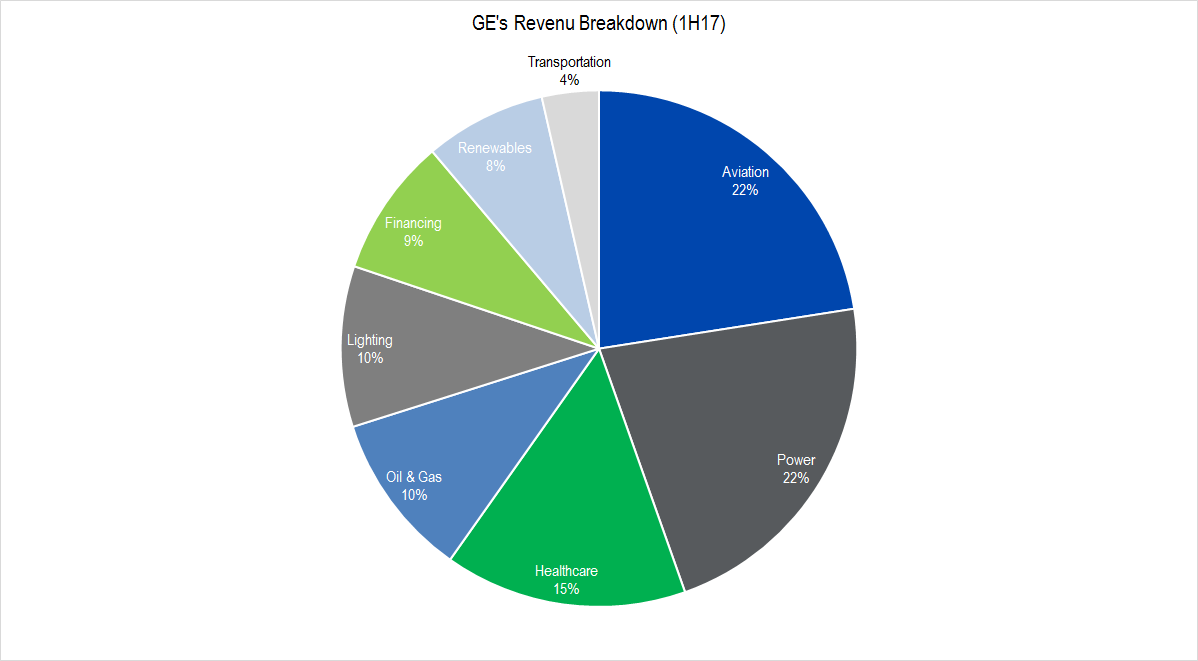
Figure 3. Source: Company Statements, Framework Investing Analysis. A part of the Lighting business will be shifted to the Power business later this year and we think Lighting also has a good chance of being divested
You can say that you heard it first here when and if the sale / spin-off of GE’s Transportation business actually happens.
Profits
As we have discussed in prior articles, understanding the changes to GE’s normalized cash flow is complicated by the company’s divestments over the past few years, especially the carving out of GE’s consumer-facing credit business.
From the information provided in the earnings announcement, Cash Flow from Operations during the first half of the year looked light, but management expressed confidence that it would meet its cash flow guidance for the full year. Maintaining the prior guidance suggests that management is expecting the second half of the year to be much stronger than the first. We looked at prior years to see if this type of seasonality had been evident before.
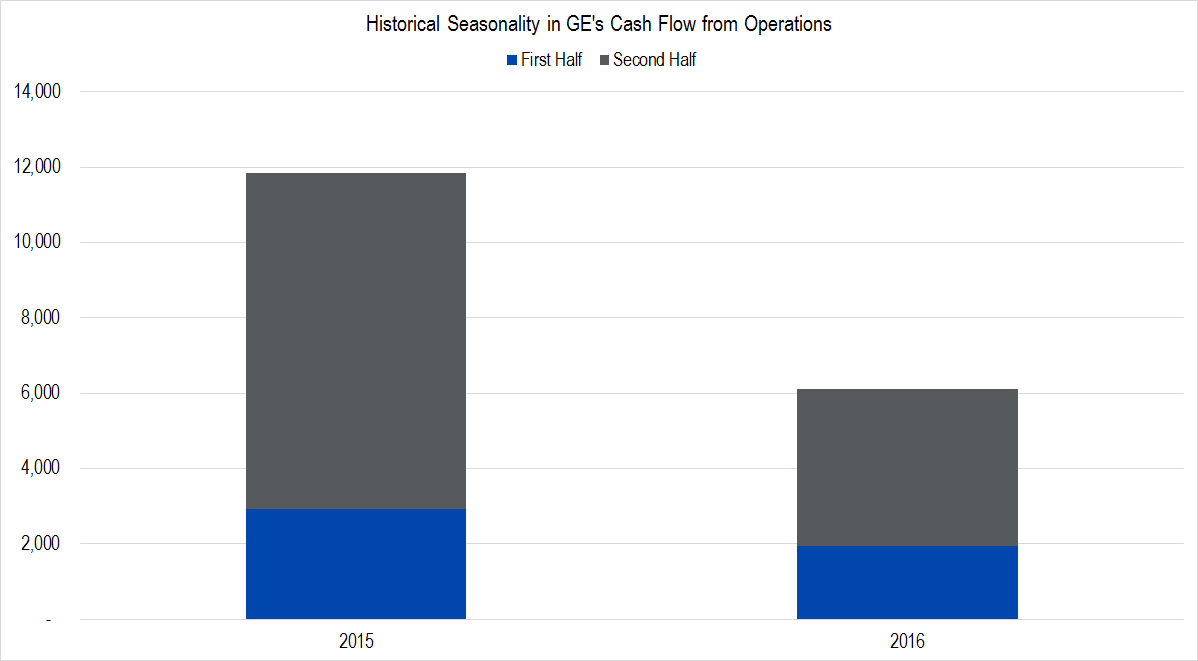
Figure 4. Source: Company Statements, Framework Investing Analysis
In 2015-2016 – the only years for which we believe the financial statements are directly comparable – the second half of the year does seem proportionally much stronger than the first. As such, we do not believe we can reject management’s claims that the firm would meet their cash flow targets for the full year out of hand.
Management did mention that there were roughly $2 billion in cash reorganization charges that had to be taken this year, so actual cash flow generation would likely be closer to the lower end of guidance ($12 – $14 billion for the Industrials business). Considering this, we believe GE’s 2017 Owners’ Cash Profit (OCP) – the cash-based profitability metric we use to assess companies – may also be closer to our worst-case forecast.
That said, if the firm does generate reduced profitability this year due to these one-off charges, it does not mean that the capacity of the firm to generate better profits in the future would be impaired.
As such, we are leaving our forecasts for short-term best- and worst-case profitability for GE unchanged.
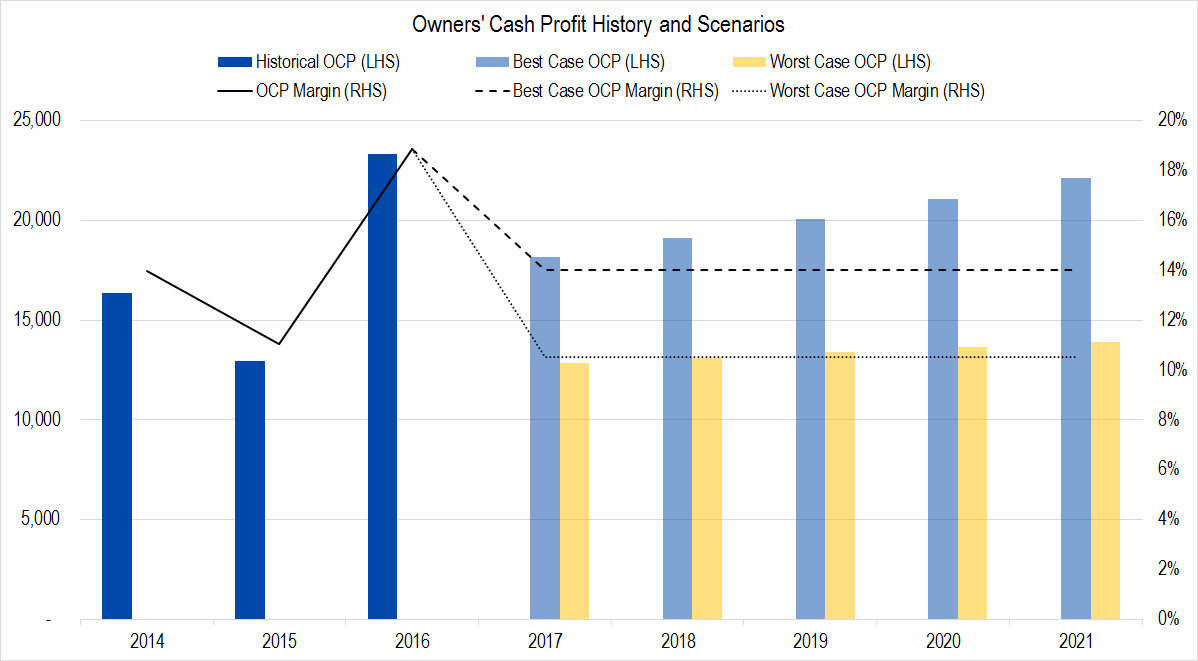
Figure 5. Source: Company Statements, Framework Investing Analysis
For 2017, our OCP range is from $13 billion in the worst-case to $18 billion in the best.
Investments
No company provides enough disclosure in its earnings announcement to accurately calculate Framework’s measure of investment spending: Net Expansionary Cash Flow.
GE’s investment spending is particularly hard to pin down because of several fairly large corporate actions that have been announced for this year. One is the merger of GE’s Oil and Gas Business with Baker Hughes International to form a publicly-listed entity, Baker Hughes BHGE, of which GE shareholders will own somewhat more than 60% of the business. This required an outflow of around $7 billion. This outflow will be partially offset by the sale of GE Water ($3.4 billion inflow) and of GE Industrial Solutions (expected to be an inflow of roughly $3 billion). In addition, earlier in the year, GE acquired Danish firm LM Wind Power for $1.7 billion
Considering all these actions, we believe that our 2017 forecast of ECF as a percentage of OCP of 15% will be in the ballpark of actual spending. This will lead to Free Cash Flow to Owners (FCFO) of from roughly $11 billion to roughly $15 billion.
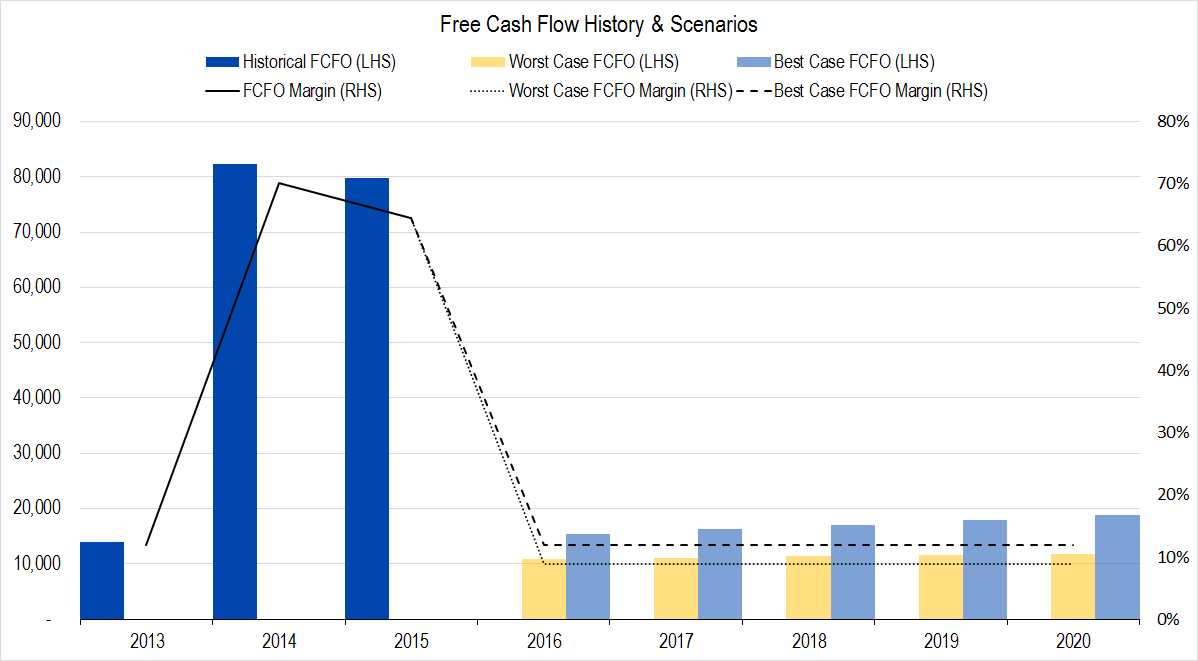
Figure 6. Source: Company Statements, Framework Investing Analysis
Valuation
There is no reason to alter our medium-term growth view based upon two recent quarters of earnings results, so we are leaving these unchanged. 2017 is a difficult year in terms of visibility into the firm’s results, but we happily stand by our earlier GE investment recommendations.
 Loading...