Last week, we did a Five-Minute Valuation of Bristol-Myers Squibb at the request of long-time reader Wilson M. Wilson, who is a Wall Street professional, wanted to go one step further in the analysis, so we started working on an analysis of the pipeline together. He found some sell-side projections for Bristol’s pipeline drugs, and I collected data regarding the history. Here is what we found.
I was surprised when I graphed out Bristol-Myers’s historical revenue breakdown.
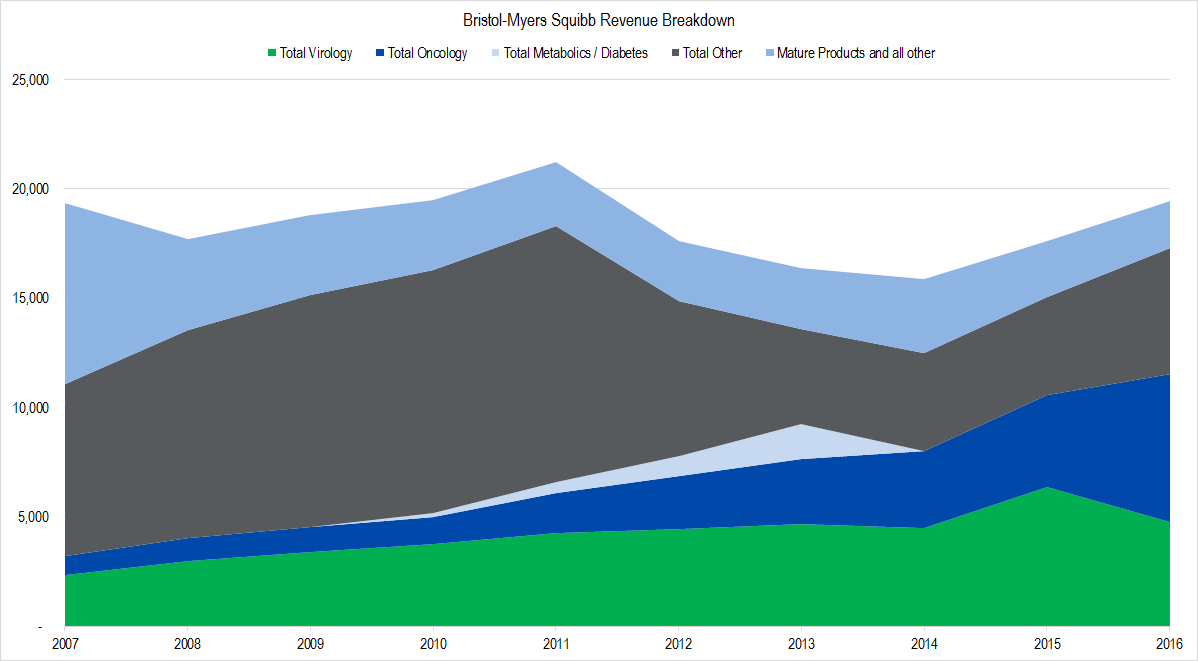
Figure 1. Source: Company Statements, Framework Investing Analysis
The green area represents Bristol-Myers’s drugs treating hepatitis-c and HIV. The dark blue area represents cancer drugs. The gray area is made up of a hodgepodge of things, the most important are cardiovascular drugs. The sliver of very light blue is Bristol-Myers’s aborted diabetes franchise, and the sky-blue region represents all other drugs which the company aggregates without breaking out.
The thing that struck me as I looked at this diagram is what seems to be the inability to extend its franchise in different treatment areas. The gray “other” region is largely driven by Plavix – a blockbuster heart medicine. You can see that Plavix came off of patent in 2012-2013. Only now – five years later – is the company following up with another cardiovascular drug called Eliquis.
Similarly, the largest proportion of 2016 revenues were in the Oncology area – colored dark blue here. We can see that this is a fairly new franchise for Bristol-Myers, having been only a minor proportion of revenues even a few years ago. In addition, its current prominence is due to a single drug – Opdivo.
Compared to a biotech company we did a detailed analysis on – Gilead Sciences GILD – Bristol-Myers’s ability to build on prior success to create a lasting franchise in a given treatment area seems weak.
The sell-side revenue forecasts that Wilson found worked out to show an average growth of 2% – 3% over the next five-year period, depending on the success of some new pipeline drugs. This forecast fits very nicely in between our original best- and worst-case revenue forecasts.
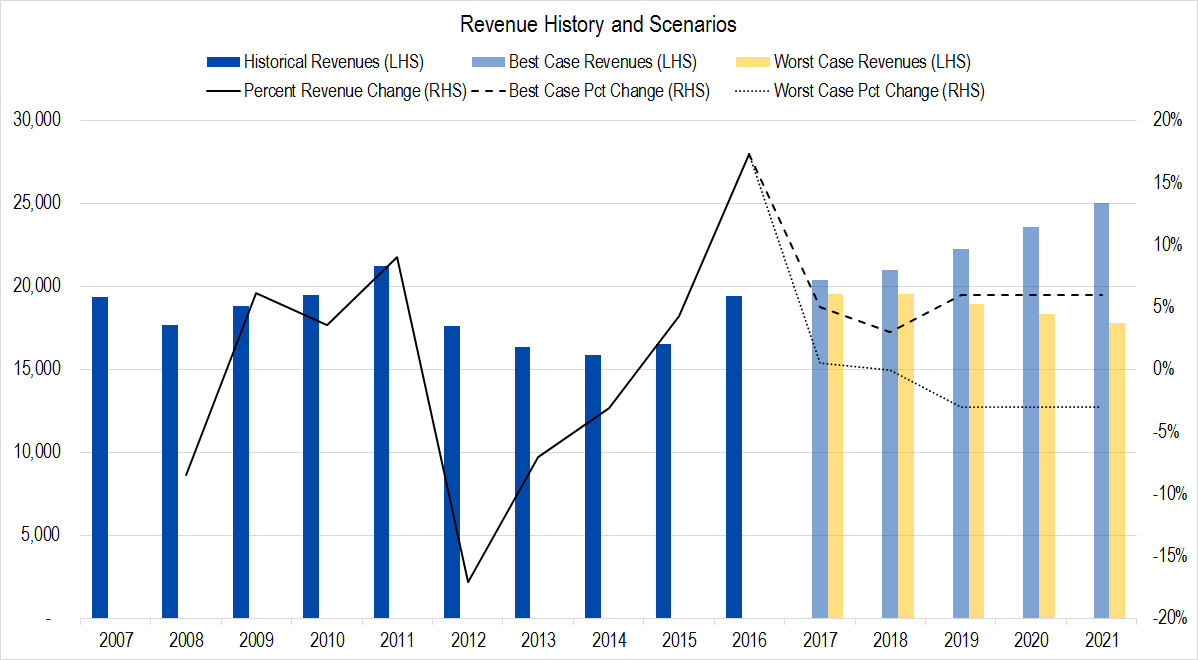
Figure 2. Source: Company Statements, Framework Investing Analysis
While I was working on Bristol-Myers’s revenues, I decided also to do a sanity check on my forecasts for profits and cash flows over the near- and medium-term periods. The thing I noticed here was Bristol-Myers’s profit growth, or lack thereof.
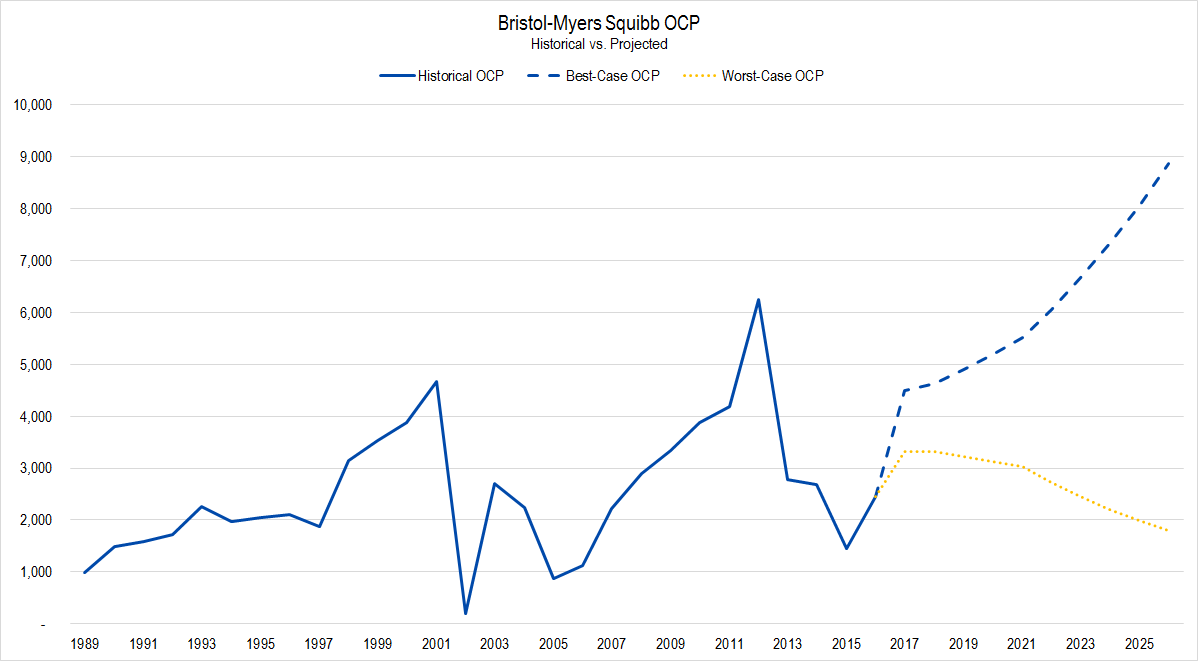
Figure 3. Source: Company Statements, Framework Investing Analysis
In this diagram, you see a very long history for Bristol-Myers’s Owners Cash Profits (OCP), displayed along with our best- and worst-case forecasts over the next 10 years, represented by the dashed blue and dotted yellow lines, respectively.
Note first that, other than two blips – the second of which really is a one-off artifact – the company’s OCP has ranged between $1 billion and $3 billion over this entire period. The portion of history from 2013-2016 would fit just as easily into the graph between years 1996 and 1999, in fact.
This observation further reinforces my impression that the firm’s management is not very good at maintaining and building its business. Considering this point, I would say that the worst-case profit line looks a good deal more plausible than the best-case one does.
Last, I decided to run a sanity check on my assumptions for Free Cash Flow to Owners (FCFO), the metric we ultimately use to value the company.
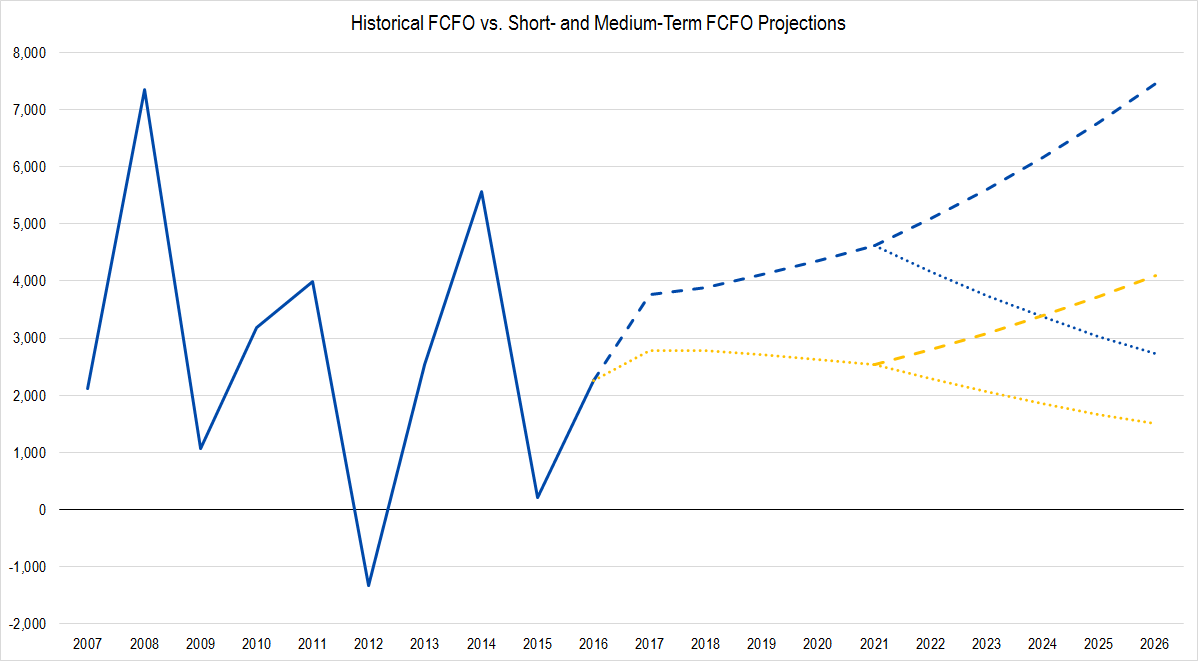
Figure 4. Source: Company Statements, Framework Investing Analysis
In this diagram, Bristol-Myers’s historical FCFO is the solid blue line, our best-case branch over the next 10 years is also represented in blue, and our worst-case branch over the next 10 years, in yellow. Notice that the medium-term best- and worst-case branches overlap. This just means that best-case cash flows in the short-term, coupled with worst-case growth in the medium term ends up to generate a bit worse cash flow in 2026 than worst-case cash flows in the short-term coupled with best-case growth in the medium-term.
While I don’t have a great deal of confidence about which of these scenarios is more likely true, none of them seem unreasonable on the face of it.
One last sanity check is shown in this graph.
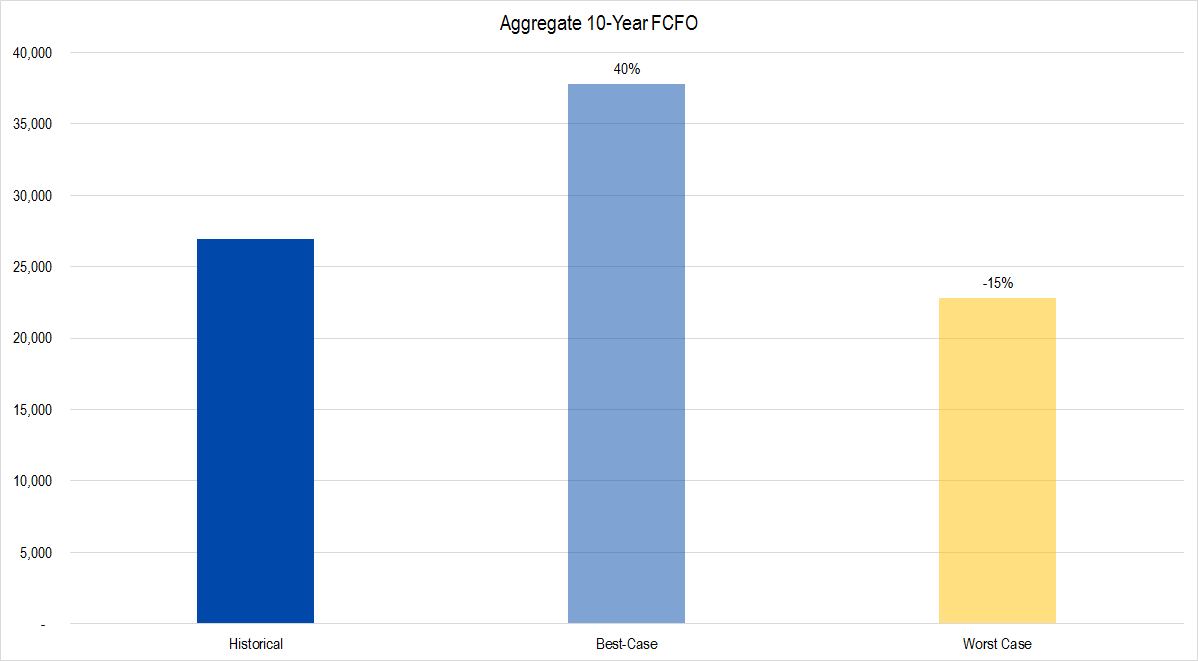
Figure 5. Source: Company Statements, Framework Investing Analysis
Here, I have aggregated the historical Free Cash Flows to Owners over the last 10 years and compared them to my aggregate best- and worst-case projections. Obviously, this is a rough measure, since we are not taking the time value of money into consideration, but it’s not a bad comparison to make, in my opinion.
This tells us that we are forecasting FCFO in the best case to be about 40% greater over the next 10 years than it was over the last. In the worst-case, we are forecasting it to be about 15 percent less.
All things considered, after doing a more careful analysis, I do not see any reason to believe that our original valuation range is too far off base.
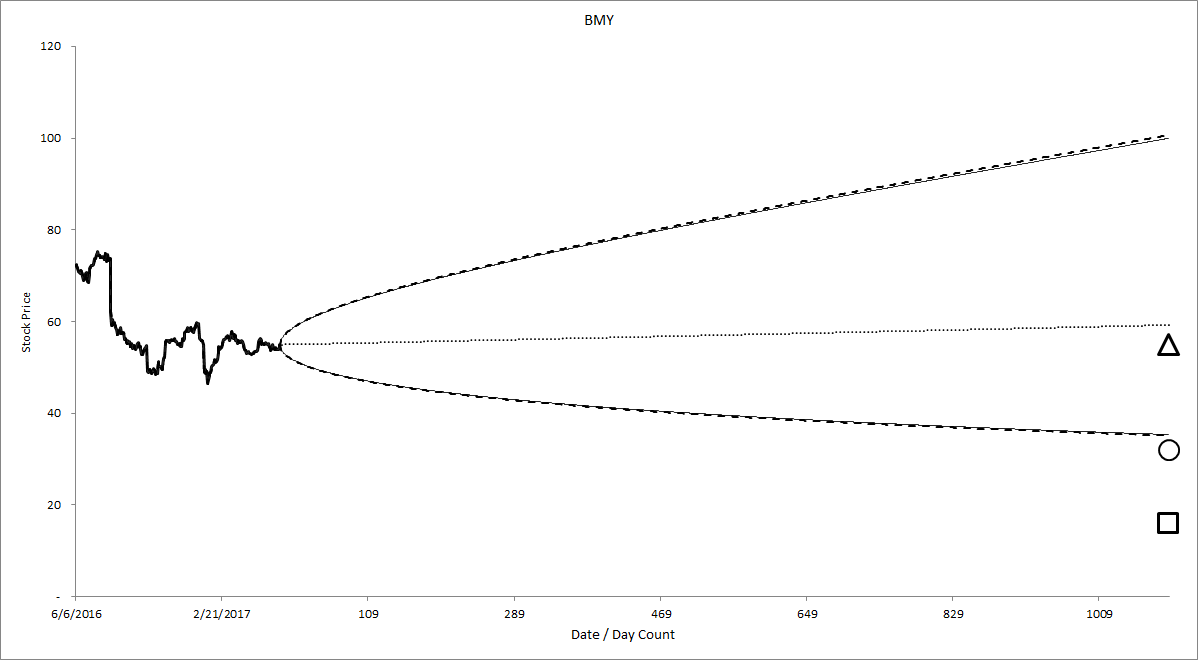
Figure 6. Source: Company Statements, Framework Investing Analysis
This would suggest yet another bearish idea! I will pull together a Tear Sheet and publish it later this week.