
IBM is a business in the midst of a huge transition. It has undergone big transitions several times in its history and has always come out okay, but many investors, Warren Buffett among them, have doubts about IBM’s ability to make it through this time around. We have analyzed and invested in IBM successfully since 2015, and wanted to update our valuation to see if there is again an opportunity to invest.
Our valuation framework focuses in on a handful of fundamental drivers, of which there are only three main ones in the short-term and one related one in the medium-term. We’ll work through each one-by-one.
Revenues
IBM has been divesting old businesses and trying to build new ones in certain areas it calls “Strategic Imperatives.”
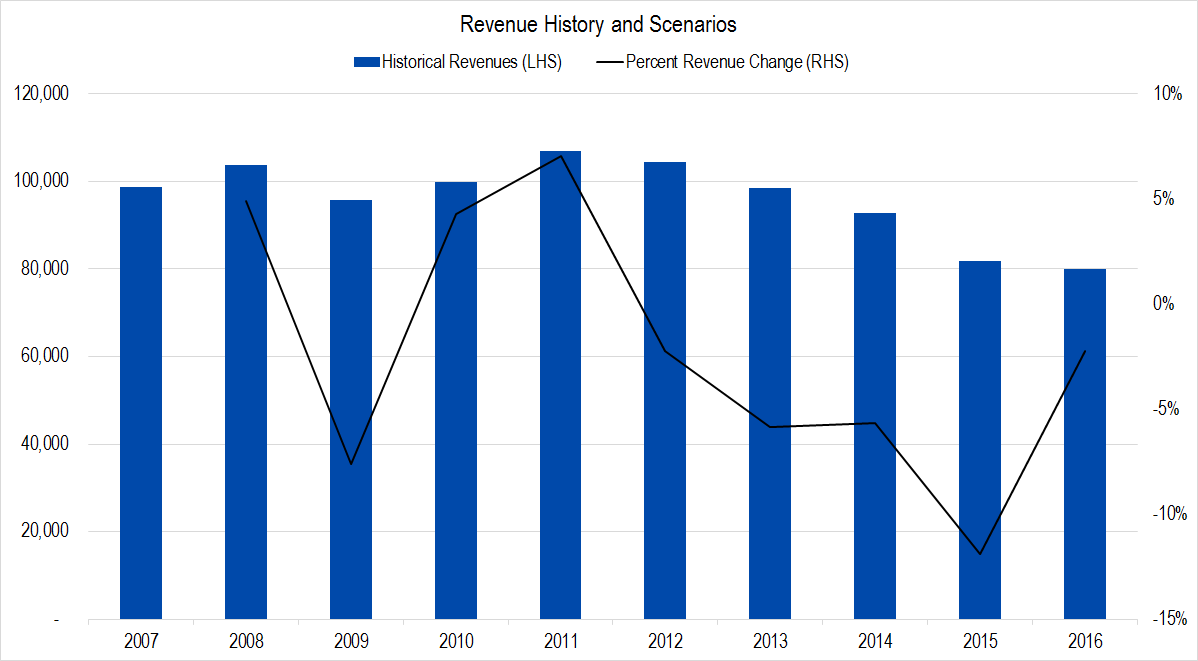
Figure 1. Source: Company Statements, Framework Investing Analysis
This has been a painful process that has seen the company post 20 consecutive quarters of revenue declines. Year-over-Year revenue contraction in fiscal year 2016 was confined to 2%, and several of IBM’s segments actually grew overall, so we may be nearing an inflection point.
Right now, revenues from Strategic Imperatives make up roughly 40% of business and were growing at a rate of around 12% per year at last check. In contrast, the remaining portion of the business is seeing contraction of nearly 10% per year.
Our valuation assumes that these businesses continue on their respective trajectories over the next five years in our best case, generating average growth of 1% per year. In the worst case, we assume Strategic Imperative growth slows to 5% per year and that the remainder of the business continues to contract at 10%. This generates an average contraction of 3% per year.
This is what our graph looks like now – light blue columns being best-case, yellow columns being worst.
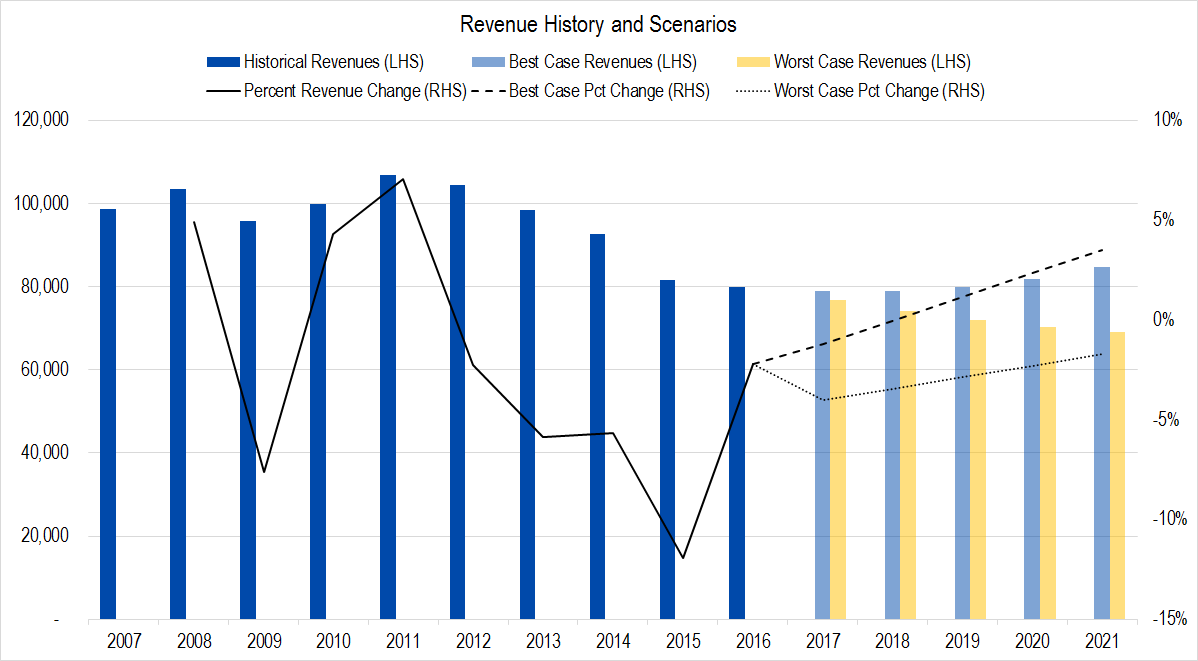
Figure 2. Source: Company Statements, Framework Investing Analysis
Profits
Our preferred metric is called Owners’ Cash Profits – OCP – which is based on the firm’s cash flows.
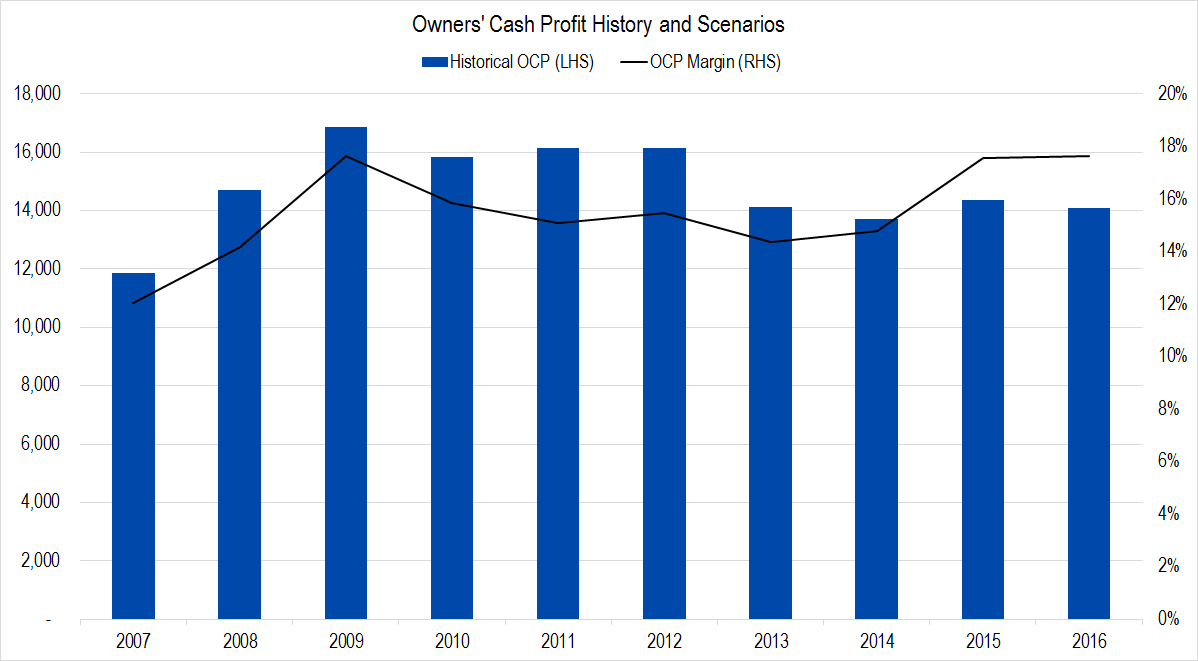
Figure 3. Source: Company Statements, Framework Investing Analysis
While IBM’s revenue has been dropping, its profits have been stable since 2013, and over the last two years, profit margins have increased. We forecast average best-case profitability of 17% OCP margin and worst-case of 15%. Making the change in our model creates a graph like this.
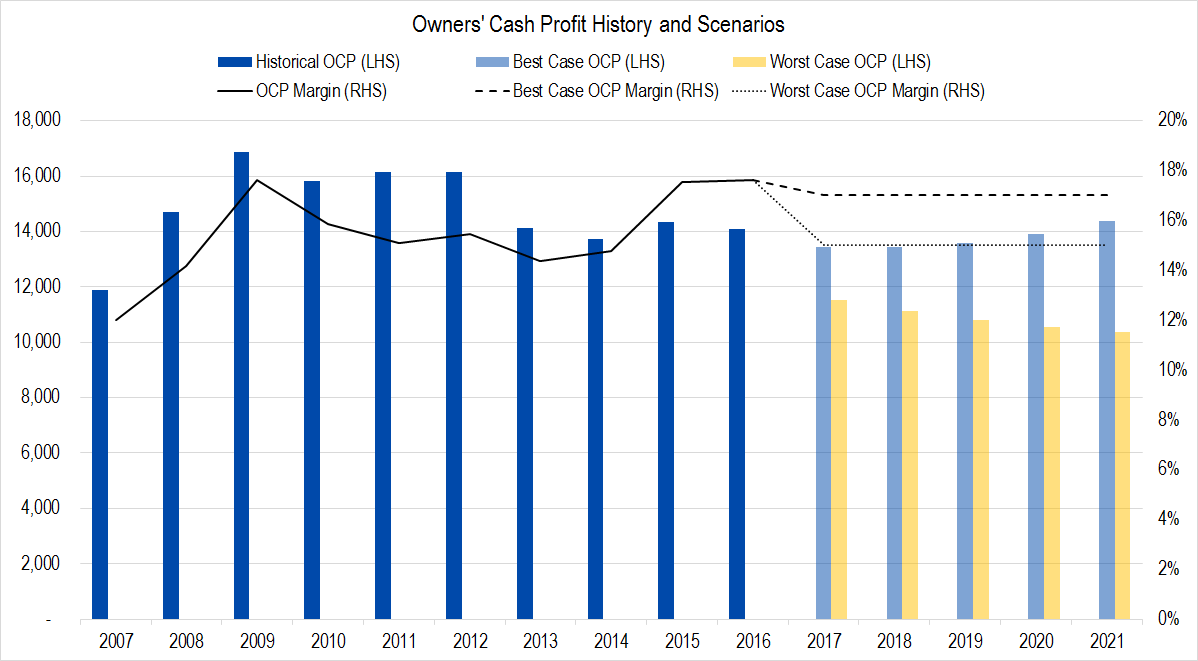
Figure 4. Source: Company Statements, Framework Investing Analysis
Investment Spending
In this graph, the wide gray columns represent Owners’ Cash Profits generated by the firm and the blue columns, the amount the company spent on investments. IBM has been making acquisitions in the field of cloud computing and data mining, and we think will spend roughly one-quarter of its profits on investments going forward.
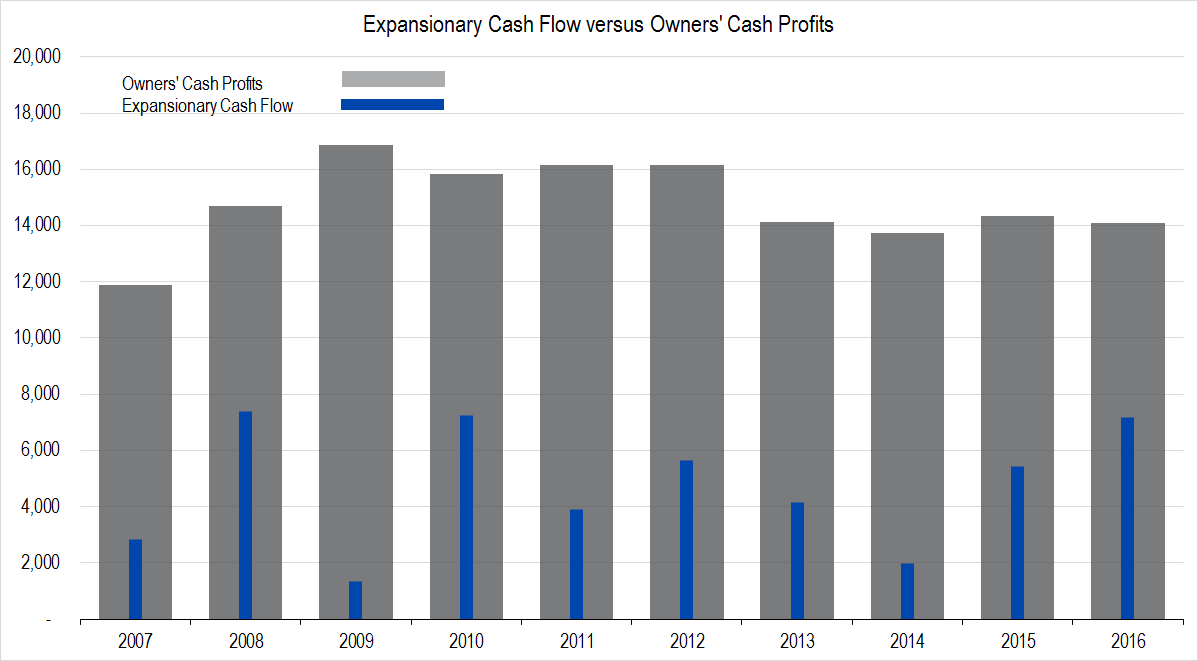
Figure 5. Source: Company Statements, Framework Investing Analysis
With this assumed investment level, we figure IBM will be generating between $0.11 and $0.13 of Free Cash Flow to Owners (FCFO) for every dollar in revenues generated over the next five years.
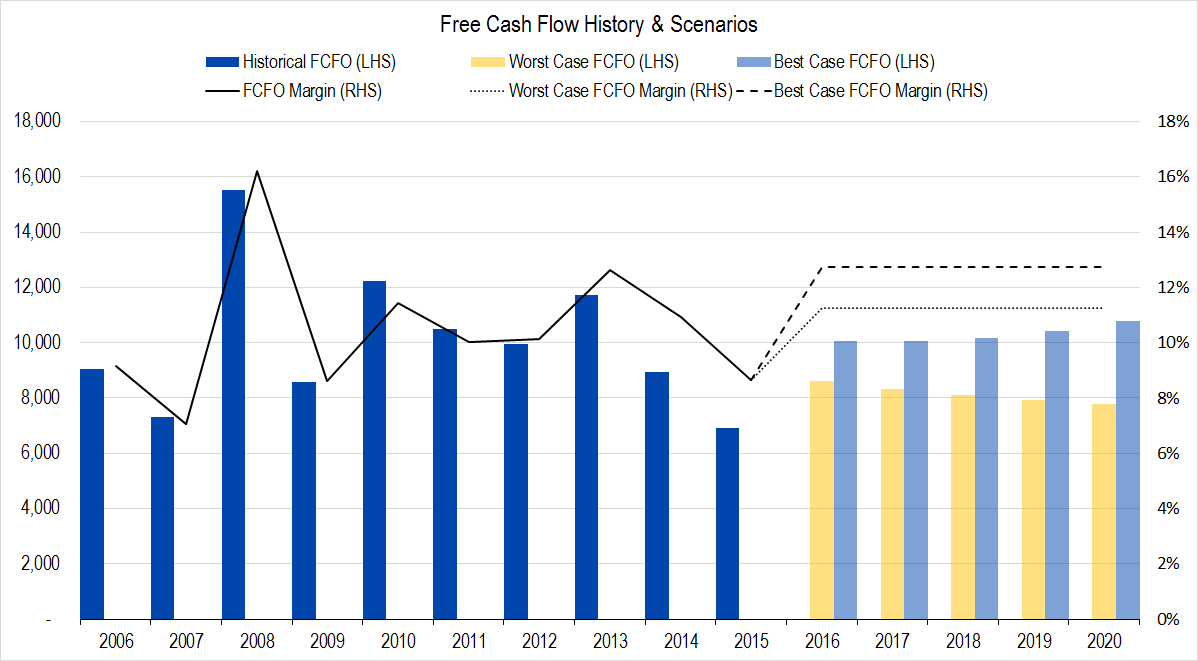
Figure 6. Source: Company Statements, Framework Investing Analysis
Medium-Term Growth
IBM operates in a hyper-competitive field, but it has very long client relationships and an interesting, distinctive offering. We are forecasting medium-term cash flow growth of 7% per year in the best case and 5% per year in the worst.
Valuation
Pulling this all together gives us a best-case valuation of $209 and a worst-case valuation of $143 per share with an equal weighting of all our eight valuation scenarios at $174 per share.
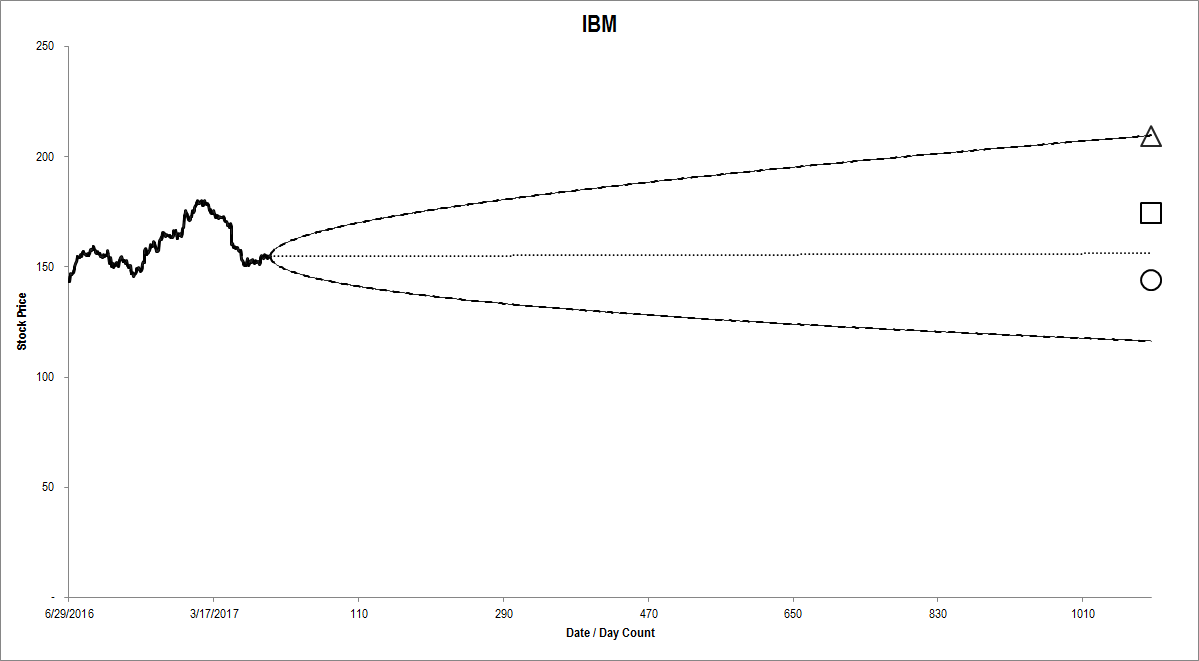
Figure 7. Source: Company Statements, Framework Investing Analysis
The option market’s best-case price projection is roughly in-line with our best-case valuation scenario, but has a much more negative worst-case price projection than our worst-case valuation scenario. This implies that the market is paying too much for downside insurance on IBM, and I am always happy to sell frightened investors overpriced insurance by selling covered calls or cash-secured puts.
In this case, we gained more premium by writing a covered call – that is, buying the stock and selling an At-the-Money call option – than we would have by selling a cash-secured put, so recommended that strategy. Our Effective Buy Price works out to be less than $150 per share and, if we realize the full amount of the premium, will generate income at an annualized rate of 15%.