
You can discuss Disney with other members on the Framework Forum.
Transcript
Last month, we published a valuation of Disney at the request of one of our members. Since then, the company has released its fiscal year 2017 statement, so we refreshed our model using the updated data and tweaked some of our valuation driver assumptions.
Our valuation framework focuses in on a handful of fundamental drivers, of which there are only three main ones in the short-term and one related one in the medium-term. We’ll work through each one-by-one.
Revenues
Despite the deep consumer recession in 2008-2009, Disney has done a good job of increasing its revenues over the last 10 years, with sales growing from $38 billion in 2008 to about $55 billion in 2017 – a compound annual growth rate of around 4%. On this graph, the absolute value of the revenues is shown by the blue columns and read off the left-hand scale and the year-over-year change is marked by the black line and read off the right-hand scale. Most of the firm’s recent growth has been thanks to hit movies from Disney’s acquired Lucasfilm, Pixar, and Marvel properties, as well as solid revenues from its domestic parks. The drop-off in 2017 is mainly due to tough comparisons after an outstanding few years of revenue growth.
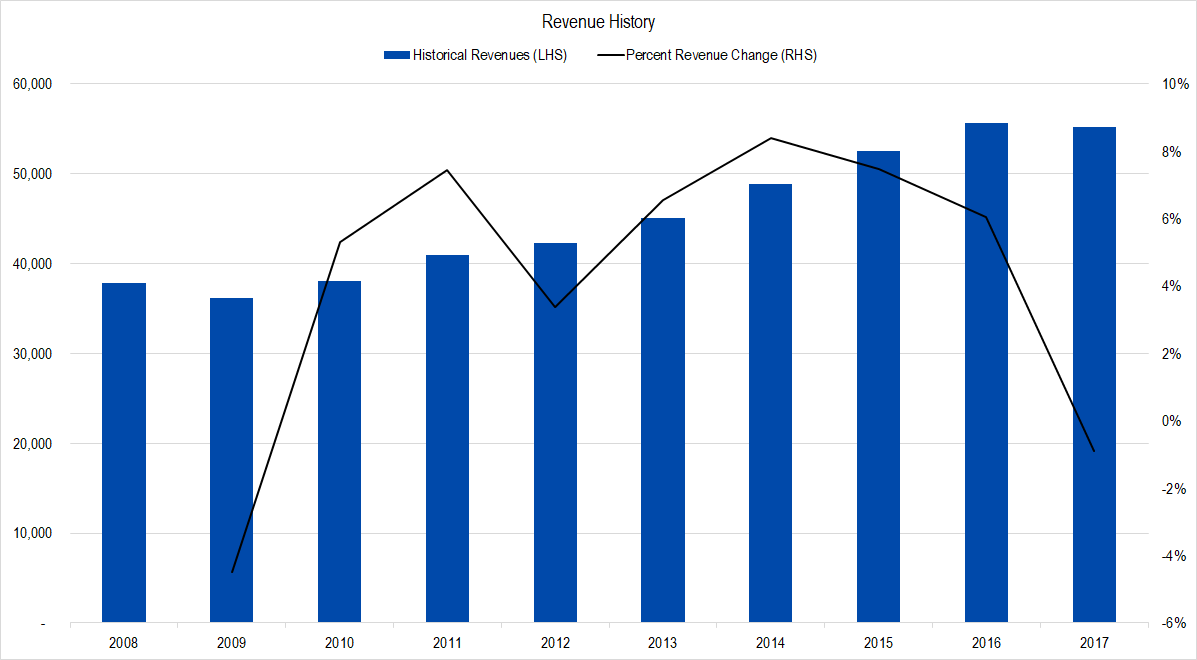
Figure 1. Source: Company Statements, Framework Investing Analysis
We are using a best-case revenue growth scenario averaging a little over 8% per year over the next five years This scenario – marked by the light blue columns and dashed line – assumes that the firm is successful in creating demand through its new ESPN streaming service, that it can keep churning out mega-blockbusters in its studio division, and that growth in its parks remain brisk.
Our worst-case revenue growth scenario – an average of 3% per year over the next five years assumes some combination of adverse conditions – movies not selling well, Millennials continuing to be disinterested in watching sports or the price of park admission finally getting so high that people decide on another type of family vacation. These worst-case assumptions are different from the ones we published last month after further review of the studio business’s history.
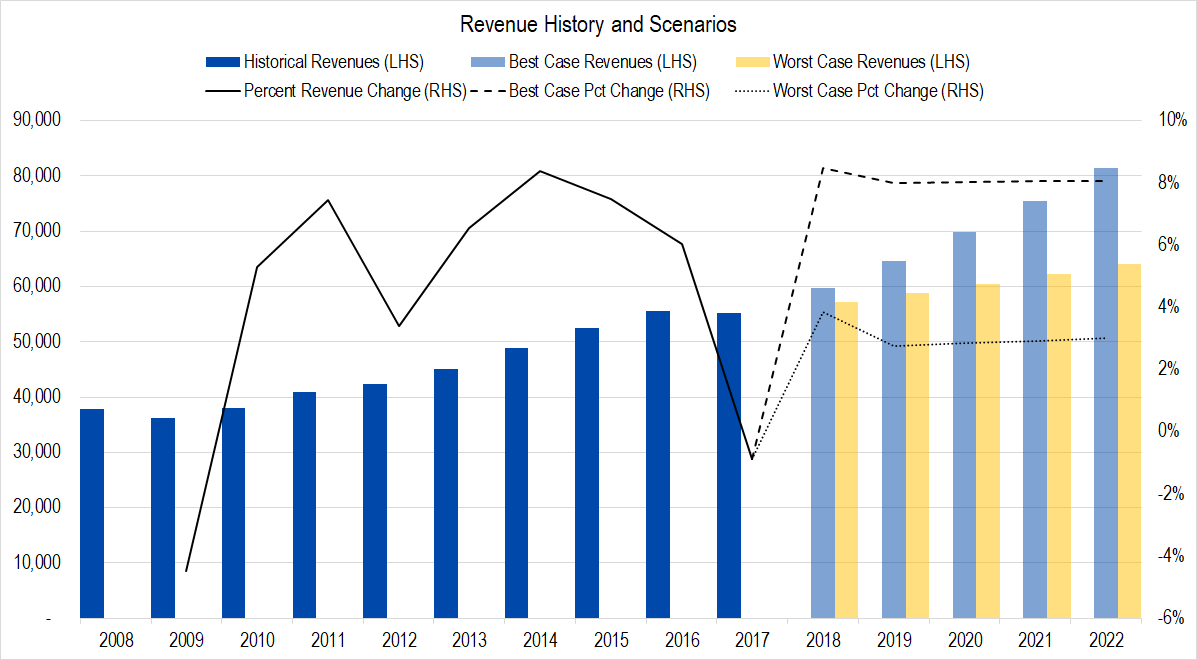
Figure 2. Source: Company Statements, Framework Investing Analysis
Profits
Our preferred metric is called Owners’ Cash Profits – OCP – which is based on the firm’s cash flows.
Disney’s OCP margin had fluctuated from around 9% to around 13% during the first few years of Iger’s tenure.
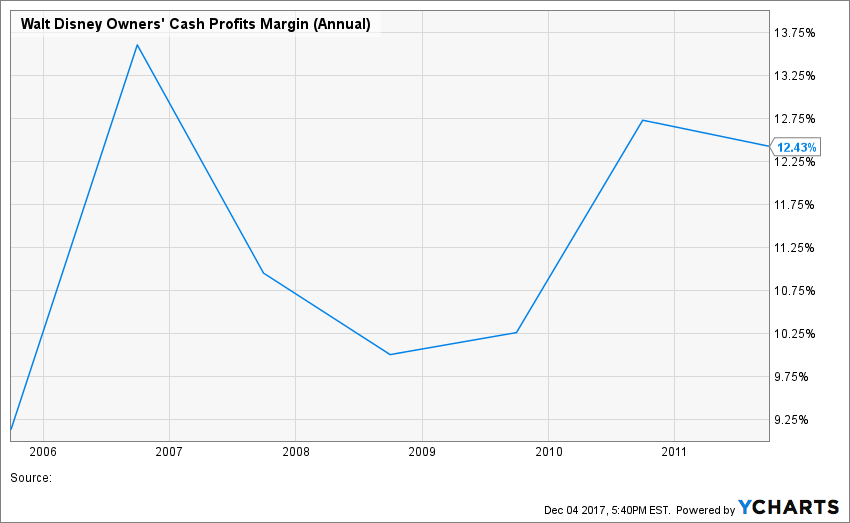
Figure 3. Source as noted
In 2010, Disney acquired Marvel and profits started to inch up. In 2013, Disney acquired the Star Wars franchise and boosted profits yet again. We believe that Disney’s excess profitability hinges largely on its ability to continue producing hit films.
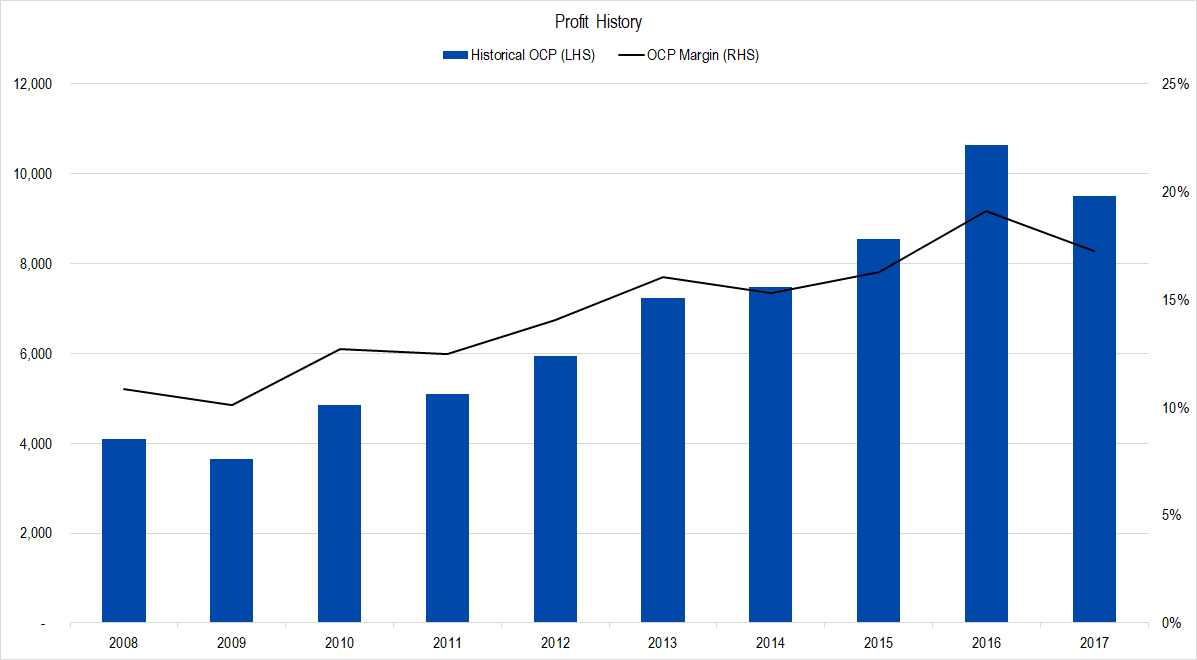
Figure 4. Source: Company Statements, Framework Investing Analysis
Our best-case OCP margin scenario – 17% on an average for the next five years – equals the trailing five-year average profitability. Our worst-case OCP margin scenario – 15% on an average for the next five years – equals the average of all prior five-year averages in our history.
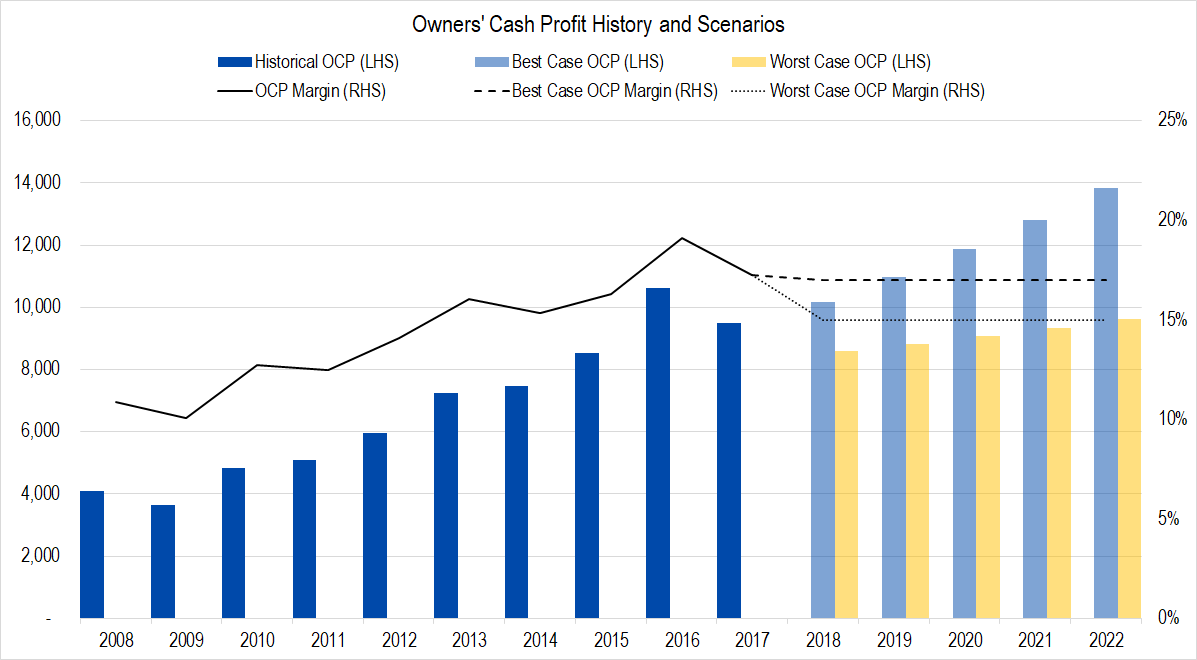
Figure 5. Source: Company Statements, Framework Investing Analysis
Investment Spending
The wide gray columns in this graph represent Owners’ Cash Profits generated by the firm and the blue columns, the amount the company spent on its investments. Over the past 10 years, Disney has spent on an average 40% of its profits on investments. Even taking a longer look back at average spending since 2001, we find the firm spent a total of 44% of its profits on all investments including acquisitions, and 36% of its profits if acquisitions were excluded. We have given Disney the benefit of the doubt and assumed that it can continue to grow quickly while only spending 35% of its profits on investments.
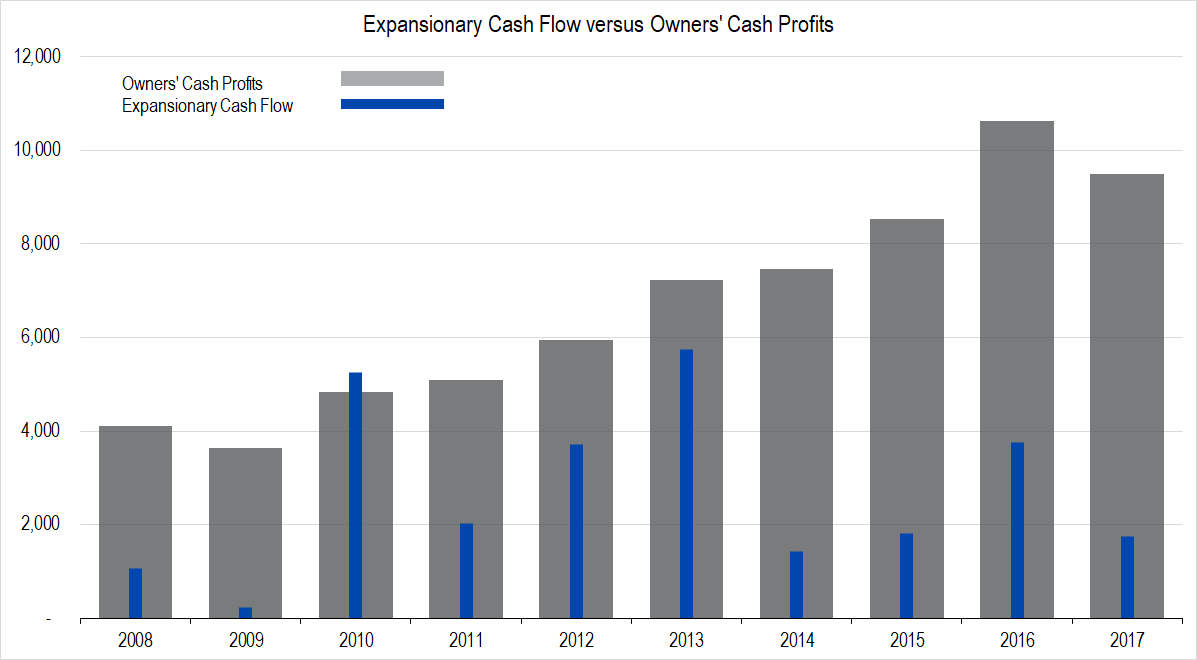
Figure 6. Source: Company Statements, Framework Investing Analysis
With this assumed investment level, we figure out that Disney will be generating from $0.10 to $0.11 of Free Cash Flow to Owners (FCFO) for every dollar in revenues generated over the next five years.
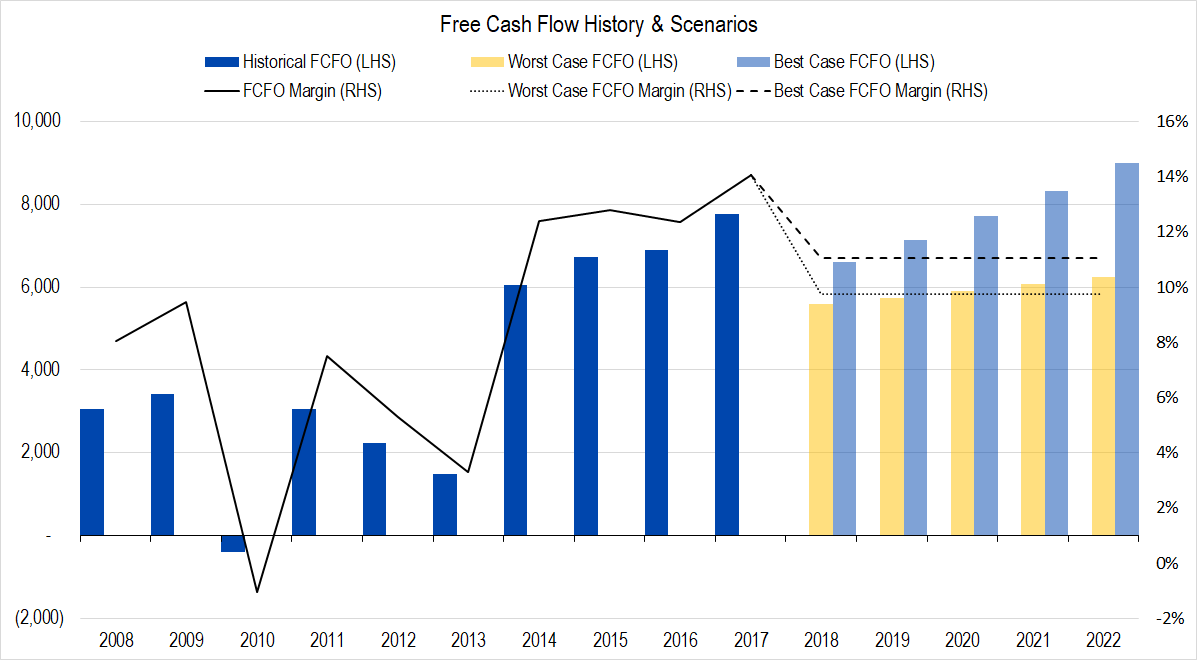
Figure 7. Source: Company Statements, Framework Investing Analysis
Medium-Term Growth
Disney has been very successful at growing its profits and cash flows over the last 10 years, and we again give it the benefit of the doubt and assume that, best-case, it can continue growing significantly faster than the economy at large during the medium-term – a rate of 9% per year. In the worst-case, we suppose it will be able to match GDP growth, which we assume to be 5% nominal. Our model considers the medium-term period as starting in 2023 and running for five years.
Valuation
Pulling this all together gives us a best-case valuation of $110 and a worst-case valuation of $67 per share with an equal weighting of all our eight valuation scenarios at $87 per share.
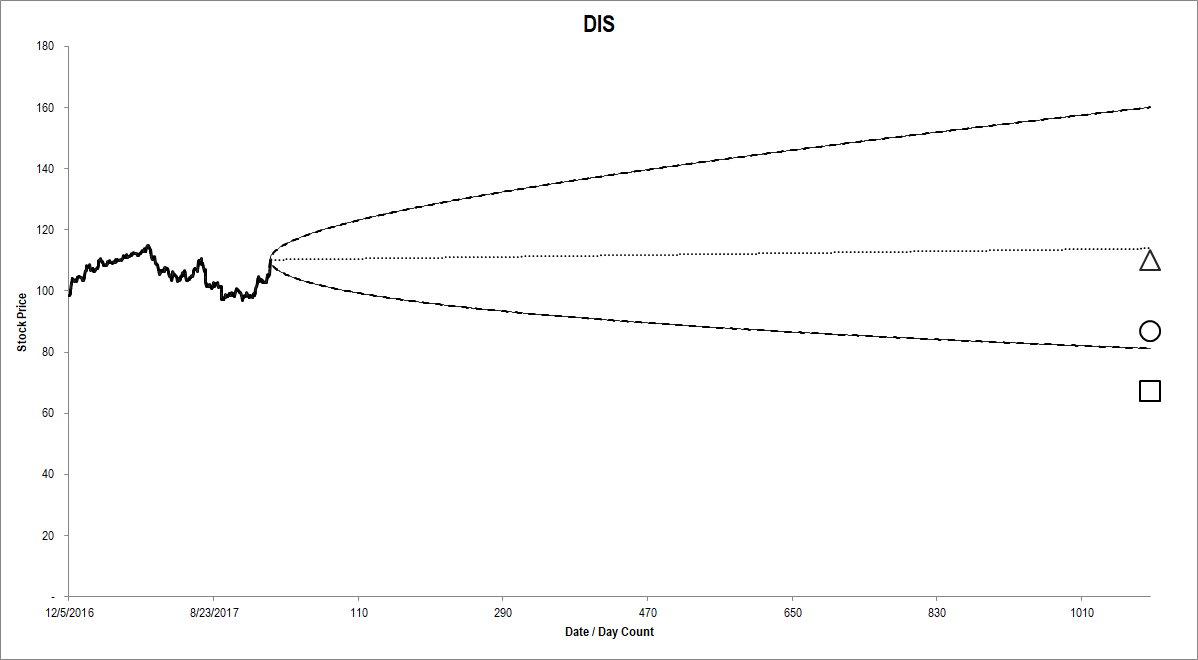
Figure 8. Source: Company Statements, Framework Investing Analysis
In comparison, the option market’s best-case price projection three years out is $160 per share, its worst-case is $81 per share, and its most-likely price is around $114 per share.
This is a large discrepancy and suggests that Disney is just at the verge of being overvalued. However, note that Disney pays a high effective tax rate, so if the Congressional tax plan passes, all things held equal, the firm’s fair value range should be shifted up by some amount. We will reassess Disney’s value after the tax legislation is finalized.