
Earlier this year, several of our members got interested in sportswear firm Under Armour UAA. We spent time discussing the valuation as a group, and while the group hasn’t come to an agreement on valuation yet, I thought I would take a quick look. This is a five-minute summary, so this valuation range might change as we sharpen our pencils.
Our valuation framework focuses in on a handful of fundamental drivers, of which there are only three main ones in the short-term and one related one in the medium-term. We’ll work through each one-by-one.
Revenues
Under Armour burst onto the scene in the 1990s selling what was then a revolutionary type of sweat-wicking clothing.
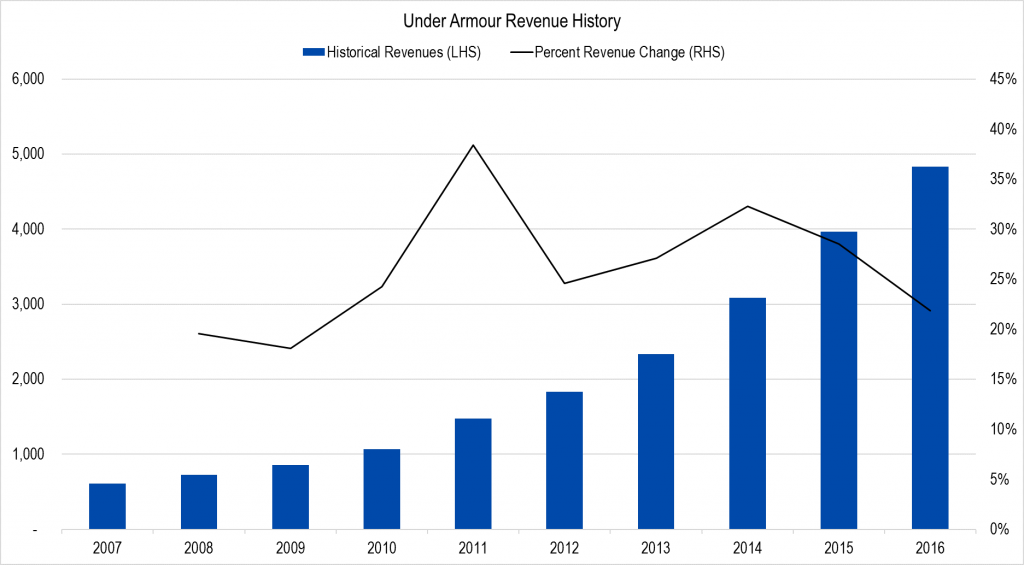
Figure 1. Source: Company Statements, Framework Investing Analysis
In this graph, we can see from the black line showing revenue growth rate that other than two soft years in 2008 and 2009, Under Armour’s year-over-year revenue growth has consistently been above 20%. The picture is more complicated though – domestic sales are slowing and a big fall-off in the first quarter of this year caused the stock to tank:
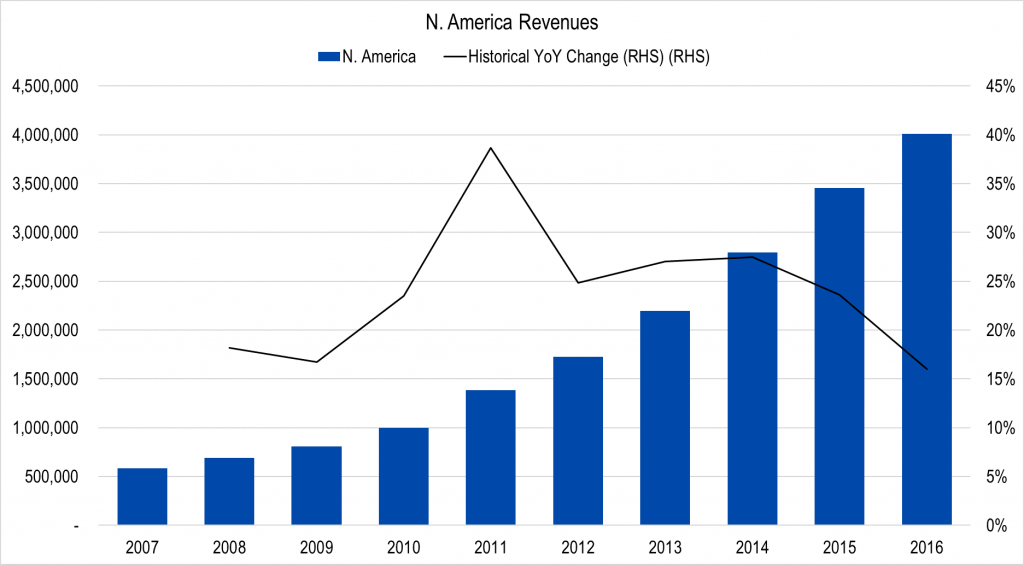
Figure 2. Source: Company Statements, Framework Investing Analysis
While International sales are still brisk – in the 60% range – driven by China and the Far East:
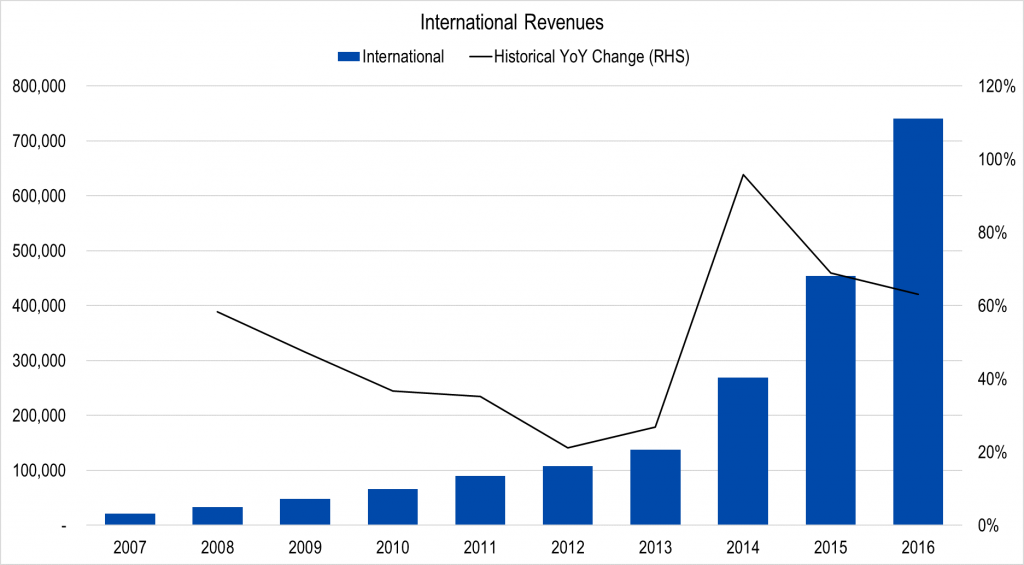
Figure 3. Source: Company Statements, Framework Investing Analysis
As a group, we analyzed domestic and international markets and came up with scenarios of average revenue growth of 22% in the best-case and 12% per year in the worst.
This is what our graph looks like now – light blue columns being best-case, yellow columns being worst.
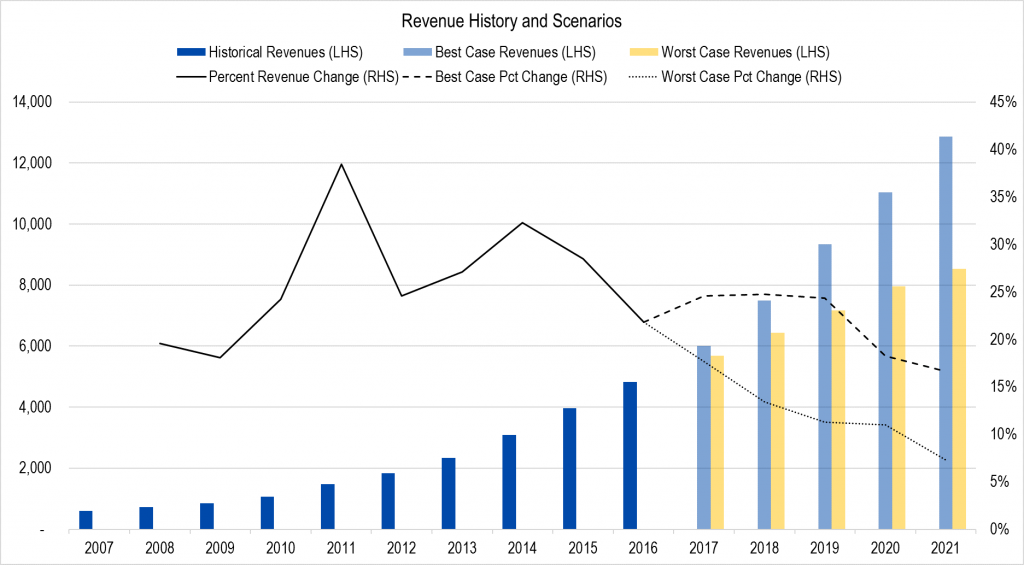
Figure 4. Source: Company Statements, Framework Investing Analysis
Profits
Our preferred metric is called Owners’ Cash Profits – OCP – which is based on the firm’s cash flows.
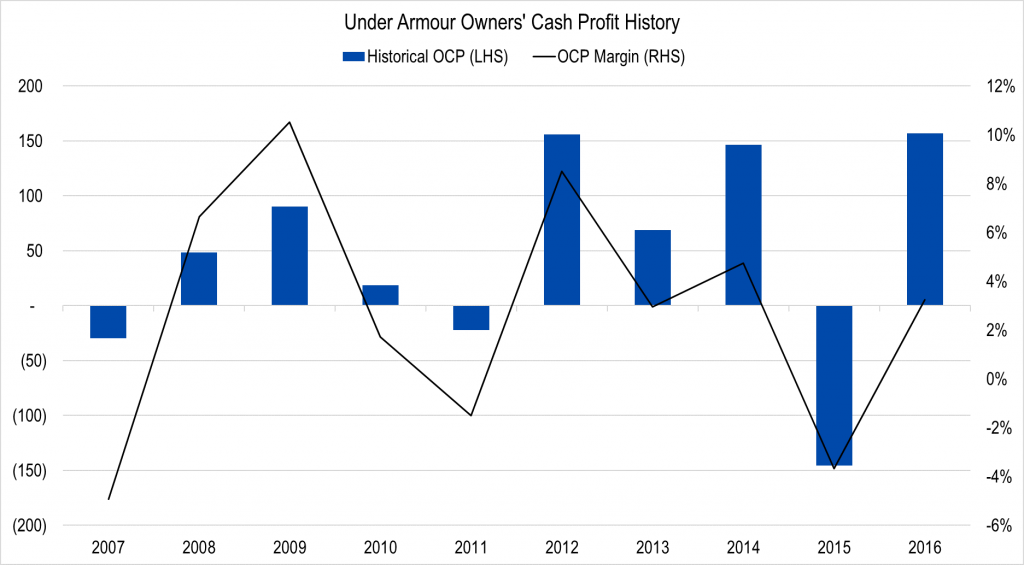
Figure 5. Source: Company Statements, Framework Investing Analysis
This is a new company, so the profitability fluctuates more than a more mature one, but the average OCP margin – the black line – is 3% and usually falls between about 2% and about 8%. Looking at Under Armour’s much larger competitor, Nike NKE, we see that average OCP margins over the last 10 years have been in the 7% to 10% range most of the time.
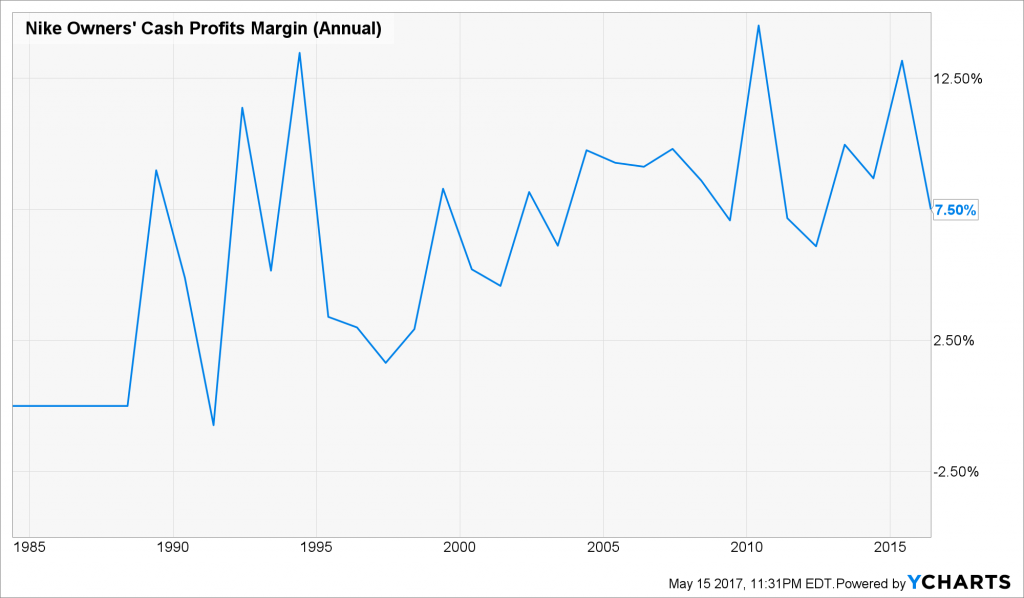
Figure 6. Source: YCharts
I’m going to give Under Armour the benefit of the doubt and assume it can generate stable profits closer to Nike over the next five years of between 5% and 8%. Making the change in our model creates a graph like this.
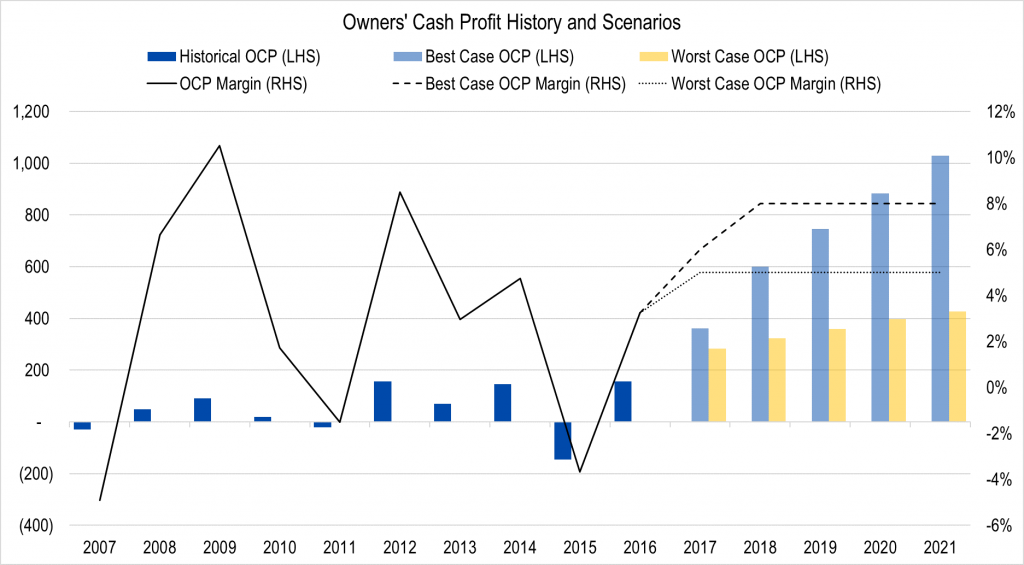
Figure 7. Source: Company Statements, Framework Investing Analysis
Investment Spending
Nike spends only a small amount on investments, but Under Armour is still growing so must pay a much larger proportion of profits on investments – well over 100% on average.
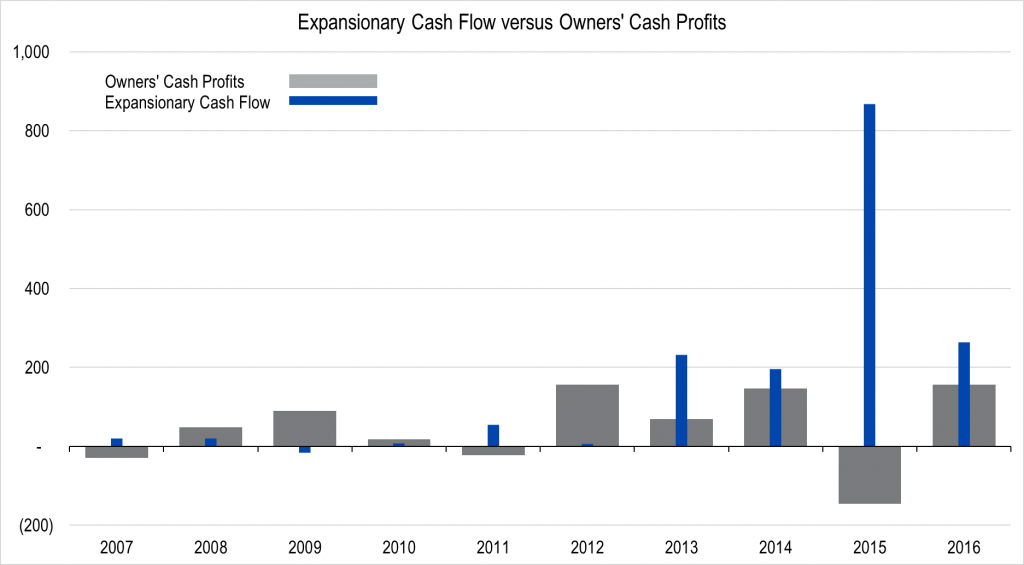
Figure 8. Source: Company Statements, Framework Investing Analysis
Even if we assume that the company reduces investment spending from 100% of profits to 25% of profits five years from now, we think the company can only generate from $0.04 to $0.06 of Free Cash Flow to Owners (FCFO) for every dollar of revenues in the fifth year of our forecast.
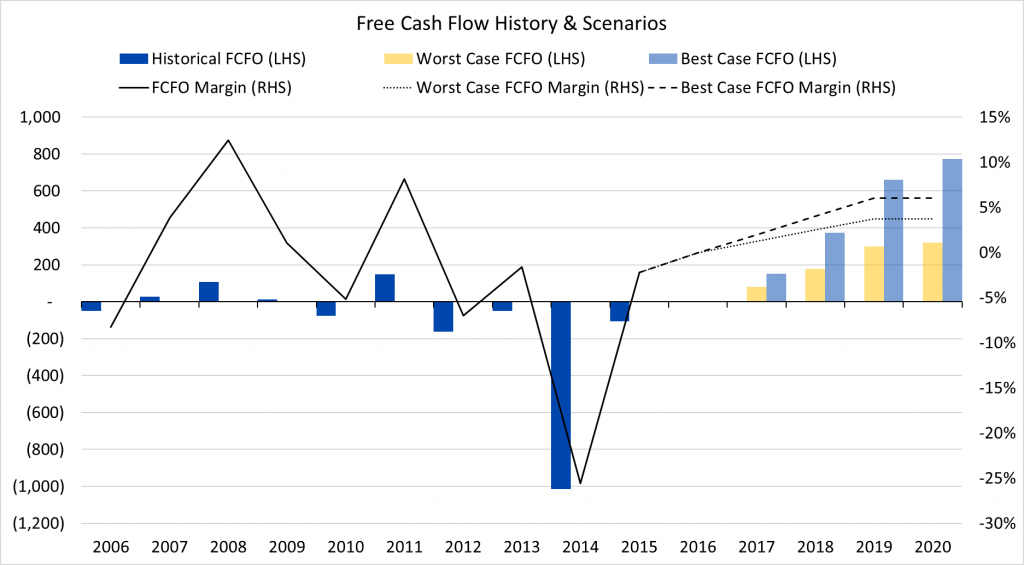
Figure 9. Source: Company Statements, Framework Investing Analysis
Medium-Term Growth
This is a small company with rapidly-expanding virgin markets in Asia. Companies like this often have very long periods of abnormally high growth as they increase profitability and spend proportionally less of these profits on investments. For Under Armour, we’re using 10 years as an assumption for how long this company will be able to keep up better-than-market growth. How fast can it grow? The global industry as a whole is growing at around 4% per year, and we are assuming 12% medium-term growth in the best-case and 5% in the worst.
Valuation
Pulling this all together gives us a best-case valuation of $43 and a worst-case valuation of $10 per share with an equal weighting of all our eight valuation scenarios at $23 per share.
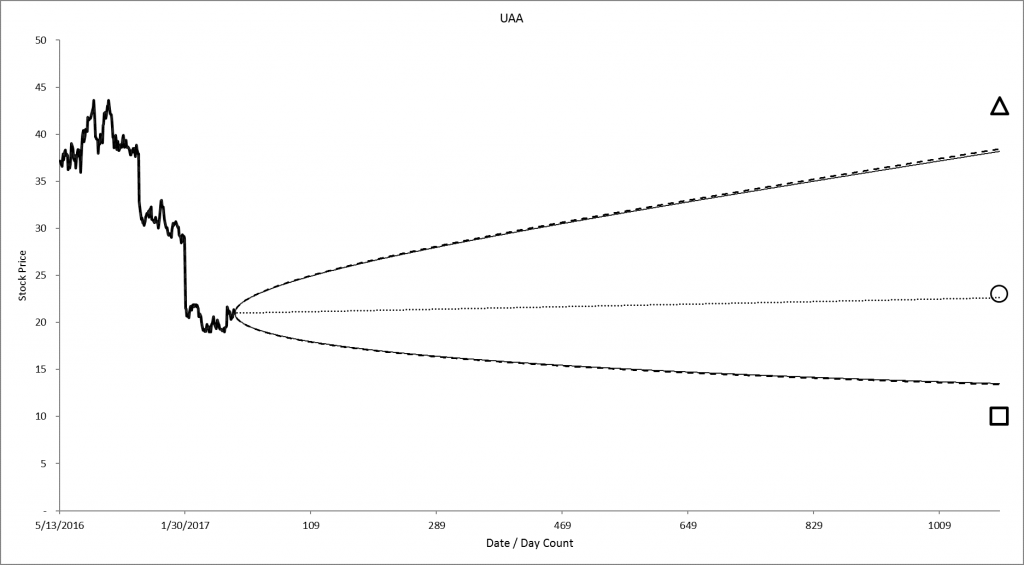
Figure 10. Source: Company Statements, Framework Investing Analysis
Comparing this to what the option market is forecasting, we see that both our worst-, best-, and most-likely case valuations are all nearly overlapping the price forecasts of the option market. Further analysis could reveal an opportunity here, but from this valuation, there doesn’t look like a lot of juice in that orange.
To make a firmer valuation I would want to understand two main things:
- How long can Under Armour continue to grow in the Far East? We might be able to look at Nike as a comparable here.
- How long will the large investment spending be necessary?
One behavioral bias we should be careful to avoid is called the Availability Bias. In Under Armour’s case, the competitor that comes most easily to mind is Nike, which is a big success. However, we should remember that in this business, which is driven heavily by perception and fads, there are also failures like LA Gear, which went bankrupt in the late-90s after taking the world by storm at first.
Resources