I spent a lot of time trying to understand profitability dynamics at Kroger when I was preparing our recent IOI Tear Sheet on Kroger ![]() . I turned up a few interesting things which I’ll expound upon in a ChartBook on Kroger next week, but in the meantime, I thought I would share this graphic, which I found particularly striking. It shows the long-run gross margin and Owners’ Cash Profit (OCP) margin for Kroger since 1990.
. I turned up a few interesting things which I’ll expound upon in a ChartBook on Kroger next week, but in the meantime, I thought I would share this graphic, which I found particularly striking. It shows the long-run gross margin and Owners’ Cash Profit (OCP) margin for Kroger since 1990.
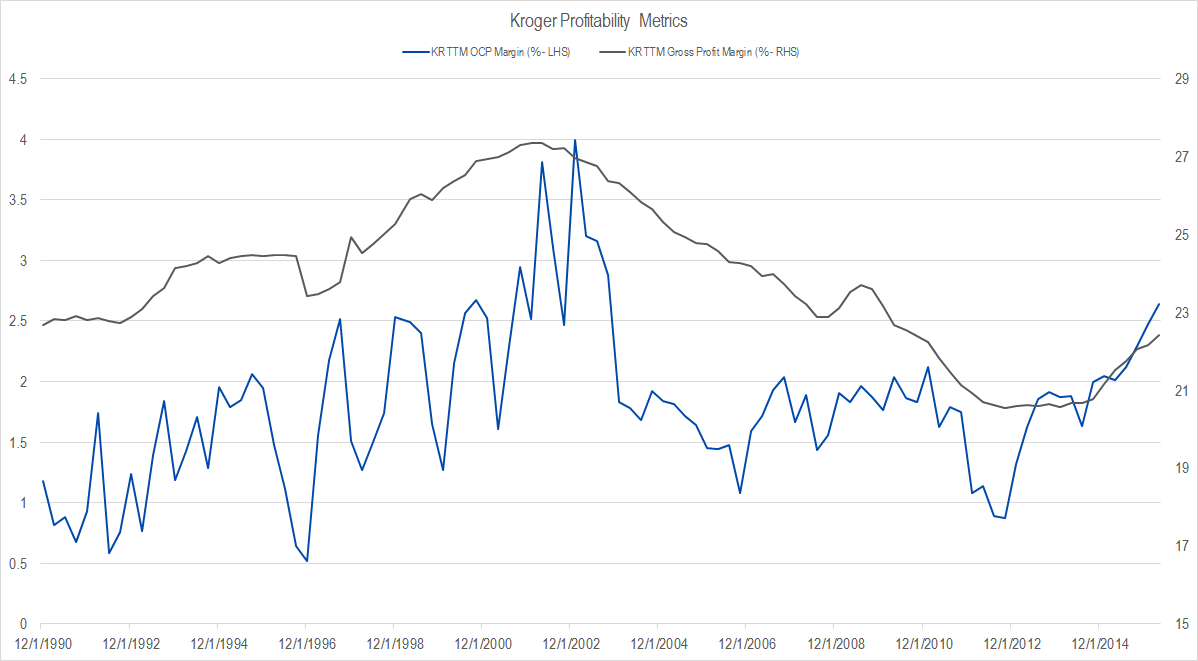
Figure 1. Source: YCharts (data), IOI Analysis
Supermarkets in particular and retailing in general is a surprisingly interesting field that is undergoing an enormous transformation. We’ve got a good discussion about this in the IOI Forums, so take a look there. Also, Joe did a great job of giving an overview of the grocery business in a post last week.