Last week, I published a Small Cap Diary brief for CorEnergy Infrastructure Trust CORR, a REIT specializing in energy infrastructure assets that is generating a dividend yield of around 9% at its present stock price.
I started digging into the financials over the weekend to pull together a model, but was left with questions, so today reached out to the company’s investor relations team. My main questions revolved around operational data that I was having trouble following and what looked like warning signs in the per-share data.
Operational Data
When I looked at CorEnergy’s financials originally, I had so much trouble figuring out changes to the statements as I went back in time that I had thrown out all the operational data prior to 2013. Share counts did not match up and earlier statements were very different from later ones.
It turns out that CorEnergy’s first full year as a REIT was 2013; before that time, it was essentially an energy infrastructure investment fund. You will be able to pull stock prices for CorEnergy for 10 years or so, but before 2013, the company’s business model was different and the financial statements are not directly comparable.
Because of these changes, the models posted here only go back to 2013.
Per-Share Calculations
With REITs, I have become used to looking at dividend discount models (DDM) to value companies on a per-share basis since analyzing Realty Income several months ago.
When I calculated per-share amounts for CorEnergy and looked at the results, I realized that the company was paying out more in dividends than I saw the firm generating in cash-based profits as measured by Owners’ Cash Profits (OCP).
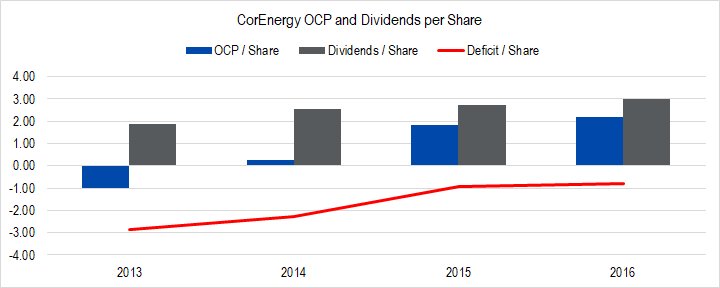
Figure 1. Source: Company Statements, Framework Investing Analysis
I suspected that my assumptions for maintenance capital expenditures – based on the company’s total depreciation and amortization expense – was too high, but because of the nature of the company, wanted to get that clear in my mind.
Like option contracts, the value of the fields in which CorEnergy owns and leases out assets to energy producers diminishes over time. Once all the oil and gas has been fracked out of a certain field, no one will need the fracking waste water storage assets that CorEnergy might own, for instance.
In the case of Realty Income, if Walgreens decides not to renew a lease for a certain corner store, Realty Income can be reasonably assured that it can rent the space to another tenant. Because CorEnergy’s clients’ fields lose value over time, the same thing cannot be said for CorEnergy.
As such, if the accounting charge for total depreciation and amortization on CorEnergy’s books represented a real decrease in the value of the assets the company owned, the fact that the firm pays out a dividend greater than its OCP is worrisome. It suggests that the company is tapping capital markets to pay its current dividend owners dividends – borrowing from Peter to pay a dividend to Paul, in other words.
When I posed this question to the investor relations director, she said that CorEnergy based dividend payments on a common REIT measure Adjusted Funds From Operations (AFFO). AFFO essentially starts with accounting earnings and adds back non-cash charges, including depreciation and amortization. The company targets dividend payouts such that AFFO is roughly 1.4-1.5 times higher, providing a cushion of one-third of the AFFO to pay down debt or invest in new assets.
This cushion seems sensible, but I much prefer OCP as a measure of profitability than AFFO, as the latter implicitly assumes that assets never deplete or wear out. I will need to analyze the AFFO / OCP difference more and will probably need to contact the company again to get any closer to a firm valuation.
For those of you interested in CorEnergy, here are the two Framework models; the DCF model has all of the company’s investment expenses filled out and the DDM is a per-share model looking only at dividends.