Most people – professional analysts included – make a lot of mistakes when they try to value a company. Some of these mistakes have their roots in behavioral biases (see this article about the End of History Illusion), other mistakes are “structural” (confusing a multiples-based target price with a true valuation), yet others have to do with the theoretical tools people use (see this article entitled Why ROIC is Stupid).
One of the most elemental mistakes a person can make is by trying to value a company using the wrong number.
The assumption underlying modern financial theory is that the value of an asset is the cash flows that the asset can generate on behalf of its owners over the asset’s economic life. Most fundamental analysts estimate the amount of cash generated using a statistic called “Free Cash Flow”. The problem is that Free Cash Flow, in the way most people calculate it, does not measure “the cash flows that the asset can generate on behalf of its owners…”
Most people calculate Free Cash Flow like this:
FCF = Cash Flow from Operations – Expenditures on Property, Plant and Equipment (PP&E)
While expenditures on PP&E is usually a large part of what fundamental analysts call “capex” it is most certainly not the only category of investments that a firm makes. In the Framework Investing, I detail the other elements of what I call “Expansionary Cash Flow”:
- Acquisitions (outflow) and divestments (inflow)
- Investments in or loans made to JVs (outflow) and dividends and loan repayments from JVs (inflow)
- Spending on development of software for internal use (outflow)
- Anti-dilutive stock buybacks (see our videos about this in the IOI Video section)
When we take these categories of Expansionary Cash Flow into consideration and deduct them from Owners’ Cash Profits (OCP) we wind up with what we call Free Cash Flow to Owners (FCFO).
If an investor tries to value a firm using Free Cash Flow rather than FCFO, the valuation will be wrong – plain and simple. A firm analyzed using Free Cash Flow will appear to be generating much more cash than it actually is so will seem more valuable than it actually is.
It took me a long time to realize the profound difference between Free Cash Flow and FCFO, and I consider that insight to be one of the most important in my book.
Imagine my surprise when I realized I had missed something!
One of IOI’s first consulting clients, a hedge fund manager in Brazil named Franco D., sent me a summary of his analysis of Amazon (AMZN) the other day. In this summary, he looks at the effect of something known as Capital Lease Obligations – essentially, a corporate rent-to-own agreement. (For those of you who are unfamiliar, Wikinvest has a good summary.)
Capital Lease Obligations are kept in a different section of the Statement of Cash Flows – Cash Flows from Financing – from most other investing line items. But no matter how it’s named or classified, capital lease obligations most certainly represent an element of expansionary cash flows as I talk about it in my book. Namely, it is an expenditure of resources to increase the productive capacity of the firm and to allow it to grow at a faster pace in the future.
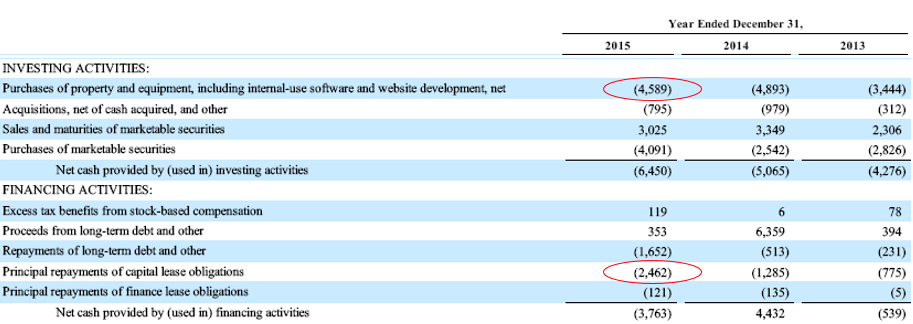
For Amazon, the amount of money spent on capital lease obligations is very large versus expenditures on PP&E as you can see in the next illustration.

The $4.6 billion expenditure is moneys spent on PP&E. The $2.5 billion expenditure is the money Amazon spent on repayments of capital lease obligations – a figure that represents more than half of the PP&E spending.
Even as I was thanking Franco for pointing this out I was kicking myself for missing it! But before beating myself up too badly, I decided to check companies on which I had spent a significant amount of time analyzing and writing about in the past and see what kind of an effect capital lease obligations would have on my calculations of FCFO for those firms.
Long story short, my omission of this expenditure from my calculation of FCFO is not nearly as large a factor in most of the companies at which I’ve looked. Wal-Mart, Oracle, and General Electric don’t even split out this charge as a separate line item. IBM does, but the total amount is just over 0.01% of expenditures for PP&E. I had not included this line item simply because most companies at which I was looking do not have material amounts of this type of expense.
The next step for me is to go back and correct the IOI Valuation Model and update models for the Dow 30 components available to IOI members. I can be happy, at least, that I realized the mistake before releasing the beta version of our online valuation tools!

