Before the market opened this morning (Thursday, 19 July), IBM — a company that I have invested in and written about extensively over the past few years — released its second quarter earnings report.
The release did not include its full statement of cash flows, so I will hold off on doing a full analysis until I see that. However, what I have been able to glean from the company’s press release and presentation deck make me think that the company’s capacity to generate revenues is better in an important way than the expectations expressed in the Framework Valuation Model for IBM.
Revenues
IBM reported revenue growth in its “Strategic Imperatives” business of around 13% Year-over-Year on a constant currency basis. In contrast, our best-case growth scenario for IBM’s Strategic Imperatives are 12% per year over the next five years.
While I’m happy about that one percentage point difference, I was overjoyed when I backed out the growth rate of the Non-SI business to be on the order of -4%. In both our best- and worst-case scenarios, we have assumed IBM’s Non-SI business will growth at a rate of -10%.
Put simply, the good news is good and the bad news is not nearly as bad as we expected.
Our model is in nominal, not currency adjusted, terms, but even backing out what the nominal growth rates likely are for Strategic and Non-Strategic business lines, IBM still looks to be doing well compared to our expectations.
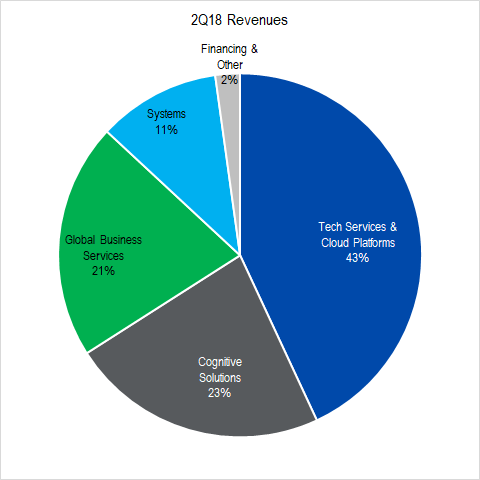
The Tech Services & Cloud Platforms segment generated $8.6 billion in sales which worked out to 43% of 2Q18 revenues. $3.1 billion of this revenue is in the Strategic Imperatives category, and that part of it grew at a brisk 24% year-over-year.

Figure 1. Source: Company Statements, Framework Analysis
This fact is notable because the quick growth made this the business unit doing the most Strategic Imperatives business in the company this quarter. Second largest is Cognitive Solutions, which includes the Watson artificial intelligence business.
We believe that IBM is having a harder time monetizing Watson than it had originally planned. Indeed, IBM reported this segment’s revenues as flat on a year-over-year basis.
Profits
As mentioned above, the company does not issue a set of full Statement of Cash Flows with its earnings report. Since our preferred measure of profitability — Owners’ Cash Profits (OCP) — is based on that statement, we will have to wait for the quarterly report (Form 10-Q) to be published before we can make a detailed assessment.
Our back of the envelope calculation suggests, however, that profitability tends to be closer to our worst-case assumptions at present.
We figure that 1H18 OCP margin probably will come in at around 13.6% versus a worst-case assumption of 15%. This miss is not as dire as it may sound at first, however, since IBM’s OCP does show some seasonality. Last year, we recorded IBM’s first half OCP margin at 15.9%. OCP margin for the full year came in at 17.2% — 1.3 percentage points higher than its mid-year value.
Adding 1.3 percentage points to our rough estimate of OCP margin puts us close to 15% OCP margins for the full year 2018 — just at our worst-case value.
Once the 10-Q is published, we will take another look and provide updated thoughts.
Impact
Looking back at the Valuation Waterfall for IBM, we see that the combination of best-case revenues and worst-case profitability generates a range of values between $162 / share and $194 / share, depending on what medium-term growth turns out to be.
You may or may not be interested in the upside potential — I know that IBM has its share of long-suffering investors — but with the stock trading in the upper $140 / share range, I hope you’ll see that it looks like the company’s downside potential is limited.
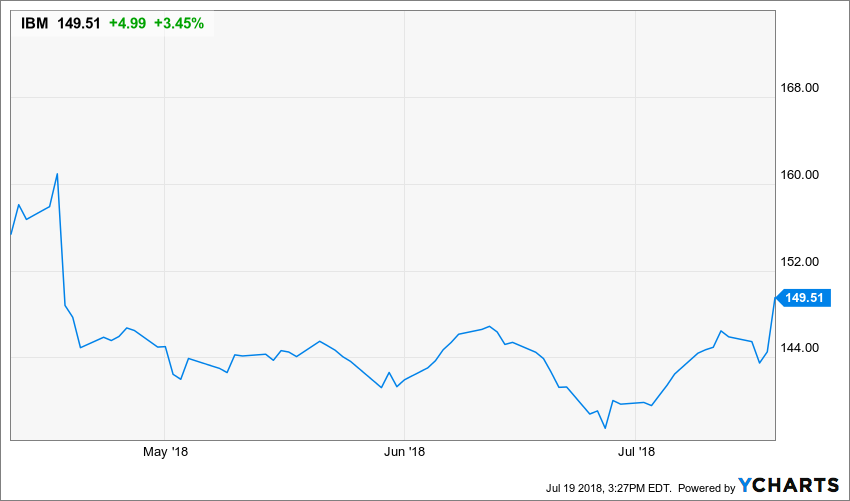
On April 11, we published a Bond Replacement Tear Sheet on IBM which suggested selling a put option struck at $155 / share. This strategy gave us an Effective Buy Price of $147.20.
IBM’s price fell heavily after we wrote the put and we ended up being assigned the shares by an unskillful option user at the end of June (or more likely a portfolio manager doing a little window dressing before quarter end). We wrote a covered call at the same $155 / share strike price to eek out a few more cents from the transaction.
The market was cheered by IBM’s report today and the shares are up to around $150 / share.

Figure 2. We sold puts on April 11 and received an EBP of $147.20. With today’s earnings report, the stock price has bounced back up above our EBP.
Because our strike price is $5 above today’s price, we will most likely be left with the shares as our covered call expires tomorrow. An investor has three choices in this situation:
- Sell the stock at the open and book whatever gain (a small one) between the EBP of $147.20 and its market price (e.g., $150.00).
- Immediately write another covered call at a strike of $150 / share and generate a new EBP which will equal the prior EBP of $147.20 minus the amount of premium received (e.g., $7 / share).
- Do nothing and hold the stock.
I’ll probably take a hybrid approach. Hold on for a few days and let the stock price drift up a bit more before aiming at selling another covered call at my original strike price of $155 / share.
We will post another Tear Sheet when we make the transaction.
