
I was surprised to hear two stock analysts discussing micro-blogging sensation, Twitter, saying how strong of a free cash flow generator the company is. Knowing the struggles the company has had trying to monetize its website, the comment that the company was strongly cash flow positive struck me as suspicious. After analyzing the numbers and coming to a very different conclusion, I posted an article to Framework members, which I have embedded at the end of this article.
Free Cash Flow is a vitally important measure for investors because it is widely used as the metric fundamental analysts use to estimate the value of a firm. The cash flow is “free” in the sense that it is the money generated by the firm that is theoretically available to owners of the company. You can think of it as the net wealth generated by the firm on behalf of its owners after all operational costs and investing spending is factored in. Most analysts use a definition of free cash flow similar to that used by YCharts: Cash Flow from Operations (CFO) minus Spending on Property, Plant & Equipment (PP&E). Using this definition, cash flow creation at Twitter looks strong.
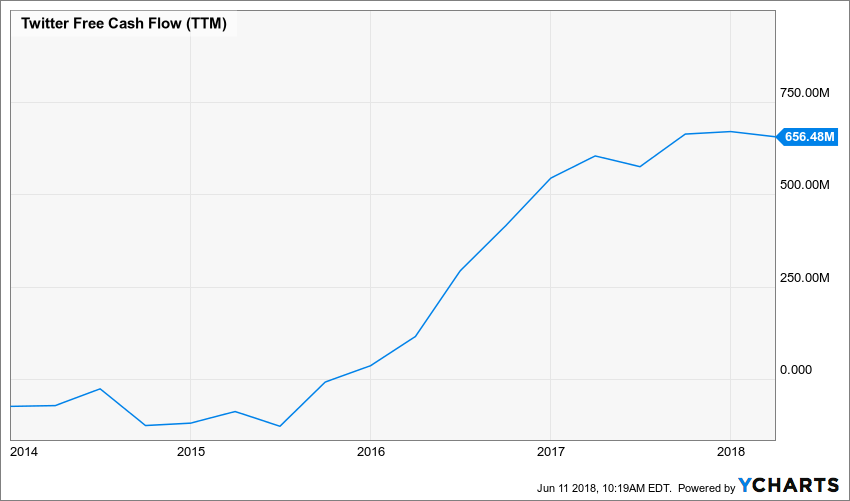
Figure 1.
Both CFO and Spending on PP&E are audited line items in a set of financial statements, so free cash flow strikes most people as a “reliable” measure of value created by a firm for its owners. In my view, this definition of free cash flow is good, but, especially for modern, service providing companies like Twitter, incomplete.
In the good ole days, a stable, mature widget manufacturer would buy input materials, churn out a supply of widgets, and sell those widgets at a high enough price to generate a profit. The manufacturer would have to spend some money each year to maintain and expand its widget-producing operations, but as long as its profit margins were generally high enough to cover these capital expenditures, the company could keep growing into perpetuity.
However, as business changed, became more global, and focused on providing services rather than or in addition to widgets, the way companies began investing in their business expanded from just maintenance and expansion of production facilities. For example, companies routinely expand by acquiring other companies, by buying stakes in promising private companies, and by acquiring other public companies in part or in whole. In addition, the use of capital leases mean that many times, even a company’s dedicated facilities are not owned by the firm, but are instead leased out.
Above and beyond these additional investment spending categories, ever since the dot.com boom, company management teams have discovered the advantages of using stock buyback programs to obfuscate their issuance of shares as a form of currency.
Management usually issues press releases to trumpet the how much “value” is being returned to shareholders via share buybacks; however, one has to dig around in the financial statements before one can see that management is simultaneously issuing a relatively large number of shares as currency — buying other companies, compensating top managers, or funding employee retirement programs — even as they are buying back shares in the open market.
For example, let’s say a company issues 10 shares of stock to its employees and buys back 100 shares of stock as part of its buyback program. Clearly, the cost of the 10 shares of stock issued to employees and later bought back must be deducted from a reasonable calculation of the benefits of the buyback to owners. (You can find a video illustration of this effect on the Framework Investing YouTube channel.)
Even for companies like Twitter, which do not buy back shares, the issuance of shares carries a very real economic cost to its owners in the form of dilution. At Framework, we assume we can approximate the economic cost of dilution by multiplying the average price of the shares over some time period by the number of shares issued during that period.
Once we include all of the various ways in which a company’s management team uses its owners’ capital to invest — acquisitions, capital leases, investments in JVs, and “antidilutive share buybacks” — we derive a metric we call Free Cash Flow to Owners (FCFO). We believe that FCFO provides a much more accurate picture of the capacity of a company to generate cash flows on behalf of its owners than does the old-fashioned “free cash flow” metric.
Read through the article below to see the difference between free cash flow and FCFO in the case of Twitter. You may be surprised at how drastic the difference is.
Framework Investing – Twitter’s Cash Flows by Erik Kobayashi-Solomon on Scribd