Executive Summary
- Options are directional instruments that allow investors to gain and accept exposure to a company’s value much more flexibly than stocks.
- Option pricing models show the market’s expectations for future price ranges of the underlying stock.
- Options may be used as levered or unlevered instruments. The amount of leverage relates to the relationship of the stock’s price to the option’s strike price and to the amount of cash is held in reserve.
For investors whose mandates include the use of derivatives, options overlain on a stock position can boost returns on a directional investment.
While long considered as the tools of speculators or “quants,” options are actually simple, directional instruments that have the potential to benefit the traditional value or position investor. This article explains the basics of options and of leverage.
Options as Directional Instruments
Any financial instrument allows an investor exposure to the cash flows of an underlying business. Stocks require a bullish (bearish) investor to simultaneously accept downside (upside) risk to gain upside (downside) profit potential.
The ranges of exposure for long and short positions in stocks can be pictured as below:
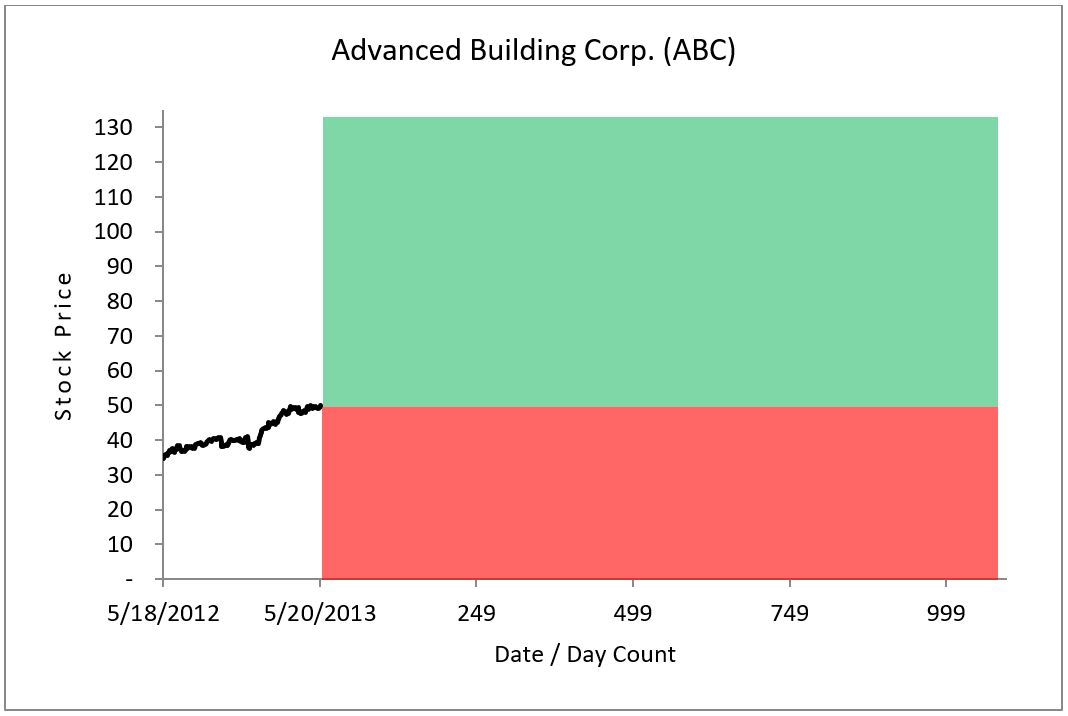
Figure 1. Risk / reward diagram of a long stock position. If the stock moves into the green range of exposure, a long investor can realize a gain. If the stock moves into the red range of exposure a long investor may have to accept a loss. In all the following diagrams, the acceptance of risk will be shaded using red; the potential gain from exposure will be shaded using green.
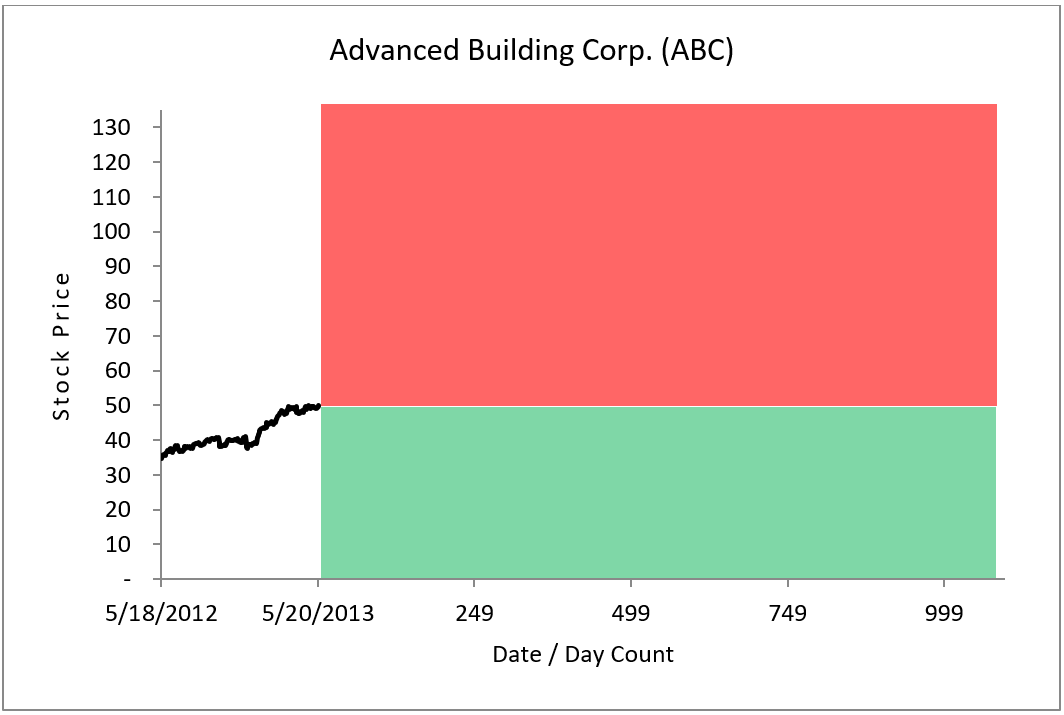
Figure 2. Risk / reward diagram for a short stock position. The short seller accepts upside risk and gains from downside exposure, exactly opposite from a long investor.
Options allow investors to uncouple the simultaneous acceptance and gain of exposure that are forced upon stock investors. Option investors can choose whether they want to accept or gain exposure to any range.
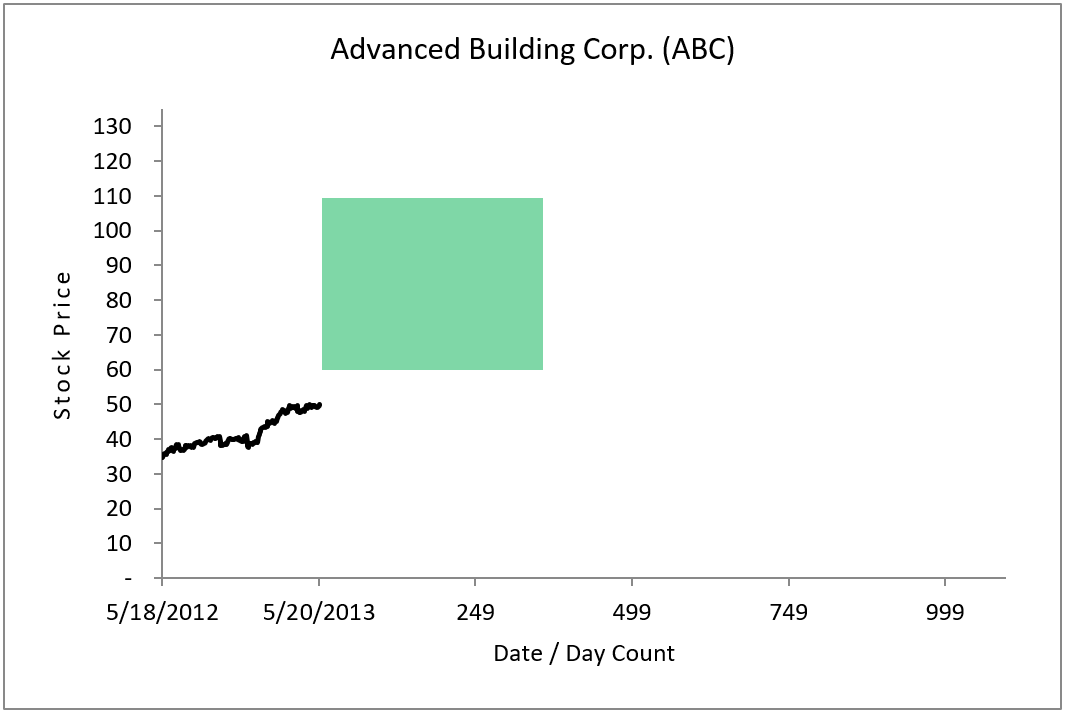
Figure 3. Bullish position – Long Call
With the option in figure 3, the investor has gained exposure to the range above $60 per share for a period of one year.
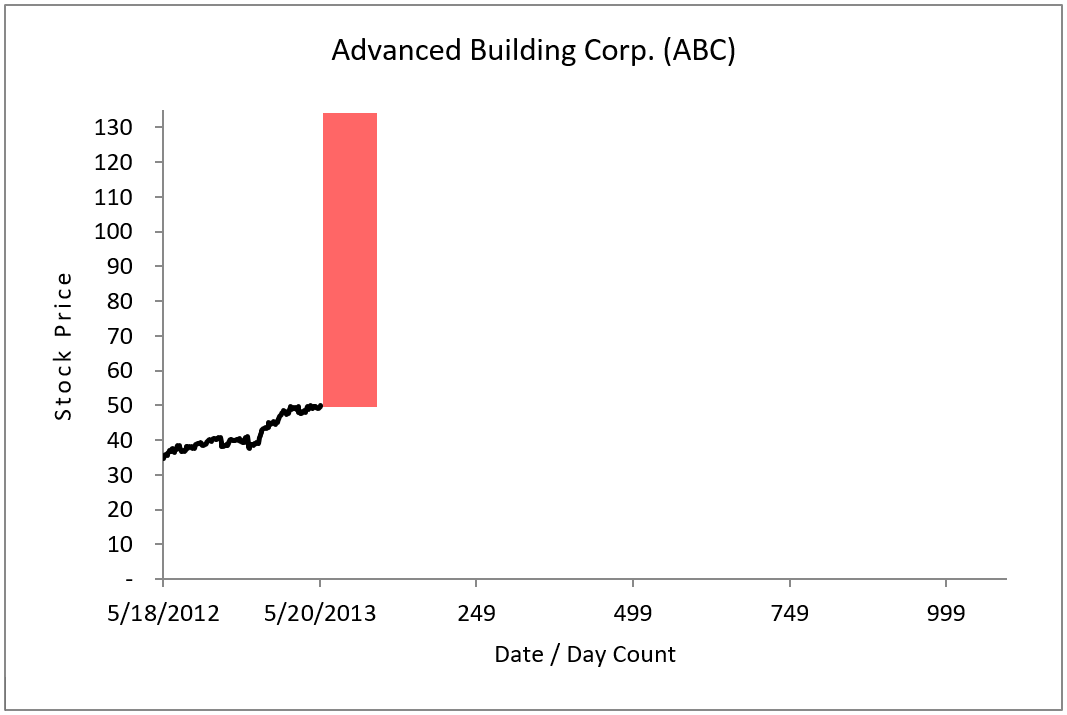
Figure 4. Bearish position – Short Call
With the option in figure four, the investor has accepted upside risk above a price of $50 for a period of three months.
In the way that call options allow investors exposure to the upside potential of a stock, put options can be used to gain or accept exposure to the company’s downside potential, as shown in figures 5 and 6, below.
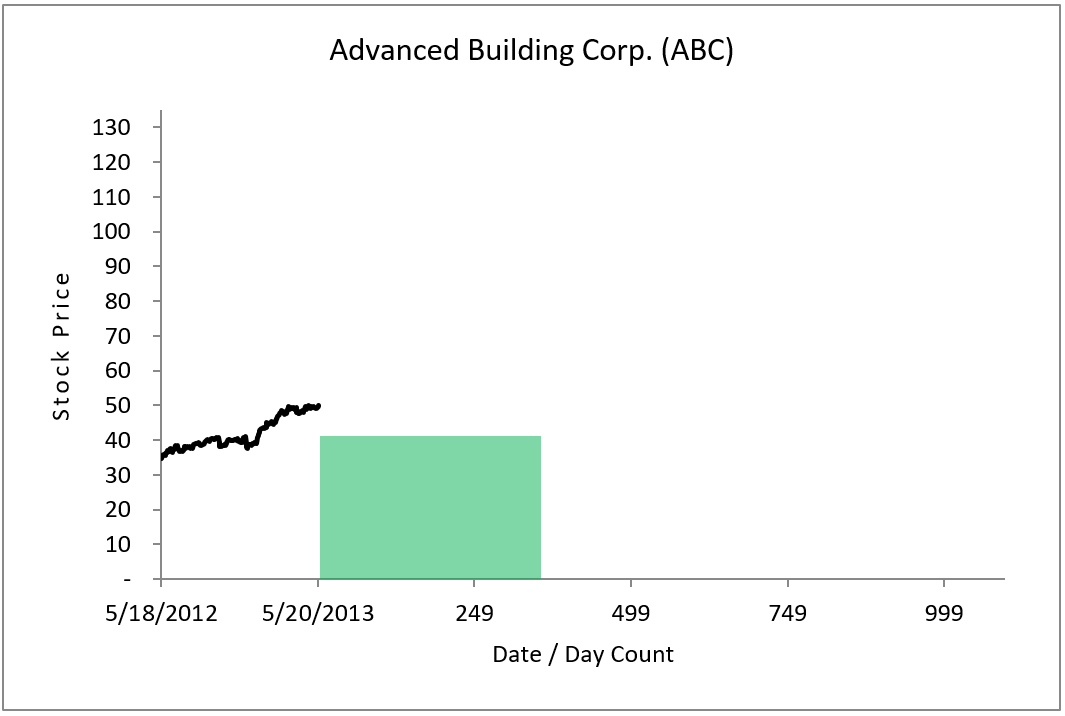
Figure 5. Bearish position – Long Put
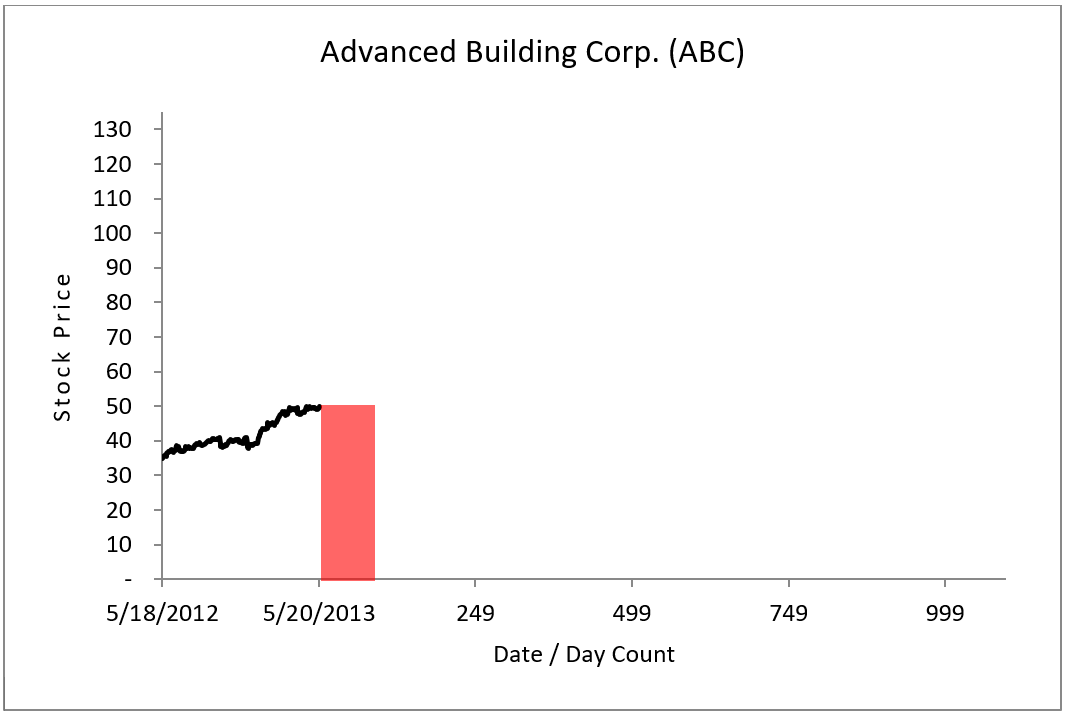
Figure 6. Bullish position – Short Put
Option investors pay a monetary premium when they gain exposure and receive premium when they accept risk.
Clearly, the ability to separate upside from downside and to flexibly gain or accept exposure allows an option investor much greater ability to tailor the risk / reward profile of investments compared to a stock investor.
Option Pricing
The amount of option premium exchanged in an option transaction is determined by market transactions. Theoretical option pricing models (e.g., the Black-Scholes model or “BSM”) use what is essentially a simple mathematical model of stock price movement to statistically determine the fair value of an option. Option prices are related to the probability that the stock will move to or past a certain stock price by a certain time.
By observing the prices of publicly-traded options, an investor can back out the implied price range for the stock at any time in the future.
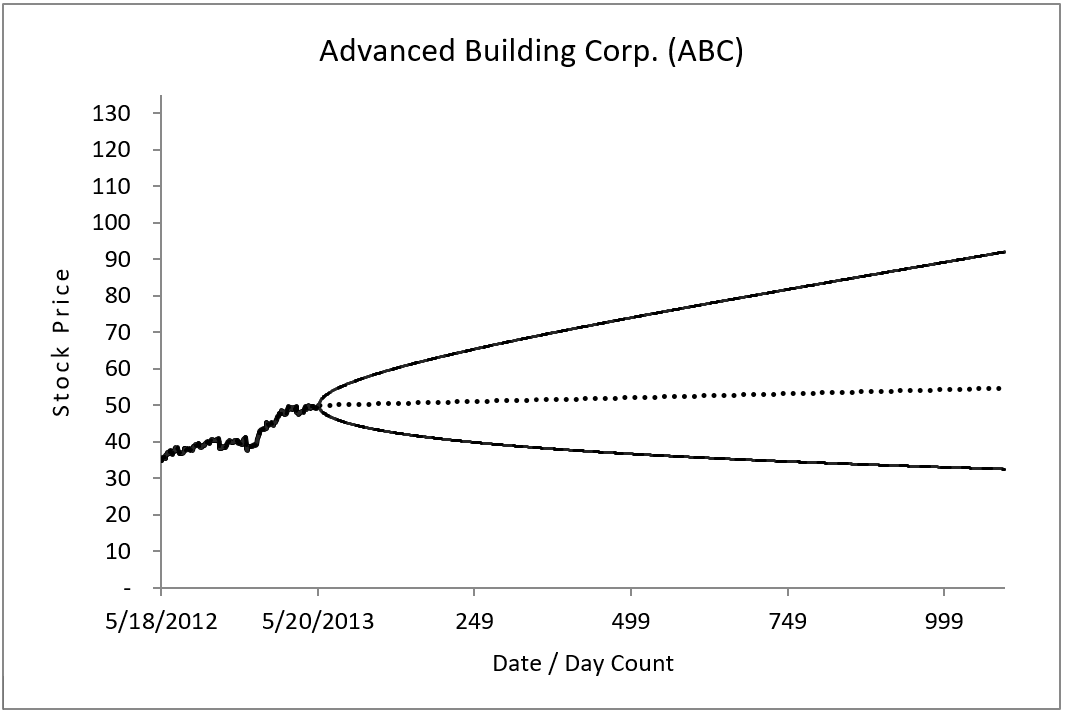
Figure 7. Implied probability of future price ranges displayed as a BSM Cone diagram.
The BSM and related models assume a lognormal distribution of prices, each of which is associated with a specific probability at any point in the future. In the figure above, the cone shows the 1-standard deviation range of possible prices in the future. At a point three years in the future, the BSM equation forecasts a roughly two-in-three chance (i.e., 1sd) of this $50 stock ranging between about $92 and about $32.
The statistically most-likely price (i.e., a 50% probability) is represented by the straight, dotted line shown above; this is called the “forward price” of the stock. The prices along the edge of the cone have roughly a 16% chance of being realized at any point in the future. Each price between the forward line and the cone’s lines have a probability between 50% and 16%, decreasing as the price goes away from the forward line and toward the cone.
Options, represented as ranges of exposure, are priced in proportion to the area of the range of exposure bound by the cone (or in proportion to the nearness to the cone for far Out-of-the-Money (OTM) options.
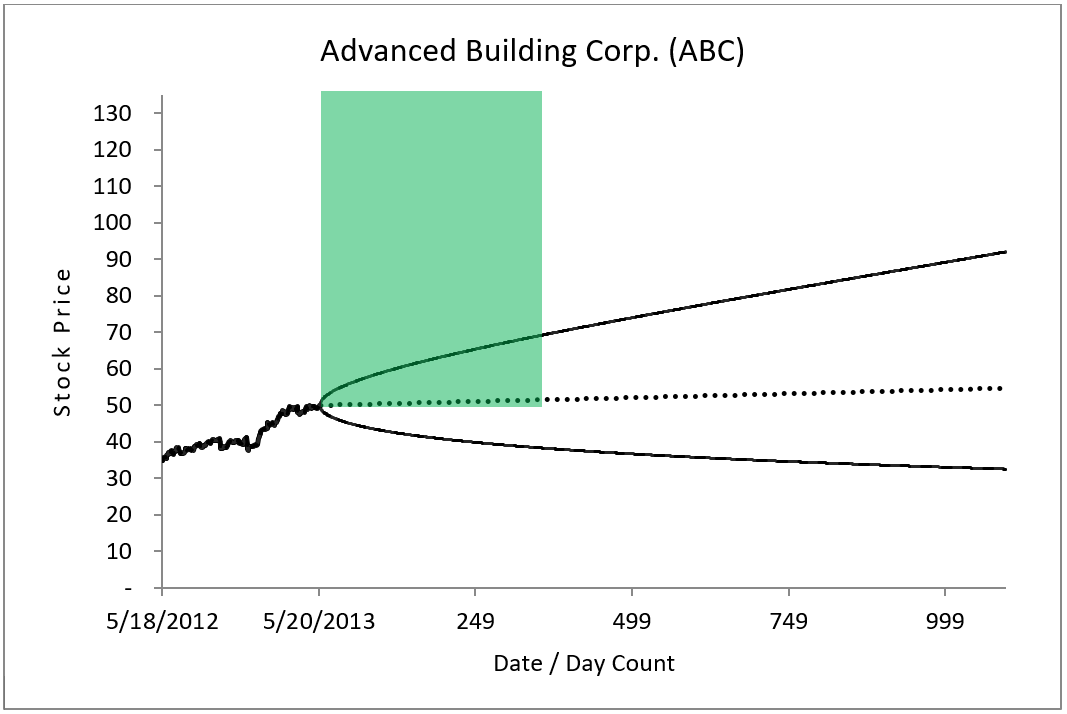
Figure 8. At-the-Money (ATM) long call option
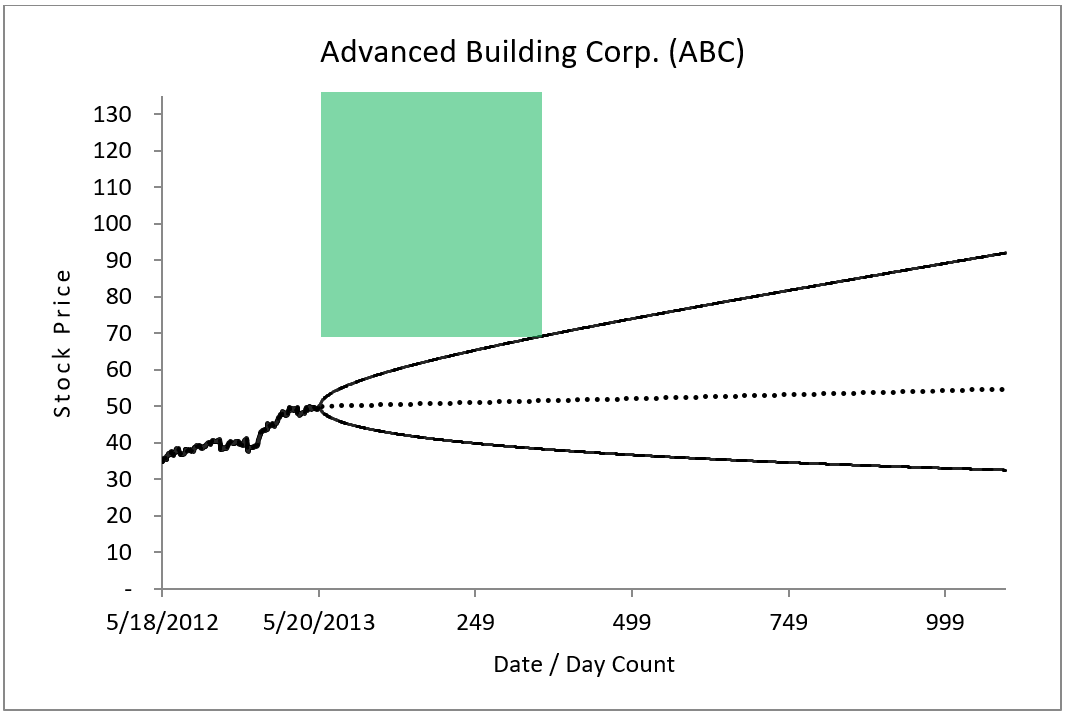
Figure 9. OTM long call option
Clearly, the ATM call option shown in figure 8 will be much more expensive than the OTM call option shown in figure 9 because there is a much greater chance that the ATM call option will expire In-the-Money.
Leverage
Financial Leverage is always created by the act of borrowing money. Options allow investors to enter into a very flexible borrowing arrangement, through which investors have the option to repay the principle or not. We term options a “conditional loan” for this reason.
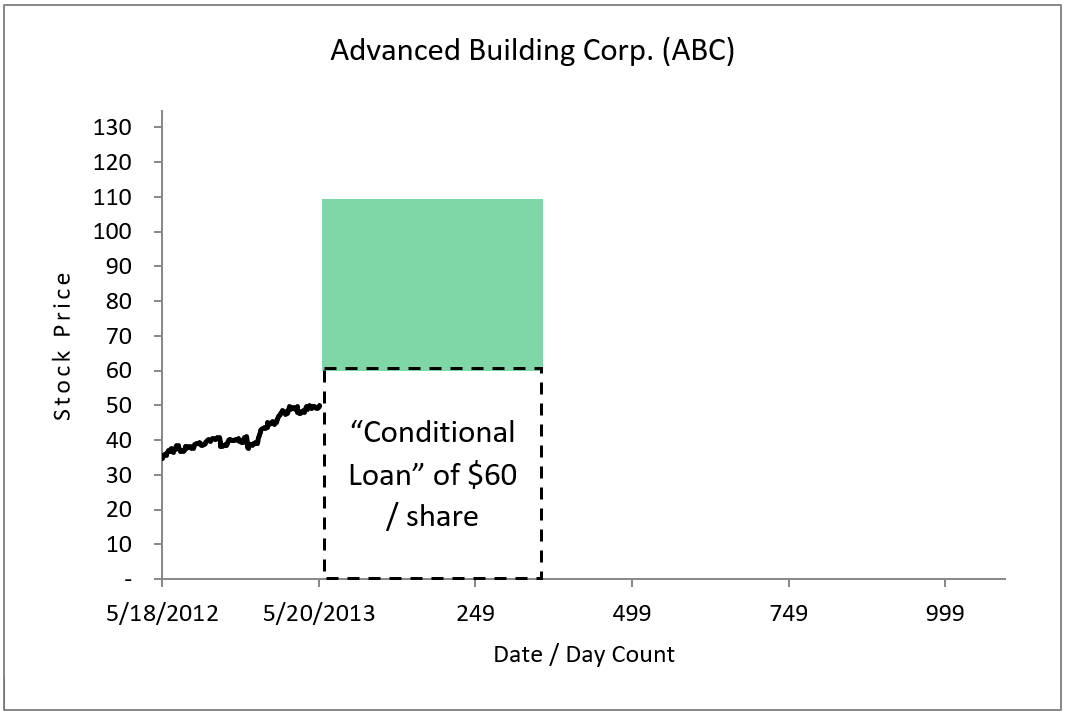
Figure 10. This OTM call option allows an investor to virtually borrow $60. “Interest” is paid up front in the form of premium, but the “loan principle” need not be repaid at expiration. This is a highly-levered position.
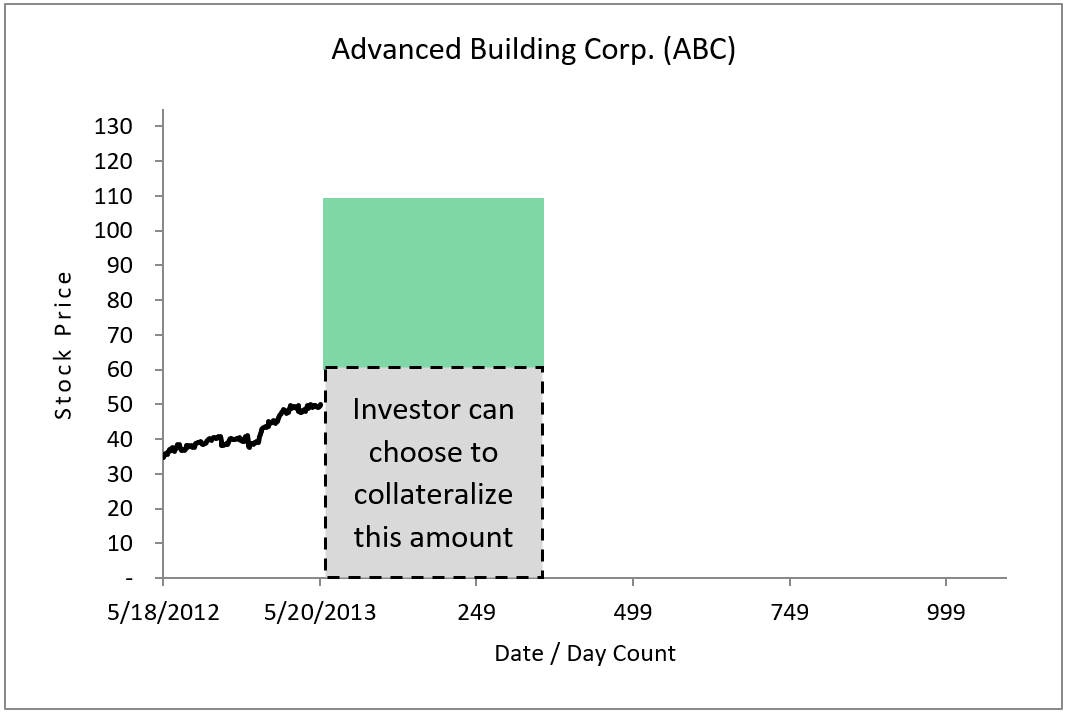
Figure 11. An investor can choose to self-collateralize the option’s “conditional loan.” If the investor holds $60 of cash in reserve, the OTM option shown here becomes an unlevered position. Leverage can be fine-tuned by altering the amount of cash held in reserve.
By increasing or decreasing the amount of self-collateral posted, investors have complete control over the amount of leverage a given investment structure has.
By altering the strike price of an option, investors can also vary the amount of leverage in a given transaction. Selecting strike prices above the present stock price (for bullish investments) – OTM options, in other words – are more highly-levered. Selecting strike prices below the present stock price – ITM options, in other words – carry more moderate leverage.
Figure 12. Investors in this OTM option are conditionally borrowing $60 – more than the $50 price of the stock. The “loan-to-value” ratio (in real estate terms) is high, so leverage is high.
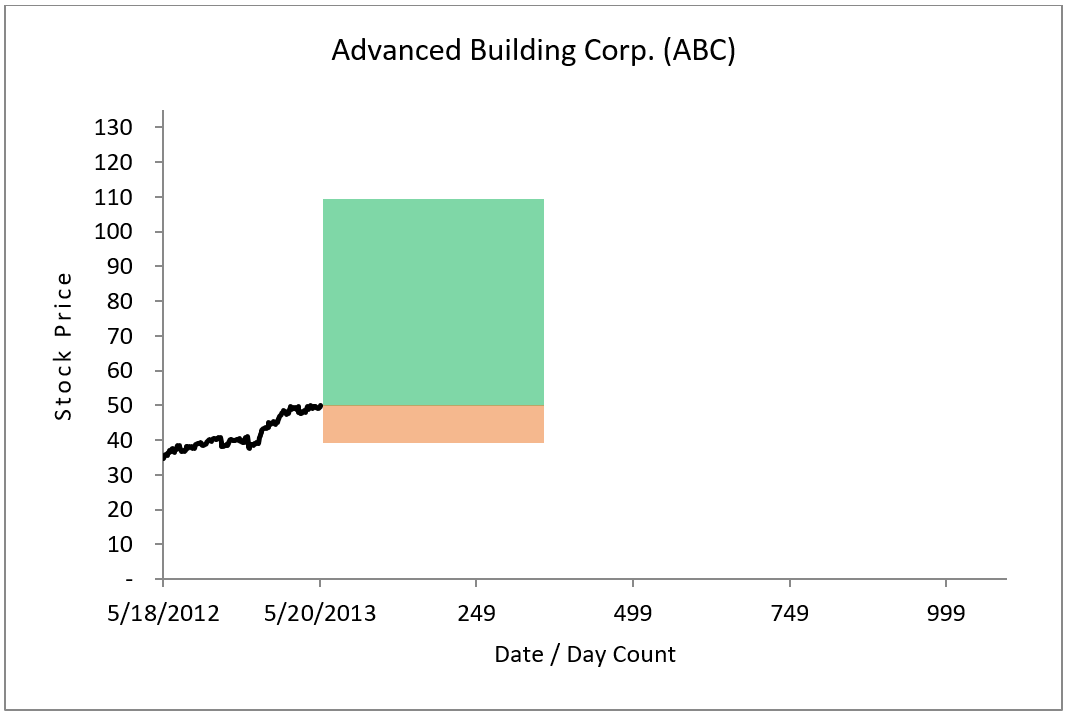
Figure 13. Investors in this ITM option are putting up $10 of their own capital (shown in Orange) and conditionally borrowing $50. The loan-to-value ratio is lowered, implying a lower leverage structure.
Summary
Options allow an investor to flexibly select to gain or accept either or both upside and downside exposure and to flexibly determine the investment’s desired leverage level. This flexibility gives an intelligent option investor unparalleled ability to tailor their risk / reward exposure to an investment idea.