This weekend, I spent some time taking a look at Caterpillar, and frankly what I found surprised me.
I was especially surprised that :
- Caterpillar has been able to generate pretty consistent profits even in some pretty up-and-down environments and that
- Caterpillar has grown so very well over the last 20 years or so.
Whenever you analyze a company, if you don’t find something that surprises you, I think you probably just looking at your own prejudices about the company, so I was happy to find something that really did surprise me about CAT.
Let’s take a look at what I found.

Figure 1. Source: Company Statements, IOI Analysis
This chart in the IOI Valuation Model shows profitability over time. The dark blue columns represent the actual profitability of Caterpillar over the last 10 years measured in our preferred profit measurement, “Owners Cash Profits;” it’s a cash-based version of profitability that we think reflects economic reality better than accounting versions of profitability.
As I was saying, Caterpillar has been able to generate pretty consistent profits, even in very different operating environments. In the chart above, the black line shows OCP margin. This profit margin looks pretty stable; keep in mind that this is even in the midst of the big Chinese commodity boom, in the midst of the global recession, and in the recovery from the recession. During all of this time, notice that the margin line never goes below zero percent.
I actually decided to look at this for a longer period, so I went to YCharts pulled back the data all the way back to 1989.
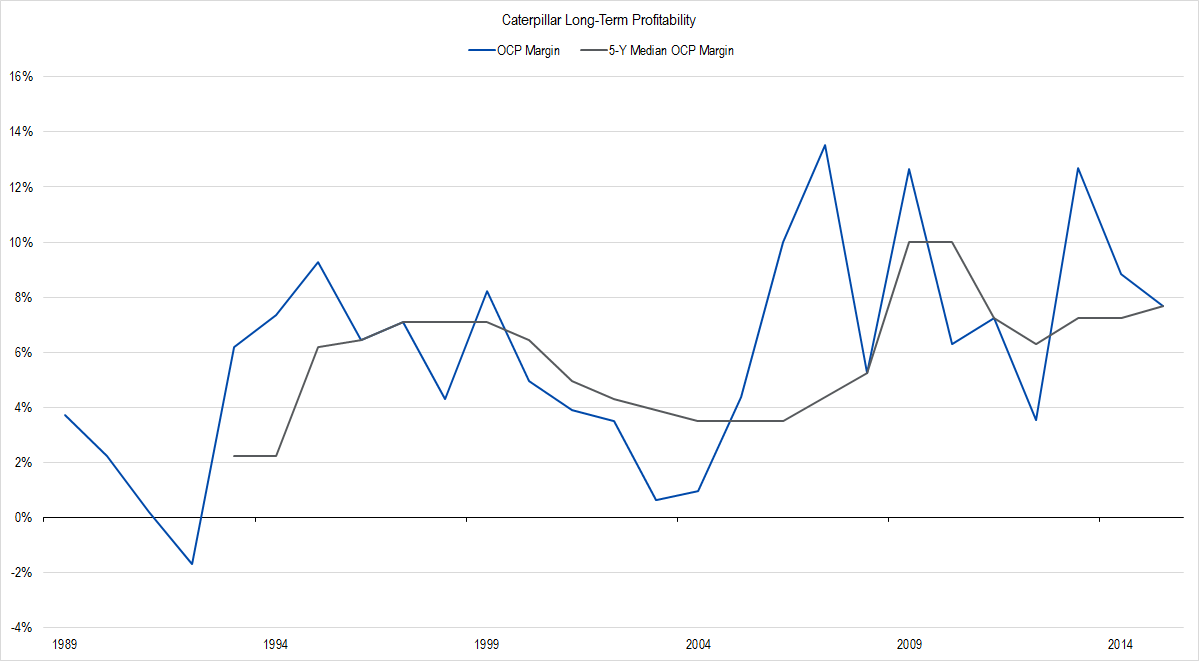
Figure 2. Source: Company Statements, IOI Analysis
In this longer study, the blue line represents OCP margin. You can see that the blue profit margin line is bouncing back and forth, mainly in the single digit range. There’s only one year – in 1992, in a bad recession – when Cat actually generated an OCP margin of -2%. However, other than that year, over this entire period, CAT has managed to produce a cash profit.
The important thing is that gray line. The gray line is the five-year median OCP margin; you can see that the median is pretty constant – between 8% and 4% during almost the entire history. There are a couple years that are a little higher and a few that are a little lower, but in general, it generates pretty good middle-of-the-road profits.
The other thing that I like to look at, which I mentioned, in the introduction, is that profits have been growing pretty well vis-à-vis nominal GDP. This is the measure against which we like to judge corporate profit growth for reasons we discuss in our courses.
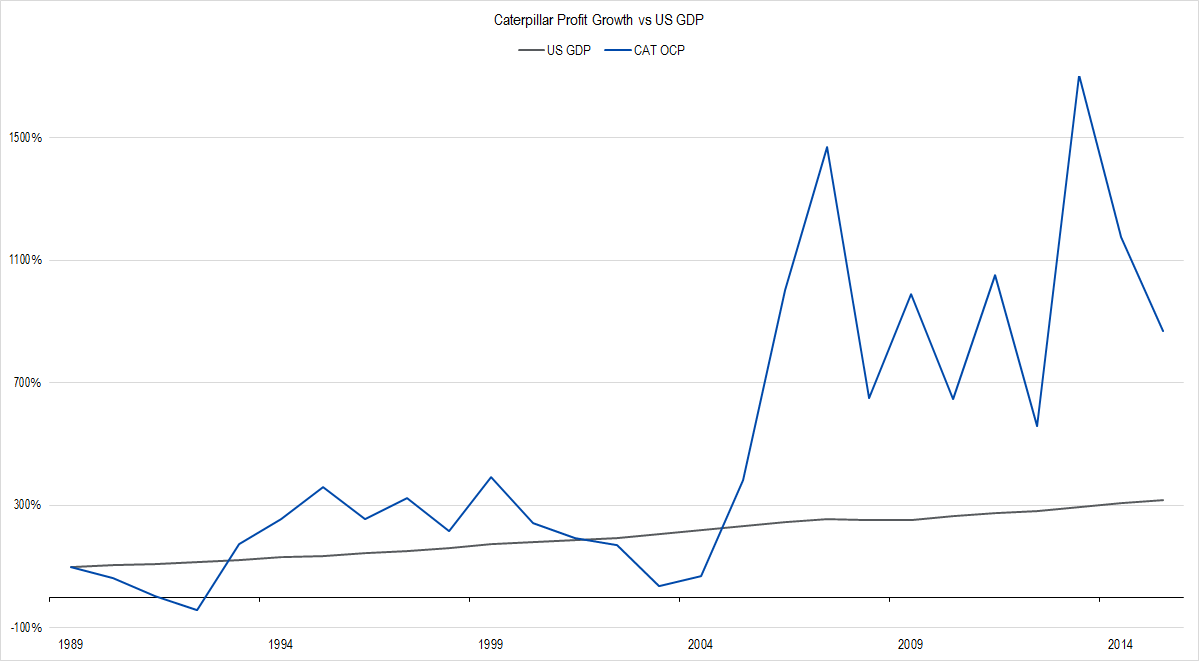
Figure 3. Source, Company Statements, BEA, IOI Analysis
The gray line above is the nominal US GDP over this period, and the blue line is CAT’s profits, both of which are indexed to one in the first year.
You can see that the enormous growth in profitability after 2004; this is CAT taking advantage of the huge shift towards providing steel for Chinese infrastructure projects and all that. So if we look at this in on a longer-term perspective, the growth really does look very good. CAT made investments earlier in its history, which made it able to take advantage of the big shift toward the developing world in the early 2000’s.
These are the two things that particularly surprised me about CAT when I looked at it. I don’t have a valuation complete for it yet. It’s going to take me a little bit longer as I have to really think about the likely growth of the revenue streams. I’ll have a full valuation for IOI members very soon. Stay tuned!