Transcript
Welcome to Sunday Morning Coffee with Erik!
This is a special Sunday Morning Coffee session. Perhaps you can hear birds in the background. It turns out I’m in Honolulu Hawaii rather than dreary old, cold Chicago, Illinois, so there are tropical birds singing in the background as I’m talking to you today.
What I like to talk about is the difference between market risk and valuation risk. Investors confuse these two things a lot of times, but the difference between them is really critical.
Market risk deals with the price of a security. Any time you invest in a security, you cannot avoid market risk – it is simply the risk that the price of the stock will go up or down. You may not think that the stock going up is risky, but in fact that’s the technical definition of [market] risk.
Valuation risk, on the other hand, is the risk that you will invest in something whose intrinsic value is lower than the price at which you bought.
As intelligent investors, we love market risk – that is our stock in trade – but we do not want to deal with valuation risk.
We want to avoid valuation risk and accept market risk.
I can show you the difference with between valuation risk and market risk very simply by looking at our BSM Cone workbook that we give to our members. First, let’s take a look at market risk.
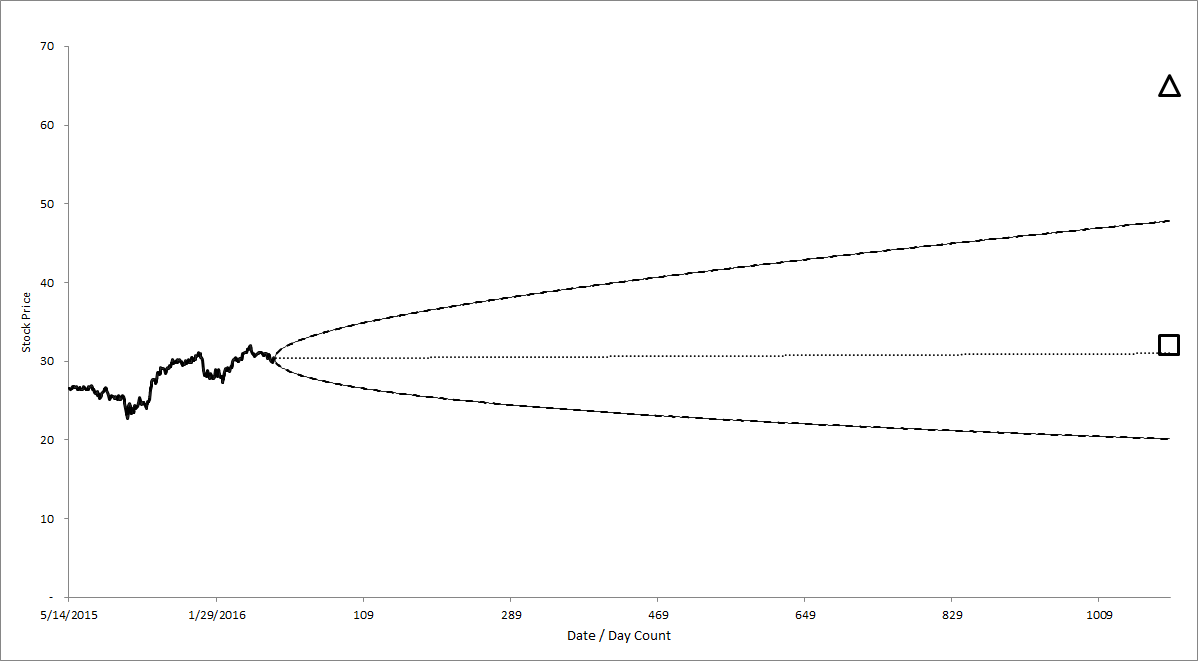
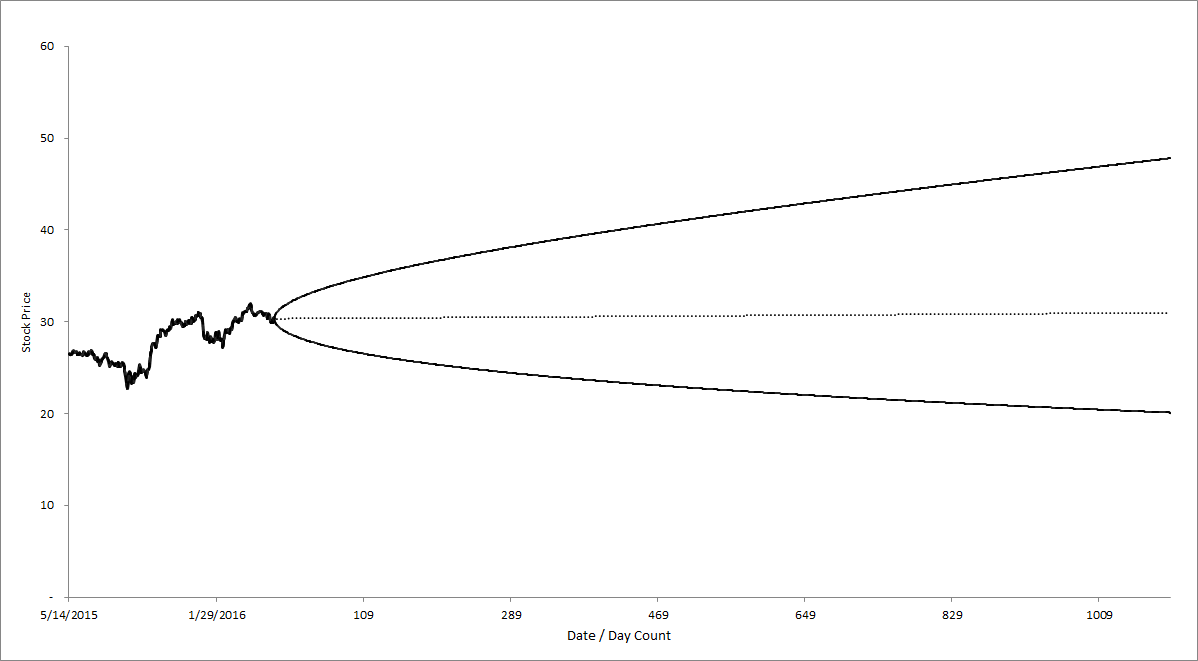 This cone-shaped graph is a representation of the option market’s idea about the riskiness of this company. There are a few things that you will notice: first, the cone-shape there is made from the Black-Scholes Model (that’s why we call this the “BSM Cone workbook”), which takes in a few simple inputs and then spits out what the riskiness of that the security is.
This [diagram] shows upside risk up to around $50 and downside risk down to around $20. You may think that upside riskiness does not make any sense, but in fact the academic definition of risk is simply price fluctuation. Obviously, if you’re invested, you cannot escape from price fluctuation; if you want to be completely insulated from market risk, you should just keep your assets in cash.
The option market shows us a range of likely price outcomes, and these are get wider over time, which suggests that there’s more risk over time, according to the Black-Scholes model.
Notice also that the cone is symmetrical. It looks maybe a little lopsided but it’s what’s called log symmetrical; in other words, it shows lognormal price distributions. So it is symmetrical and the that line in the middle is showing what the most likely future price is [according to the Black-Scholes Model].
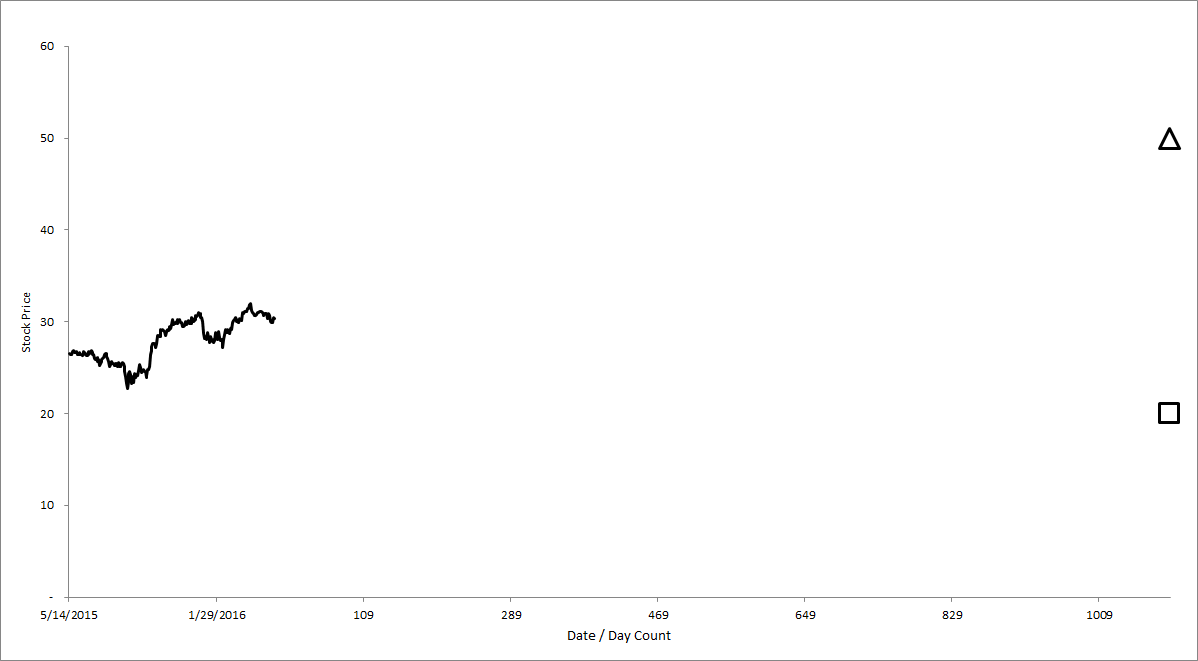
Let’s contrast this image with Valuation Risk. The way that we show valuation risk is by looking at a valuation range.
 One of the things that’s really distinctive about IOI valuation methodology is that we don’t try to hit a specific point estimate [of value], but make a range of valuations. We understand that companies are very complex and that a lot of things can happen and we can’t know perfectly what the future’s going to be so we think that looking at a range of possible values is the most intelligent.
In the image I’m showing you now, the square shape on the far right is worst-case valuation and the triangle and the top is our best case valuation.
So for both the long and a short investor – in other words, for investors who bought the stock or investors who sold the stock – there is valuation risk.
Let’s just focus on the long side – in other words, buying the stock. If we buy the stock at the present price of $30, its value may drop to $20, which is where our worst-case valuation.
This is different from the BSM Cone chart that we were just looking at. That chart is saying that the price may fall to $20. As an intelligent investor, I don’t care if the price falls to $20, but I care deeply that the value of the security that I bought at $30 does not settle at $20.
What we do at IOI is to compare the market risk to the valuation risk and in the image below, they look pretty similar.
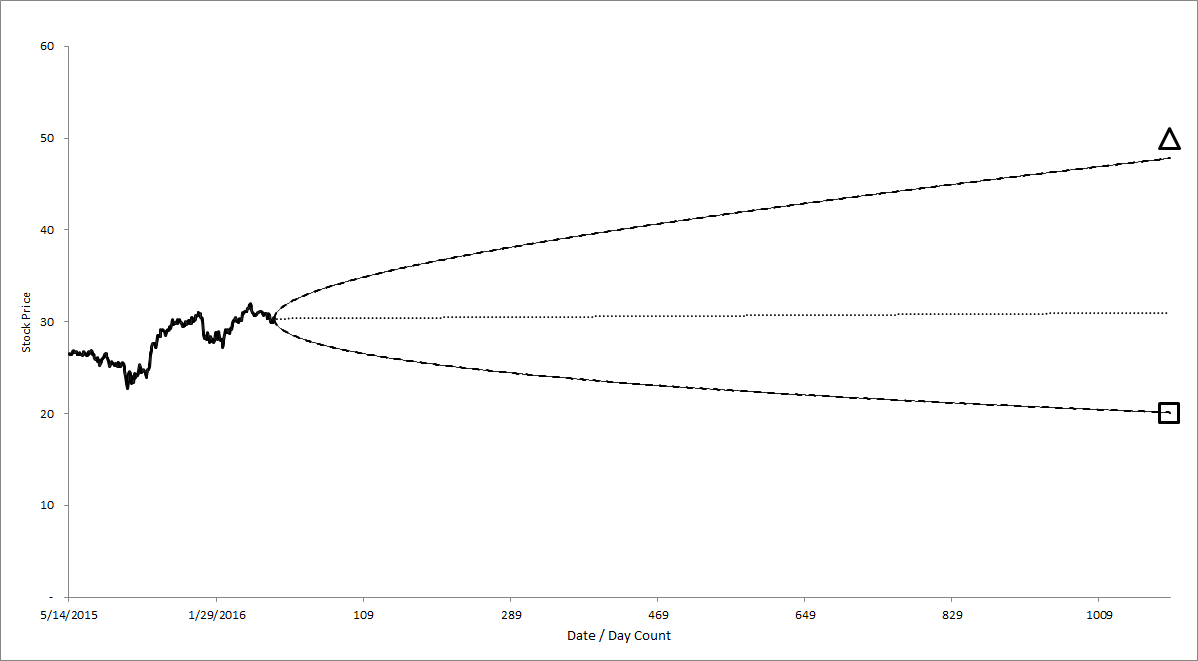 Maybe the upside valuation risk is a little greater than the upside market risk, but to me, it looks like a “horseshoes and hand grenades” kind of difference.
As for downside risk, the valuation risk equals the price [risk], so this [situation] would not be an interesting investment to me.
Let’s change things up a little bit and I’ll show you what might be an interesting investment. Let’s assume that our worst-case valuation is $32 and the best-case valuation has not changed.
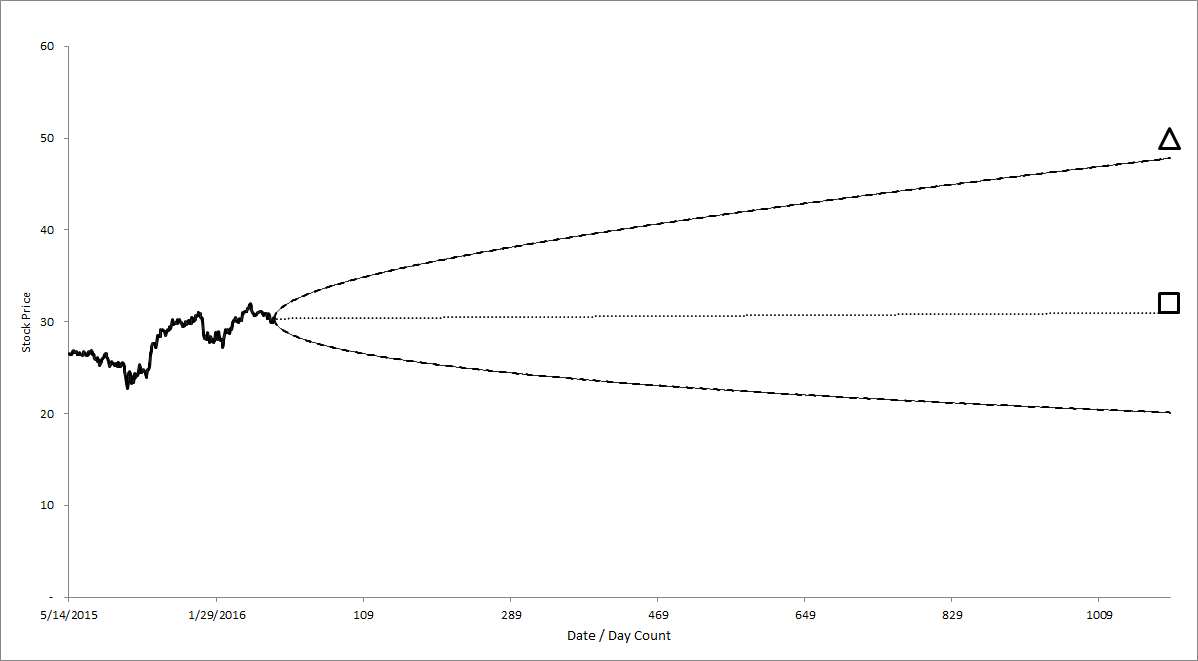 This image says that it at worst, the company is worth about $30. There’s not a lot of upside [potential] there so maybe you would not want to buy the stock, but using options there are certain ways to invest in this kind of a situation.
Notice that, on the downside, the market thinks that there’s a great deal of market risk. This market risk can be used to create income for me as long as I’m not accepting valuation risk.
Let me show you another case which is probably my favorite; if I can find a situation like, this will be a very happy guy.
 When I look at the best-case valuation, it’s considerably above what the market thinks may happen; the worst-case valuation is actually just about where the present price of the stock is.
This is the type of investment that I really want to invest in; there is limited downside [valuation risk] and significant upside [potential].
Here I would probably layer on an investment in the stock plus one or more different option structures to try to add a little spice.
As intelligent investors, we should always be looking for opportunities to arbitrage between what the market thinks about the price of a stock and what we know to be the value of the stock.
This is the essence of intelligent investing in the essence of what we do at IOI. Okay, thanks for joining me!