Union Pacific announced second quarter earnings this morning and a brief look at the numbers encourages us in our bearish position. UNP’s actual results are tracking very closely to our worst-case operational forecasts and are supportive of our bearish view on the company.
I sent out a mail earlier in the month notifying subscribers that I had increased my exposure to this bearish investment in Union Pacific according to this Tear Sheet we published in late June.
Revenues
Union Pacific generated $5.3 billion of revenues this quarter and $10.4 billion in the first half. Compared to last year’s mid-year total of $9.6 billion, Union Pacific’s revenues have increased by 8.2%.
First half 2017 revenues from transporting coal increased by a whopping 25%, but coal volumes are usually flat in the back half of the year and present weekly carloadings are on par with those of 2016, the worst year on record.
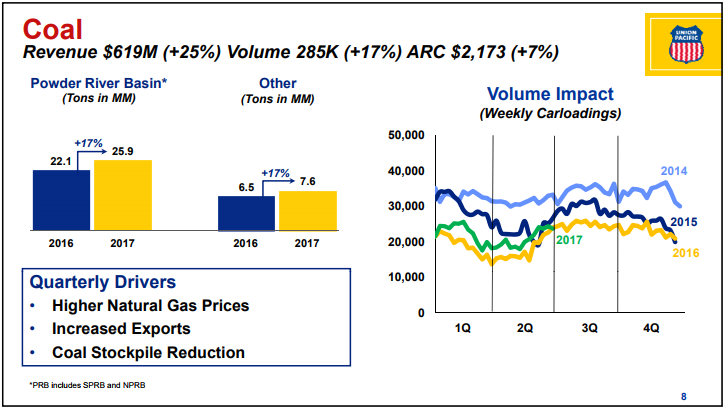
Figure 1. Source: Union Pacific Investor Relations
First half revenues from transporting industrial products was up by 16% as we thought might happen due to the increase in oil prices which in turn led to a pick-up in fracking activity.
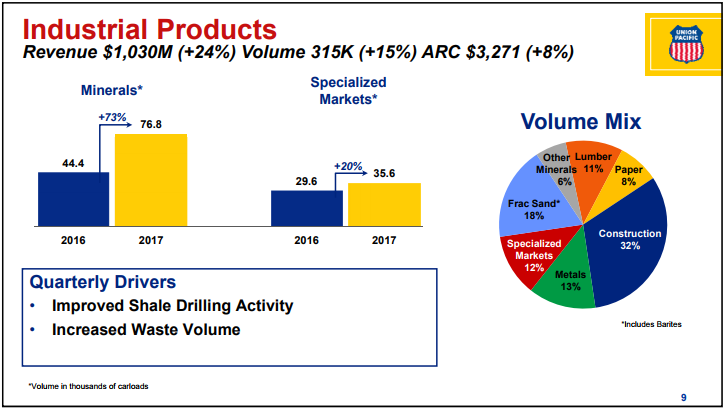
Figure 2. Source: Union Pacific Investor Relations
The biggest surprise for me was that the average revenue per car increased fairly strongly – 5% over the first half of 2016. This revenue increase contrasts with the information we received from an industry insider and detailed in our video Rail Pricing is Changing. We will keep watching this metric, and after full-year results are in, will take a look at how the price is changing after the effects of the fuel surcharge are stripped out.
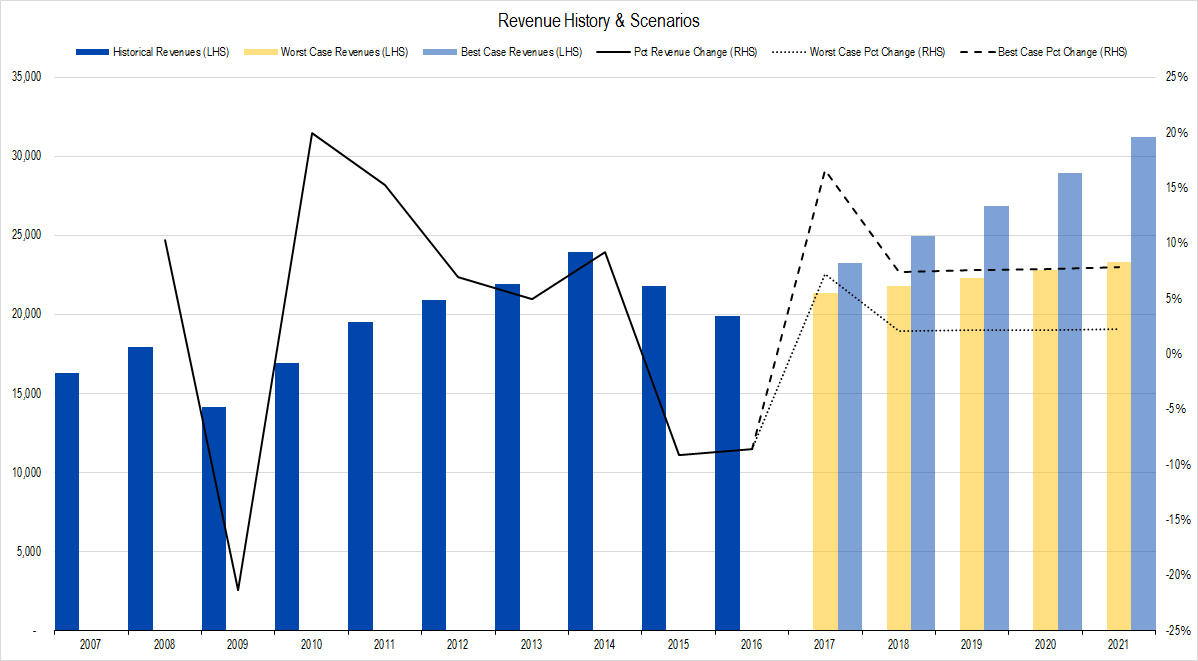
Figure 3. Source: Company Statements, Framework Investing Analysis
Our worst-case revenue growth assumption for 2017 is for an expansion of 7.2%, implying total revenues of $21.4 billion this year (compare to the first half revenue figure of $10.4 billion). Our best case assumption is for a revenue boost of 16.6%, implying total revenues of $23.2 billion for the year.
Clearly, actual results for the first half are closer to our worst-case assumptions than to our best-case.
Profits
Union Pacific does not provide a full Statement of Cash Flows with its earnings announcement, but rather just an overview. As such, we will not have a firm understanding of reported profits until the 10-Q (quarterly financial statement) is released.
In the company’s press release, management crows about its improved “operating ratio” – an industry measure of profitability that is essentially the inverse of “operating profit” and is widely used in the industry. The operating ratio came down to a record-breaking 61.8%, so I naturally thought Owners’ Cash Profit (OCP) margin would be on the high end as well.
I was in for a surprise.
The company reported $3.5 billion in Cash Flow from Operations in the first half of 2017 (compared to $3.5 billion in 1H16). It reported a Depreciation expense of $1.0 billion this half; these figures imply OCP of $2.4 billion and an OCP margin of 23.0%. This figure matches our worst-case profitability forecast.
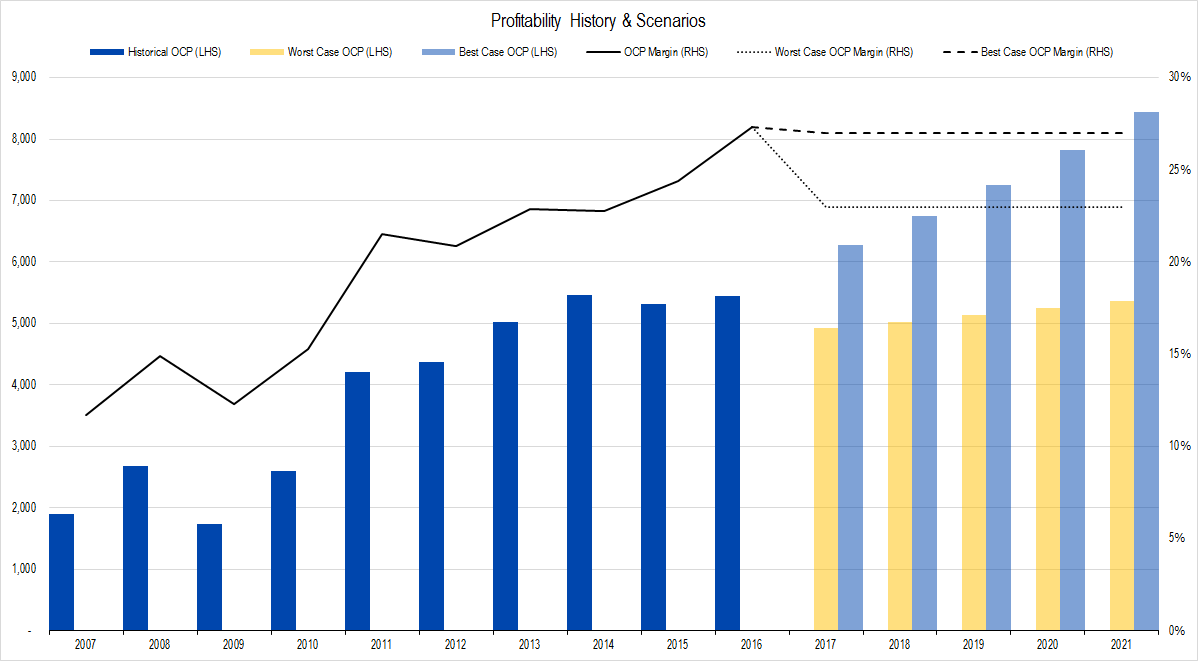
Figure 4. Source: Company Statements, Framework Investing Analysis
On an absolute basis, our worst-case OCP forecast is that the firm will generate around $4.9 billion this year and the firm’s actual OCP run-rate is just $4.8 billion.
Investments
No company provides enough disclosure in its earnings announcement to accurately calculate Framework’s measure of investment spending: Net Expansionary Cash Flow. From the disclosure UNP does offer, we think total Net ECF will come in at around $574 million for the first half of the year – 24% of OCP so far.
Our model assumes the company will spend 30% of its profits on investment spending so actual Free Cash Flow to Owners (FCFO) in the first half should fit well within our projection window and will be closer to the worst-case assumption.
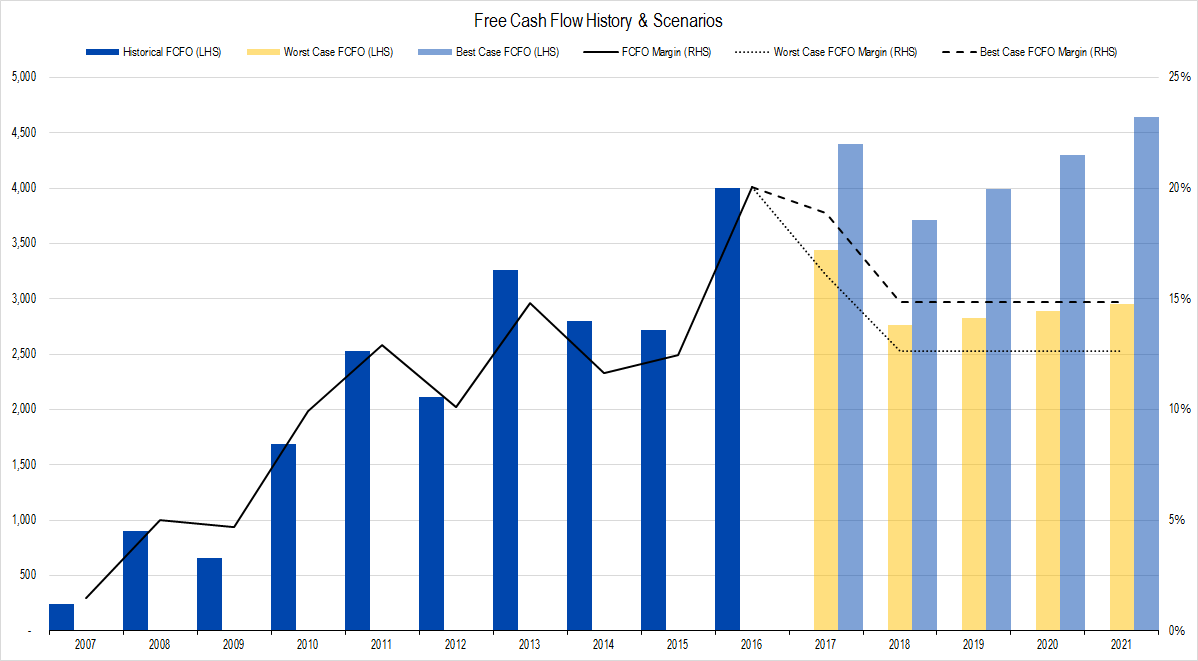
Figure 5. Source: Company Statements, Framework Investing Analysis
Valuation
There is no reason to alter our medium-term growth view based upon two recent quarters of earnings results, so we are leaving these unchanged.
 Loading...