Caterpillar announced third quarter earnings yesterday morning and, for the second quarter in a row, management raised its revenue growth and EPS guidance for the year. Long story short, from our perspective, there was nothing surprising about the announcement; the company continues to generate healthy revenue growth, which was lower than our best-case forecast and its profits dropped back to below our adjusted worst-case assumption for the first nine months of this year.
Nonetheless, Caterpillar’s stock soared on the earnings announcement, and shot through the protective covering call on the bearish call spread strategy we published at the end of August.
We must admit our frustration with this troublesome cat. While we are not invested in the August call spread (which expires in December), we are invested in a put option expiring in January 2018, whose market value is now practically zero. While it is never fun to suffer unrealized losses, we entered into these investments as potential sources of cash during a pullback; in that sense, they can be considered insurance. No one likes to write insurance checks, but also no one complains if at the end of the coverage period, their house has not yet burned to the ground.
We have written extensively about Caterpillar – you can find those articles and research through this link.
The comments here compare Caterpillar’s actual results to our operational projections for the current year.
Revenues
The firm generated $32.6 billion during the nine months of 2017, compared to $29.0 billion during the first half of last year – an increase of 12%. In addition, the firm provided upward guidance for full-year 2017 revenues of around $44.0 billion – settling into the top end of the range it provided during second quarter earnings. In contrast, our we tweaked our model to a range of $42.0 to $46.0 billion as a result of the second quarter guidance and now tweak it yet again to a range of $44.0 to $45.0 billion. The new forecast range implies revenue growth of between 14% and 17% during 2017.
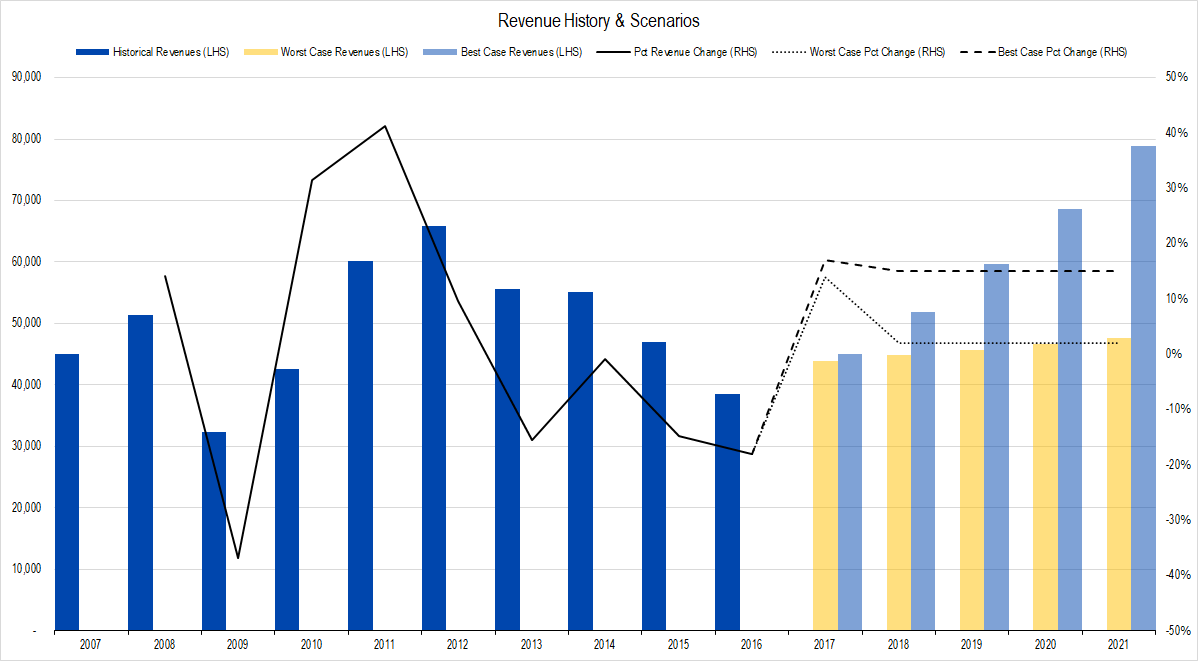
Figure 1. Source: Company Statements, Framework Investing Analysis
Profits
Caterpillar provides a complete Statement of Cash Flows, so it is possible to calculate Owners’ Cash Profit (OCP) for the first nine months of the year. According to our estimates, the company generated $2.9 billion of profit, implying an OCP margin of 9%. In contrast, our model forecast a margins in the 10% to 14% range – a range that we goosed upward after second quarter earnings due to the company’s surprising ability to generate cash flow in the first half, as detailed in our second quarter earnings review.
We have dialed down our worst-case profit margin forecast for 2017 at 9% and leave our best-case forecast at 14% – a value we frankly think is too high.
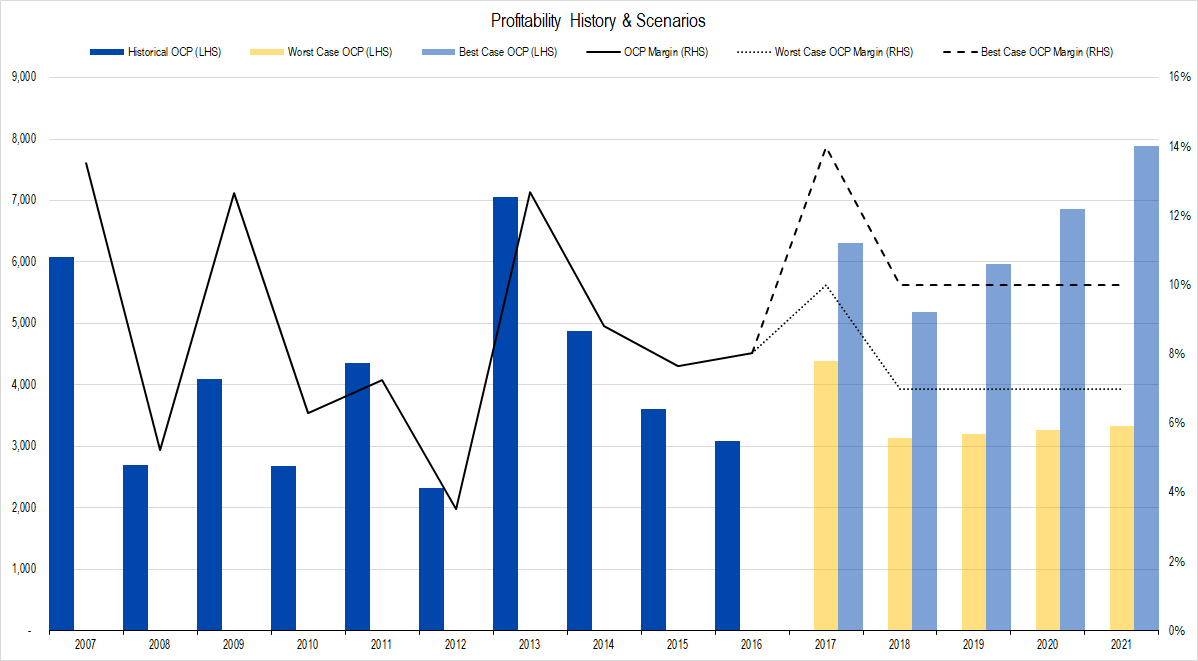
Figure 2. Source: Company Statements, Framework Investing Analysis
For 2017, our OCP range is from $3.9 billion in the worst-case to $6.3 billion in the best (OCP margin range of 9% to 14% versus an OCP margin of 6% during the first nine months of 2016).
Investments
No company provides enough disclosure in its earnings announcement to accurately calculate Framework’s measure of investment spending: Net Expansionary Cash Flow.
Between the years of 2006-2015, Caterpillar spent an average of 61% of its profits on its investment spending. 2016 spending fell to 3% of profits. In contrast, we are expecting the firm to gradually increase its investment spending over the next five years to return to a level of historical normality. We had originally forecast an investment spend of 10% of profits, but we have tweaked that number down to 0% due a continued slow-down in investment spending.
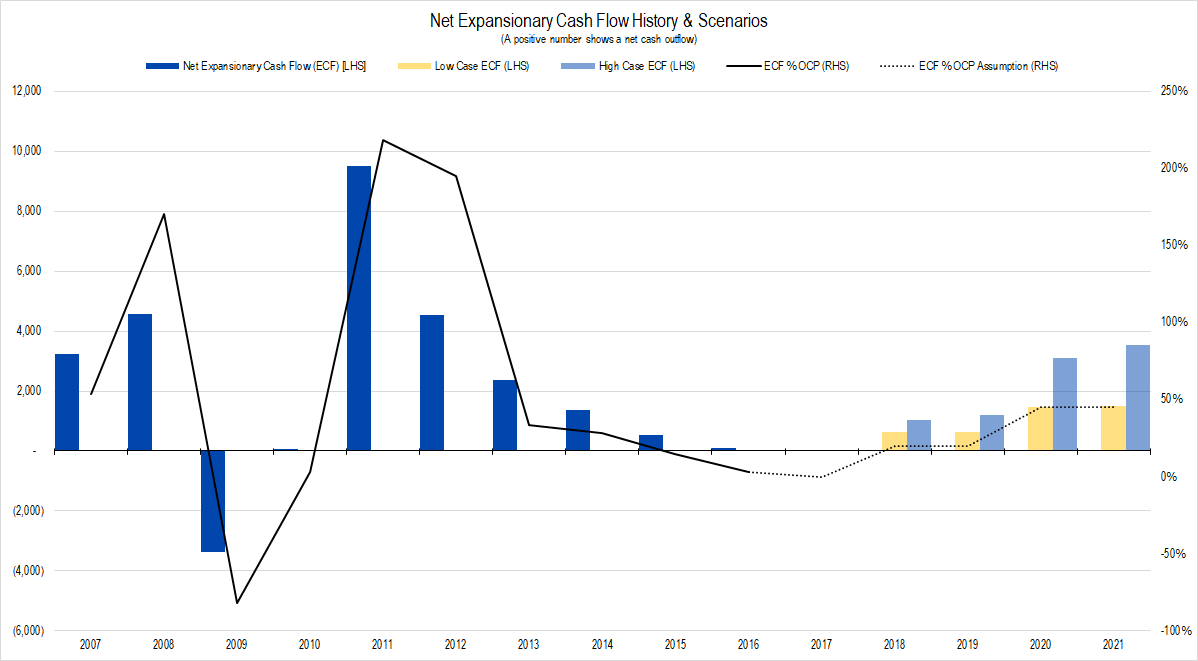
Figure 3. Source: Company Statements, Framework Investing Analysis
To wit, during the first nine months of the year, we estimate that Caterpillar actually increased its cash flow by about 47% through its investments (e.g., it generated more in sales of businesses than it spent in the acquisition of businesses and collected payments from distributors greater than the amount it loaned out). This means that our estimate of Caterpillar’s actual Free Cash Flow to Owners (FCFO) is higher than our estimate for OCP.
Because Caterpillar has held off on investments so far this year, we are brining our estimate for 2017 investments down to 0% of profits, compared to the 10% we had before.
While our FCFO projection is lower than the actual so far this year due to Caterpillar’s investment stinginess, we believe that our projections over the long-term are probably in the right ball-park.
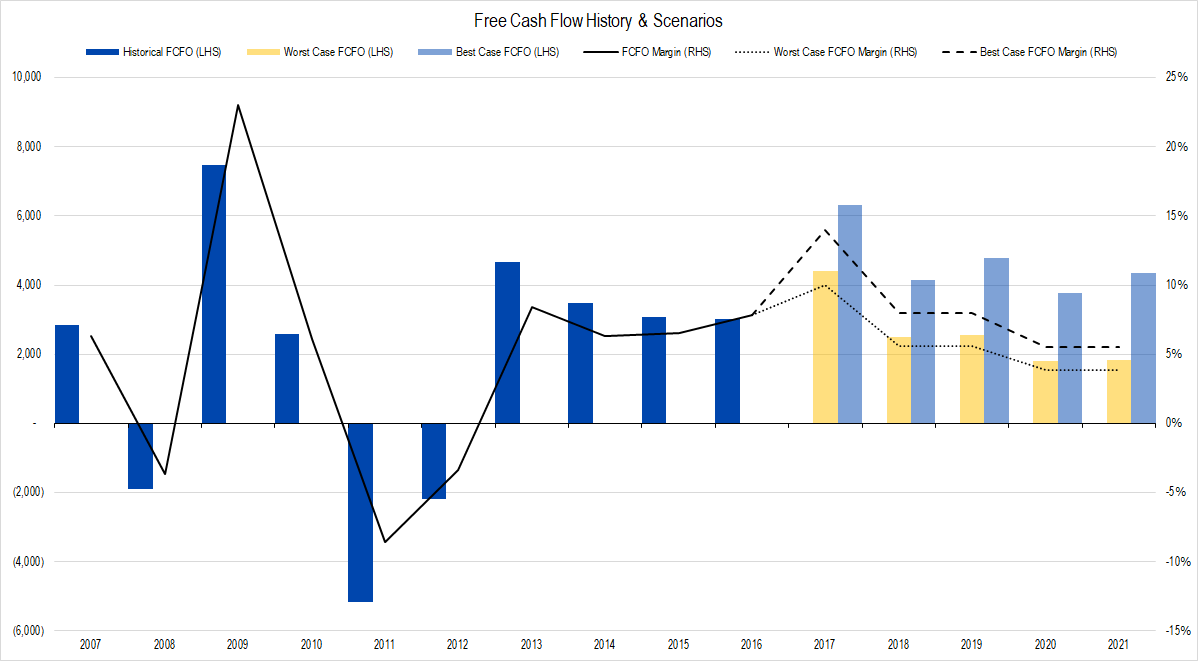
Figure 4. Source: Company Statements, Framework Investing Analysis
The sum of our model’s worst-case FCFO over the next five years is $12.6 billion and the sum of our best-case FCFO is $23.3 billion during this period. In contrast, the firm generated $12.0 billion of FCFO in aggregate over the last five years and $17.9 billion over the last 10 years that included a good bit of the Chinese boom.
Valuation
Our model takes a statistical look at historical patterns in Caterpillar’s growth and we still believe this pattern will hold going forward. As in our previous model, we do not believe that worst-case revenue growth in the short-term will be followed by worst-case FCFO growth in the medium term. Conversely, we also believe the combination of best-case short-term revenues followed by best-case medium-term FCFO growth is impossible, so we are leaving our medium-term assumptions as they are.
With our tweaks, our most likely valuation range is between $71 and $113 per share, with an equally-weighted average of these scenarios at $91 per share.
 Loading...