Framework’s latest project with the Superforecasters is related to an airline ETF and a major credit card company.
In the context of this project, one of the Superforecasters had a question about option pricing – a topic that I know many people are intimidated and confused by. In addition to my answer below, I included a few resources to show you enough in 15 minutes about option pricing to know more than the typical Chartered Financial Analyst (CFA) does.
A little background on the question: The Superforecaster group provides us their forecasts for some economic event happening by some time (e.g., Monsanto being acquired by Bayer by the end of 2018). I respond with the probabilities that the option market implies with its prices, as well as suggest some option strategies that might exploit any discrepancies. The Superforecaster posing the question, was interested in how the option pricing probabilities work.
The question of understanding option market probabilities and of an investor having some sort of an edge – whether that’s a valuation edge or a forecasting edge – gets to the heart of what we do at Framework Investing.
Question
“Are the probabilities provided linear with the price of the contracts? I think the probabilities are functions of current stock price, options cost, implied volatility, and date. I am just not sure how options price affects the probability. A 5% difference in probabilities between a January date and June date seems to be really small given that the stock is only 8% away from the strike price now. Can I also read that the price difference for the contracts is very small or is that reading the data too far?”
Erik’s Reply
In answer to Nate’s question, an option’s price are related to just a few things, a few of which are included in the option metrics that people call “The Greeks”:
- Relationship of Strike price (K) to stock price (S) (K / S)
- Risk-free rate of interest (Rho)
- Time to expiration (Theta)
- Dividend rate (no Greek here…)
- Expected volatility (“Vega” name of a crappy American car whose name sounds vaguely Greek)
Most of these things are pretty well known at the initiation of a transaction, except for “expected volatility.” Market participants thus look at the option’s price and infer what market expectations for volatility must be. That’s what’s known as “implied volatility.”
The “BSM Cones” that I show in my reports and presentations are a stylized representation of the assessed probability for a 1-standard deviation move in the stock; the technical definition of “implied volatility.”
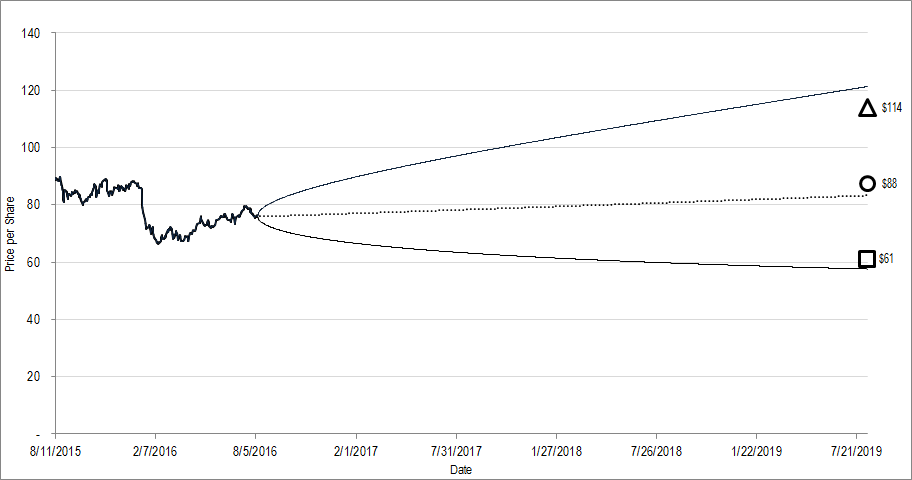
Figure 1. Source: YCharts, CBOE, Framework Investing (FWI) Analysis. Geometrical markers show FWI’s best-case (triangle), worst-case (square), and equally-weighted average value (circle). Cone-shaped region indicates option market’s projection of the company’s future stock price.
As that cone widens (i.e., expected volatility increases), options will become more likely to expire In-the-Money, so their price goes up. I’ve posted a 3-page PDF below that explains this in a more step-by-step way. You can also take a look at our YouTube series Options for Value Investors.
Yes – those probabilities are very close and because the prices (both stock and option) are changing all the time, the probabilities are only valid instantaneously. Prices should also be pretty close. There is something called the “volatility smile”, which means that prices don’t follow a linear pattern exactly, but that’s a little more involved and it’s not really that important for a positional transaction like this.
Here’s the PDF summary – feel free to send through a follow up if this explanation is not clear!
 Loading...