IBM, a firm that we follow closely and have invested in (usually with short puts and covered calls) over the past few years reported earnings for the first quarter of 2018 after hours.
The stock is down about 6% after hours and if the stock trades tomorrow at these levels (circa $150 / share) it would prove an excellent opportunity for investors interested in a bond replacement investment (i.e., short puts or covered calls) in the company.
As we point out in this video summary of bond replacement investments, investors do best when selling puts or covered calls when:
- The underlying stock is undervalued
- The option is sold At-the-Money (ATM)
- The option’s tenor is from three to six months
In our last bond-replacement Tear Sheet on IBM, published on April 11, I found that selling a put option expiring in July 2018 (100 days to expiration) and struck ATM (which was $155 / share at the time), had the potential to yield 5% period returns / 20% annualized returns and create an effective buy price in the $147 / range. Tomorrow, you will almost be certain to do better than that by looking at an ATM option expiring in August or September.
Earning Commentary
Revenues
As you can see in our most recent model for IBM, our revenue projections essentially key off of the growth of IBM’s “Strategic Initiatives” and the decline of IBM’s non-strategic businesses.
Our best-case revenue scenario assumes Strategic will grow at 12% year-over-year while Non-Strategic shrinks at 10% YoY, resulting in 0% growth. Our worst-case revenue scenario assumes Strategic growth of 5% and Non-Strategic shrinkage of 10%, resulting in IBM’s top-line falling by 2%.
The company reported that its Strategic Initiatives revenue increased by 12% YoY (10% when currency effects are removed) and that overall, revenues increased by 5% (flat when currency effects are removed). One quarter is not much of a datapoint, but clearly, actual results for the first three months of this year are closer to our best-case projections.
Over the past few years, IBM has generated actual results that have been fairly close to our own projections (though we were too optimistic about best-case revenue growth in our 2016 model).
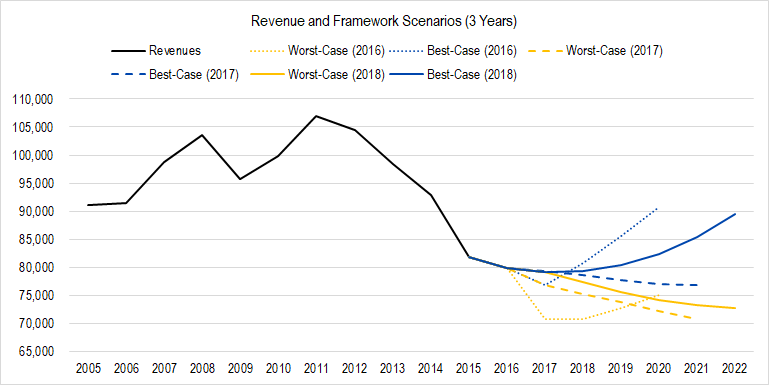
Figure 1. Source: Company Statements, Framework Investing Analysis
In the figure above, you can see that actual results through 2017 year-end have generally been closer to best-case projections than to worse-case ones. As the dust has cleared in IBM’s corporate restructuring and we have gotten more information about the size and “typical” growth for its Strategic Initiatives, we have begun to feel more confident that we have a handle on how IBM is responding to the demand environment.
Profits
Looking at commentary from analysts this evening, other investors seem worried about IBM’s gross margin. Why on earth for? Nothing matters except the amount of money that is available to owners at the end of the earnings generation process! Also, for you economics nerds out there, the Austrian economist Mises showed that the distinction commonly made between costs of good sold (which, subtracted from revenues yields gross profit) and operating costs (which subtracted from gross profit yields operating profit) is highly subjective to the extent that a distinction is not meaningful.
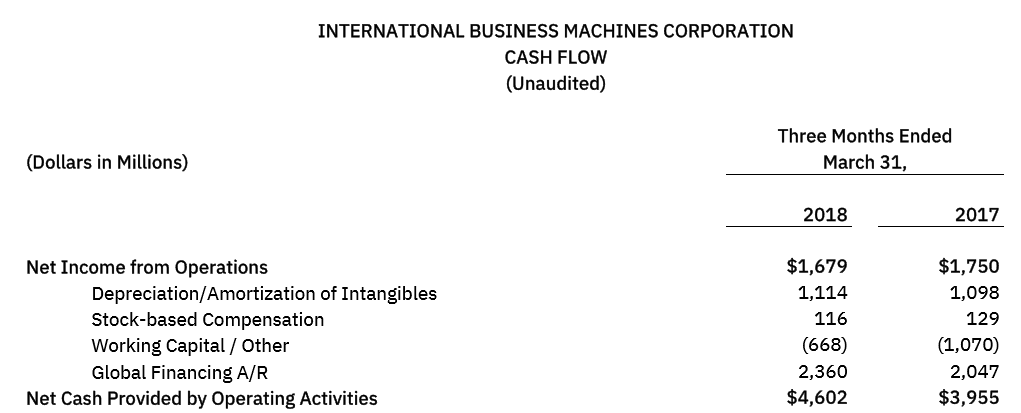
IBM just gives an outline of its Statement of Cash Flows, so we cannot offer more than an approximation for Owners’ Cash Profit (OCP) margin, but from what information is available, it looks like OCP came in at around $3.5 billion for the quarter, roughly 18% of the firm’s $19.1 billion in revenues.
Source: IBM Investor Relations
Our best-case projections for IBM’s OCP margins is 17% and our worst-case is 15%, so what looks like 18% OCP margins this quarter are again closer to our best-case projection.
Over the past two years, IBM’s actual profit results have consistently come in at or above our best-case projections as you can see from the figure below.
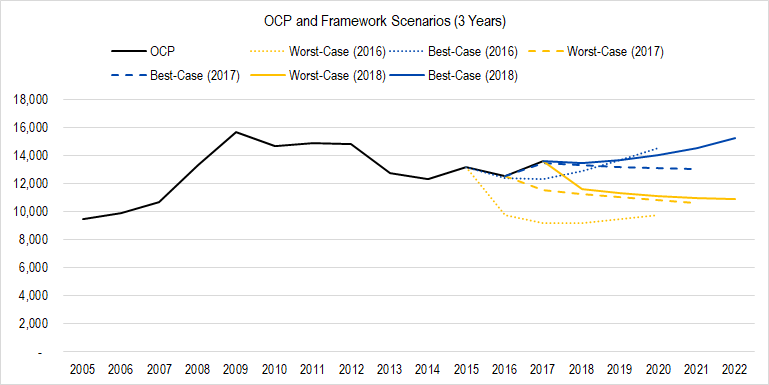
Figure 3. Source: Company Statements, Framework Investing Analysis
OCP is a pretty good estimate for the amount of profit to which the owners of a company can lay claim, and IBM has consistently been converting revenues to real profits with good efficiency.
Investment Spending
The amount of information IBM provides about investments when it releases earnings is sparse. We didn’t even bother trying to figure out what the company’s Free Cash Flow to Owners (FCFO) was on the basis of this announcement.
However, over the past few years, despite some large expenditures in 2016 which pushed FCFO down, IBM has generated FCFO in the range of our expectations, and in fact, closer to our best-case projections lately.
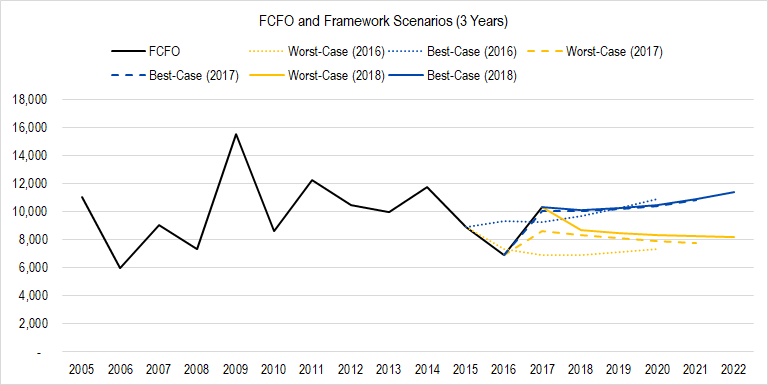
Figure 4. Source: Company Statements, Framework Investing Analysis
Valuation
If all of this sounds positive to you, you’re not alone. Certainly, I wasn’t worried when I looked at the numbers.
The firm did provide an EPS guidance which was lower than the Street had hoped for, and the Street may have also been spooked because IBM characterized its constant-currency revenue change as flat. Last quarter, the firm saw its first YoY revenue growth in some ridiculously long time, and it would not be strange if sell-side analysts simply extrapolated last quarter’s growth forward and were disappointed that reality didn’t meet with their extrapolated line.
The big uncertainty, which no amount of quarterly information will tell an investor, is what will the firm’s medium-term cash flow growth rate be. At present, we have forecast a best-case medium-term growth of 7% per year and a worst-case one of 2%.
If we assume that revenues and profits are going to continue to keep tracking our best-case projections and that only the medium-term growth is unknowable, there are just two valuation scenarios to which we should pay attention.
The best-case revenues, best-case profitability, worst-case medium-term growth scenario generates a valuation scenario of $184 per share.
The best-case revenues, best-case profitability, best-case medium-term growth scenario generates a valuation scenario of $219 per share.
There is one valuation scenario that lies below today’s price, that is worst-case revenues, worst-case profitability, and worst-case medium-term growth; from what we have seen, that scenario is increasingly unlikely.
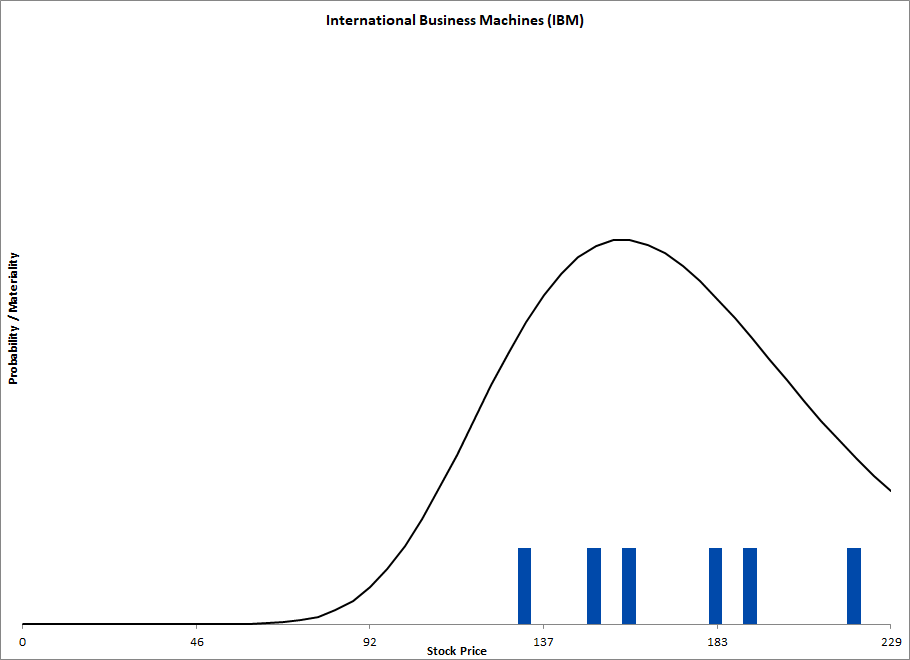
We will publish a Valuation Waterfall for IBM this week, but in the meantime, please refer to the “complex” valuation range diagram below.

