As I mentioned in my article summarizing Oracle’s FY 2018 results, I have started to be concerned at the increasing level of stock compensation at Oracle ORCL.
Over the last few weeks, I have been going back and forth with Ken Bond, Oracle’s Head of Investor Relations, digging into the firm’s issuance of shares as currency.
Issuance of shares to compensate employees or to buy other firms is, in our valuation framework, an important factor related to Free Cash Flow to Owners (FCFO). Many companies announce buy-back programs that, while billed as being “value creative” for investors, often serve the purpose of soaking up compensation-related dilution. For companies that don’t buy back stock, compensation-related stock issuance immediately dilutes an owner’s stake in the future cash flows of the company.
Ken has yet to get back to me regarding my last message to him, but I hoped you would enjoy reading through our exchange, and could pick out my line of reasoning from the conversation.
I will write another article and update my valuation model after I come to a clear understanding of this issue. In the meantime, have a read through our exchange — I have also linked a spreadsheet that contains these data.
Erik > Ken, Initial Mail
Ken,
Looking over Oracle’s FY18 10-K, it seems like the firm is issuing many more shares over the last two years than the previous eight. The imputed value of these shares has risen from an average of less than 3% of revenues to nearly 7% of revenues – a jump of about 144%. (Please see attached workbook).
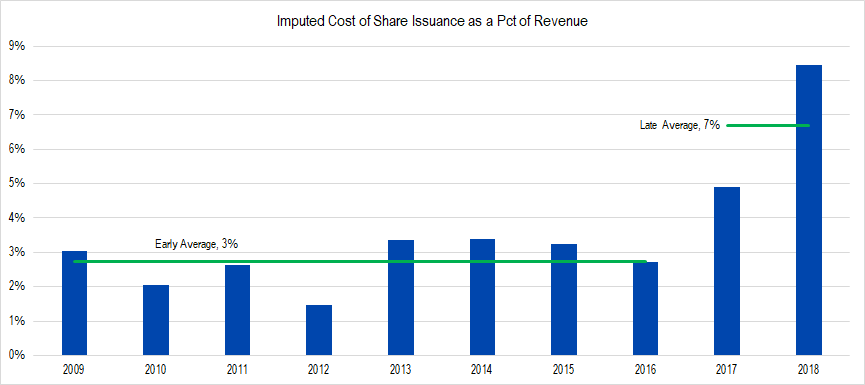
Figure 1. Source: Company Statements, Framework Investing Analysis
I’m interested in what strategic purpose this increase in share issuance fulfills and what Oracle’s policy will be with respect to issuance going forward.
To put in context, if Oracle had issued these shares on the open market and gifted the proceeds to employees as part of a compensation package, the grants would have been $3,368 million. If this expense flowed through Oracle’s income statement operating profits would have been 25% lower and net income, 88% lower.
If you could help me frame these numbers and understand this policy, I’d be grateful.
Best regards,
Erik
ORCL Imputed Value of Share Issuance
![]()
Ken >> Erik, Initial Mail
Erik –
Thanks for sending this. I tried calling you, but you were not available. Rather than leave a long voice mail, I’ll respond to your note
The reason you’re seeing the patterns you describe is largely due to our recent usage of restricted stock units (RSUs) which began in FY14. Prior to FY14, almost all employee equity compensation was in the form of employee stock options (ESOs). The accounting treatment for these two forms of equity compensation (ESOs and RSUs) is different and affects the data you’ve focused on.
In the case of ESOs, shares are included in the equity and cash flow statements at the time the employee exercises their ESOs. In the case of RSUs, the shares are included at a rate of 25% of the initial grant for four years.
So in FY15, we saw 25% of the FY14 grants included . . . and in FY16, we saw 25% of the FY15 grants included, PLUS the second tranche of the FY14 grants included . . . and in FY17, we saw 25% of the FY16 grants included, PLUS the second tranche of the FY15 grants included, PLUS the third tranche of the FY14 grants included . . . and in FY18, we saw 25% of the FY17 grants included, PLUS the second tranche of the FY16 grants included, PLUS the third tranche of the FY15 grants included, PLUS the last tranche of the FY14 grants included. Not surprisingly this creates the optics of an increasing stock compensation as only in FY18 do we finally include four separate tranches. As we go into FY19, we’re now into the 5th year of vesting such that each year going forward will only include four separate tranches.
In our financial statements, you will find discussion around the maximum potential dilution stemming from employee equity compensation. I think this discussion is more meaningful as it’s fully inclusive of employee equity compensation granted and not just the limited amounts included in the financial statements. Looking at the trends, you’ll see that the maximum potential dilution as a percent of the shares outstanding has increased from 7.2% in FY09 to 9.8% in FY18 . . . however, most of this increase stems from the absolute shares (the denominator) being 17% lower over the same period . . . meaning there isn’t as much an increase as it would first appear.
Then lastly is the consideration of the employee base which has grown from 86K employees in FY09 to 137K in FY18, or 59% increase which is somewhat lower than the 71% revenue increase. In sum, this suggests employee equity compensation has been declining on a per employee basis, which is found more directly in commentary around grant dilution trends going downward.
Apologies for the late response, but hopefully you can see the answer involves a number of considerations around timing, type of compensation, and employee counts.
Regards,
Ken Bond
SVP Oracle
Erik >> Ken, Exchange 2
Ken,
Thanks again for your note from the other day!
When I read your response, I thought that I had missed something in my own count, so went back and compared numbers in two parts of the financial statements – the Consolidated Statement of Change in Equity and the Stock Comp Note. It looks to me that I’m capturing the correct data; I use the Statement of Equity numbers, which capture both stock issuance due to option exercise and ESOP issuance:
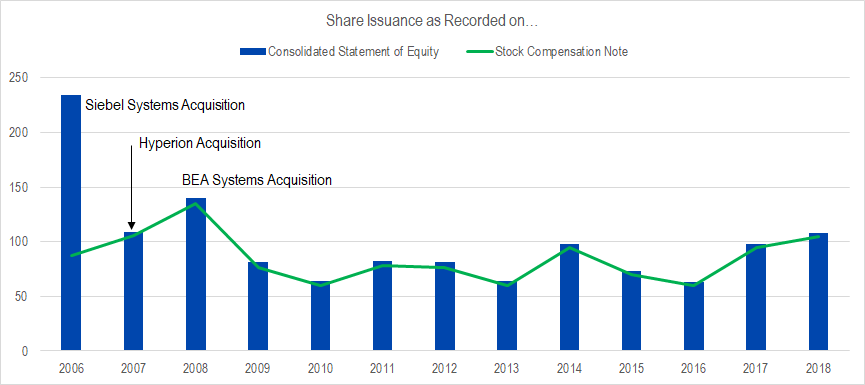
Figure 2. Source: Company Statements, Framework Investing Analysis
Here is what I see and am confused about. Post the late aughts’ acquisition spree, from 2009-2016, the median number of shares issued as compensation was 77mm. The firm issued 98mm in 2014, but then sank lower for two years.
In contrast, for the past two years, Oracle has issued 98 and 108mm shares – equal to or more than the previous max issuance and 30-40% higher than the 2009-2016 median. Not only was share issuance higher, but the stock price was higher, so the imputed cost of this issuance exploded.
From this observation, I have two questions:
- I suspect this additional issuance represents the added compensation costs of the IaaS initiative. Is that a correct assumption?
- Is this new, higher level of issuance the new normal?
Oracle is buying back shares, it’s true, but a material portion of these buybacks go toward countering the effect of compensation-based issuance. In my mind, this imputed cost should be counted as a deduction from cash available to owners since wealth is being transferred to employees as compensation.
Thanks again for your help!
All the best,
Erik
Ken >> Erik, Exchange 2
Erik –
Please take another look at my note as I was not questioning the accuracy of your data, but suggesting you were not being fully inclusive as there are shares granted to employees via options and RSUs that have not yet been issued.
Because there is a timing difference of issuance between options and RSUs, you’ll want to think about that as I suggested in my note to you.
Regards,
Ken Bond
SVP Oracle
Erik >> Ken, Exchange 3
Ken,
Thanks for your quick reply. I understood your mail, but worried that maybe I had missed something. I can see the shift toward relatively more RSUs over the past several years, and understand the whole vesting process and how that builds over time.
However, whether shares are issued due to option exercise or to RSU granting, those shares all become shares outstanding that need to be bought on the open market in your buyback operations.
It looks like Oracle has made the decision to issue on the order of 30-40% more shares per years (the difference between the 77mm median over the years mentioned vs. 98mm and 108mm over the last two years).
In the note, I am simply counting the number of RSUs vested and issued, then adding that to shares issued due to option exercise. That number agrees with the figure on the Statement of Equity for the compensation portion, then I’m adding ESOP shares and any shares issued as currency for acquisitions, etc. My count, in other words, is agnostic to grant mechanism…
So, I would like to pose the same two questions as before: Does the pick-up in issuance have to do with the IaaS buildout and will this level be the new normal level of stock issuance going forward?
Thanks for helping me understand this!
All the best,
Erik
Ken >> Erik, Exchange 3
Erik –
I think there’s still some confusion, but to answer your question . . . no. The increases you’re pointing to largely stem from Oracle’s introduction of RSU compensation for employees coupled with the timing differences in issuance between RSUs and stock options.
Hopefully that will help, but your subsequent messages suggest you’d already made up your mind what you wanted to write. I hope you’ll take another read on my note as your conclusion is drawing misleading conclusions by not taking into consideration the impact of changing compensation practices.
Regards,
Ken Bond
SVP Oracle
Erik >> Ken, Final Mail to Date
Thanks for your mail last night and apologies I couldn’t respond until today. I was in the air when you sent it, and didn’t get home until late last night.
I’ve gone back and re-read your mail regarding vesting. It may not be perfect, since I’m not sure of cancellation dynamics, but assuming that the firm continues to grant 44mm RSUs per year (last year’s value – which includes a full four granting periods), and that 25% of grants are canceled, I end up with the following table:
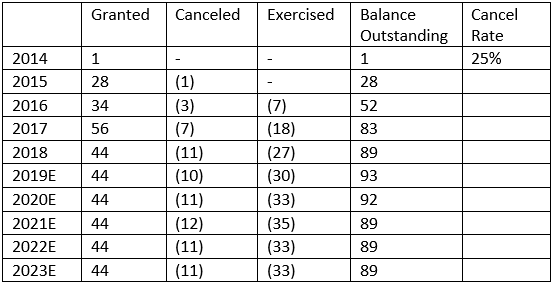
Table 1. Source: Company Statements, Framework Investing Analysis
This simply assumes that one-fourth the number of RSUs granted in each prior period vest each year for four years cumulative less the cancel rate assumption of 25%. There were a large number of assumed grants in 2017 – from an acquisition, I imagine – and that is likely to affect the cancelation rate. It seems likely that after the 2017-vintage grants cycle out of the system in 2022, the cancelation rate will change, but this is a simplified model.
I believe that this table faithfully represents the dynamics about RSU grants that you laid out in your previous mail, but if I’ve misunderstood something, please do let me know.
Assuming my estimates above are correct and that Oracle issues 77.5mm shares per year through option exercise (this is the average of the last two years and just 4.5mm higher than the median of the 8 years previous to that), I come up with the following graph:
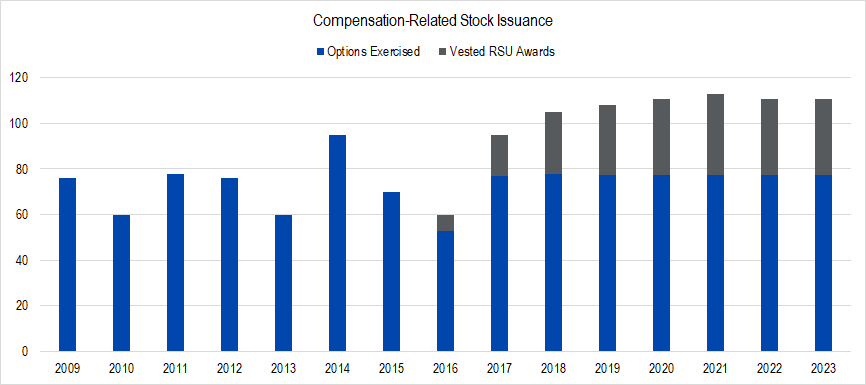
Figure 3. Source: Company Statements, Framework Investing Analysis and Projections (2019-2023)
If all of my estimates are accurate in the main, average stock issuance over the next five years (110.5mm) will run at roughly 50% over the median value of 73 from 2009-2016. This is a big difference! Over the last three years, Oracle has bought back an average of 199mm shares per year, so the projected issuance represents over half of the recent average buyback.
Thanks for the reference to the maximum potential dilution discussion – I found that section helpful as well.
As to your mention of employee count versus stock issuance, I had never thought of it in those terms, so decided to run the correlations. I found negative correlation for the full series:
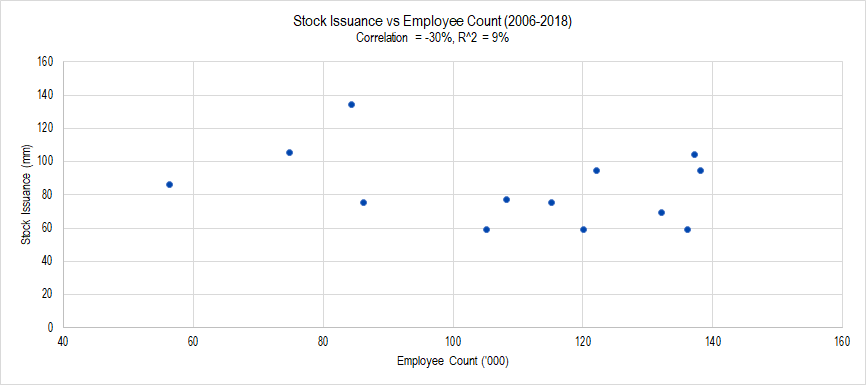
Figure 4. Source: Company Statements, Framework Investing Analysis
But knew that those data included acquisition-related outliers, so ran the correlation again during the period of subdued issuance from 2009-2016. Here’s that graph:
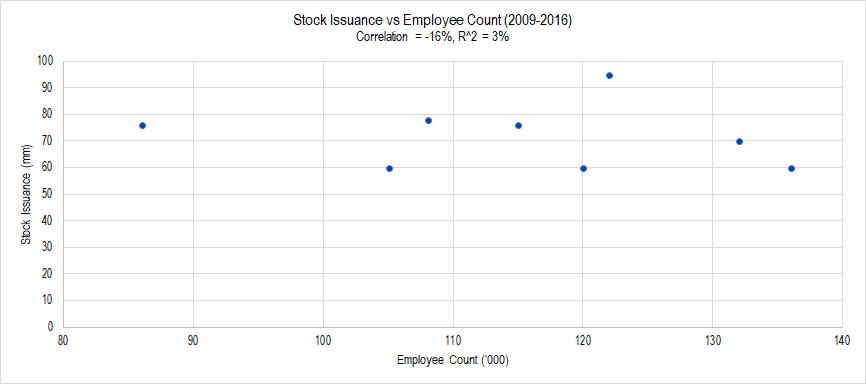
Figure 5. Source: Company Statements, Framework Investing Analysis
The statistical significance may be low due to the small sample size, but just charting the data makes me think that the low r^2 likely represents the true explanatory power of the relationship. In short, it does not seem that share issuance is related to employee count.
I am, at the end of the day, more interested in understanding than writing. If I understand correctly, then I will allocate my resources well and know how to advise others. Thanks for helping me understand correctly!
So, assuming these calculations are accurate, I’ll pose my two questions again:
- I suspect higher issuance levels represent the added compensation costs of the IaaS initiative. Is that a correct assumption?
- Is this new, higher level of issuance the new normal?
Many thanks again for your help in understanding this important dynamic!
All the best,
Erik
