The Netflix model we posted the other day has a lot of moving parts in it, so we thought we would take each bit step-by-step to show you our thinking process behind the valuation model.
In our Framework 102 course on Valuation, I emphasize that revenue generation is the effect of individual purchase decisions made by individual customers every day. When possible, it is good to get down to this level of detail when trying to understand revenue dynamics. Luckily, Netflix offers enough data in its financial statements to make this drill-down possible.
Specifically, the firm offers statistics on subscriber numbers and, of course, on revenues. With these two numbers, we can back out average prices paid, so we have the two critical components of revenue: price and quantity.
Subscriber growth at Netflix has been phenomenal.
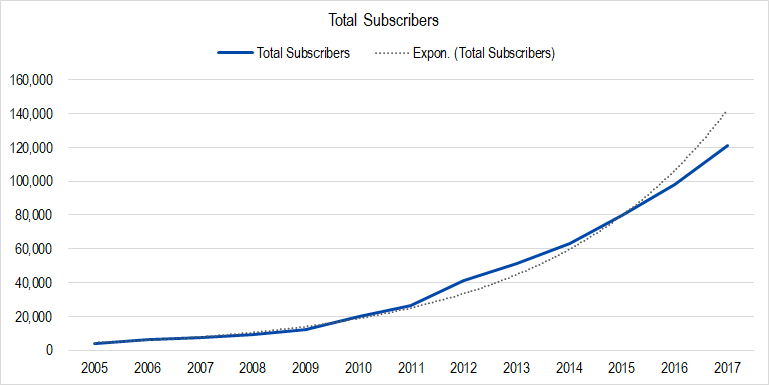
Figure 1. Source: Company Statements, Framework Investing Analysis
The grey dotted line in Figure 1 represents an exponential trendline and you can see how closely the actual subscriber count tracks that trend. In other words, Netflix revenues tend to grow faster the larger they get!
In the Framework Valuation Model for Netflix, we have looked at year-over-year changes in customer count as one of the drivers of our revenue model (see the “Revenue Model” tab).
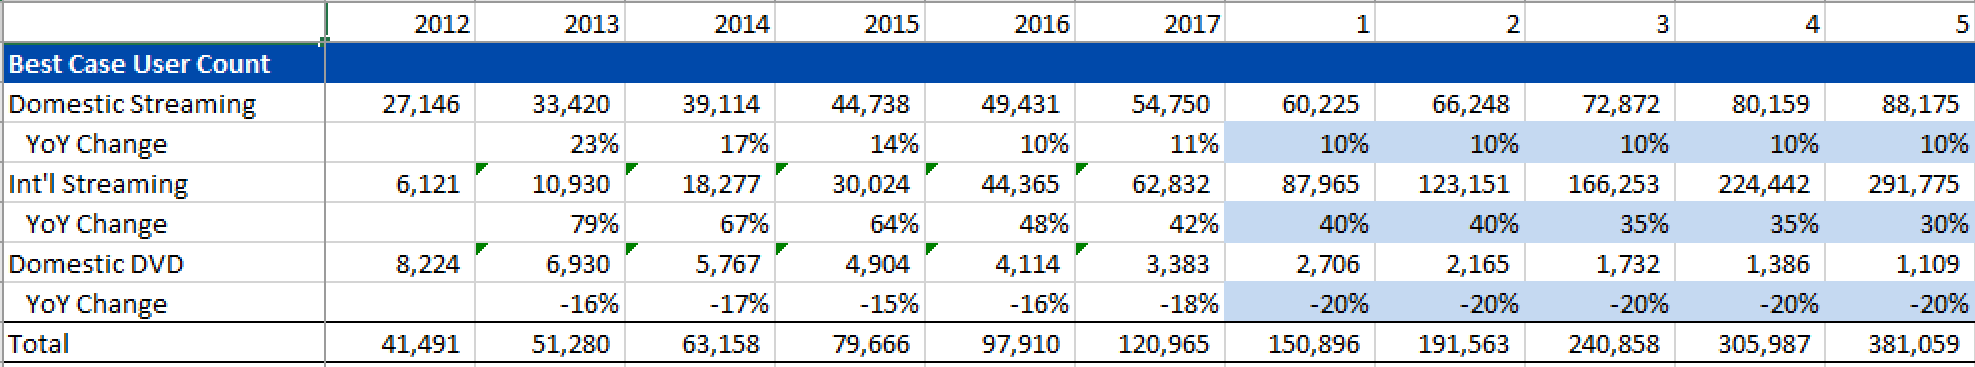
Looking at the numbers here, you can see that 1) Netflix’s overseas business is expanding very quickly and 2) the business still sends out DVDs to rental customers in the U.S. — Netflix’s old business model.
It’s worth mentioning that when we modeled Netflix, we just eyeballed historical numbers and tried to make sensible forward projections. It might be worth looking at the details of the overseas markets (e.g., likely size of national or regional markets, penetration rates, etc.), but as this was our first pass at this, we did not go into those details.
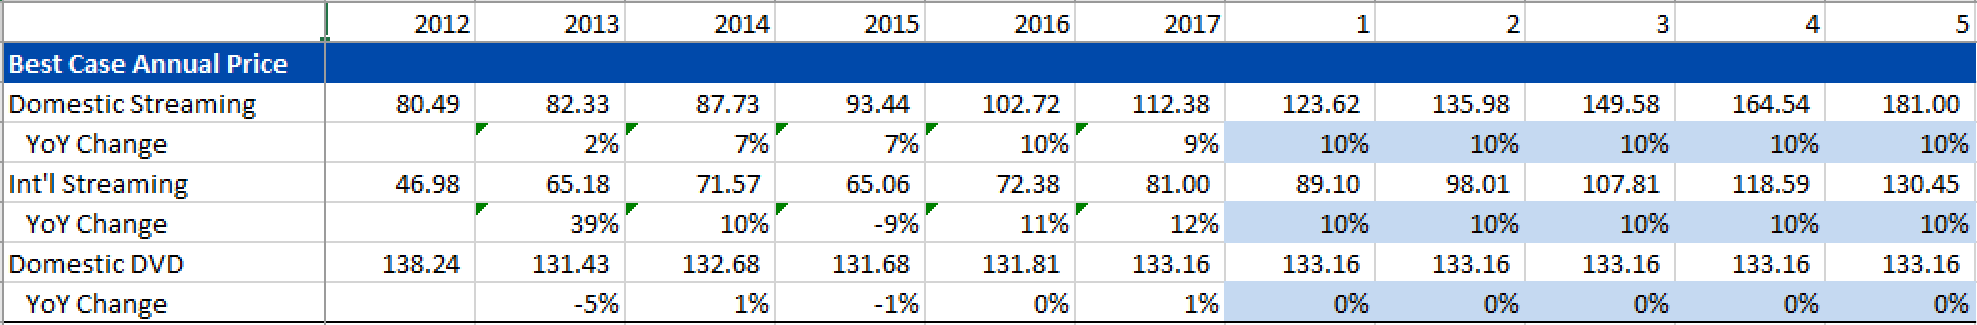
Because we have revenues for each segment, we can back out average annual revenues generated per customer. The statistic calculated this way will be different from the “ARPU” (Average Revenue Per User) number that Netflix announces. Specifically, it will be lower, since not all the new user growth occurs on January 1 of each year. Be that as it may, we can still look at the trends from year-to-year and eyeball some projections.
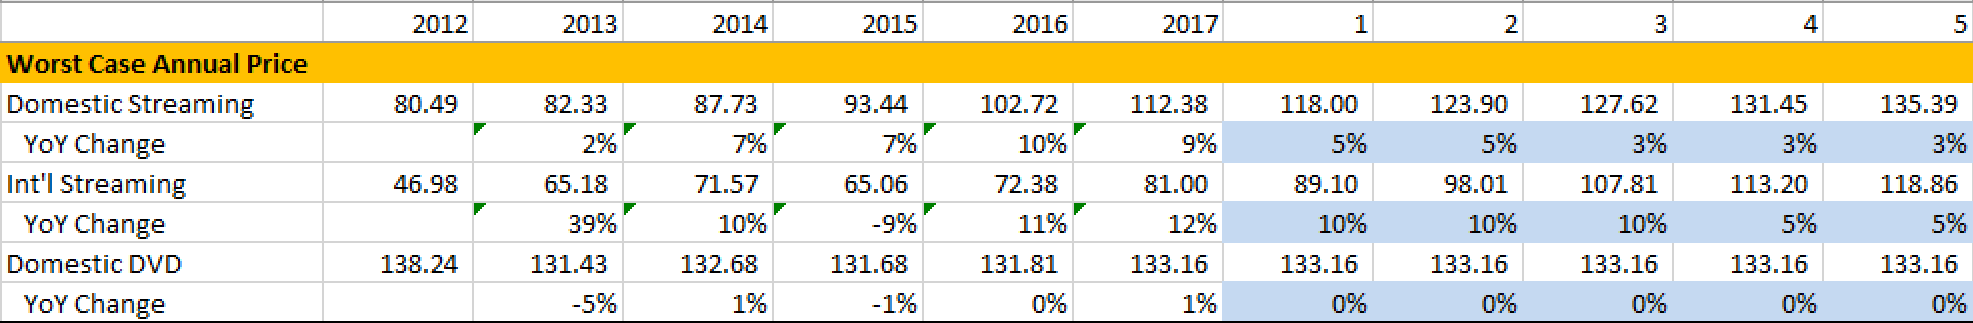 Again, with the above projections, we have simply eyeballed historical numbers to create our forecasts. Our best-case assumption implies that Netflix is able to continue penetrating its target markets pretty much unopposed and will retain a high level of demand even with fairly large yearly price increases.
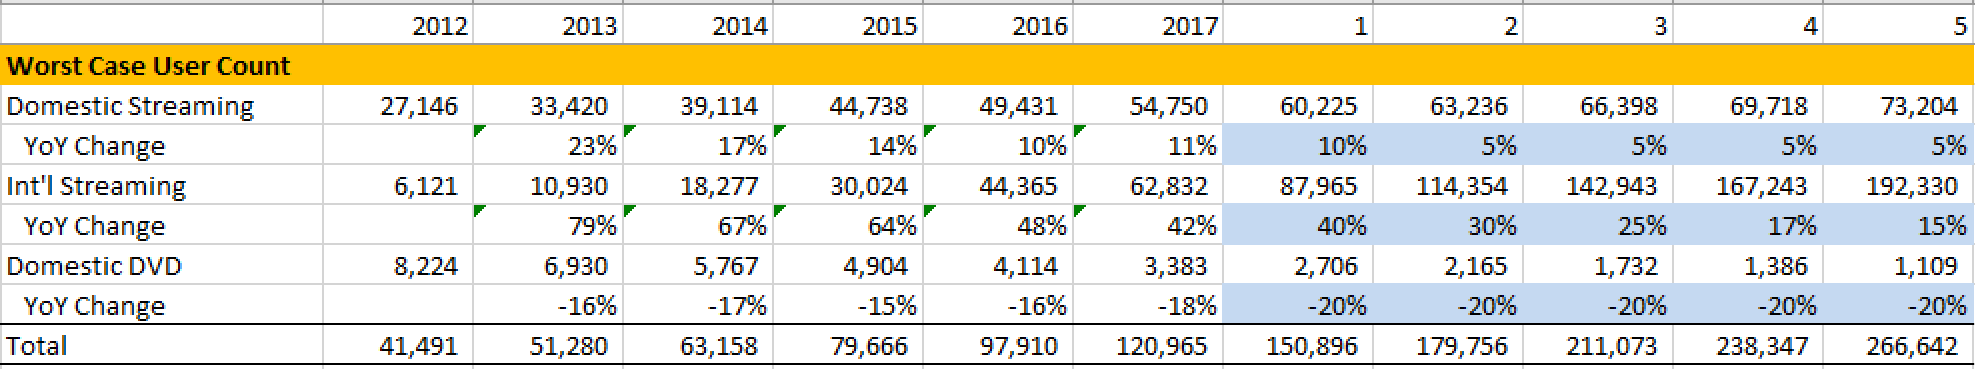
Our worst-case assumption is that other studios such as Disney and Sony will start competing head-to-head against Netflix domestically and eventually internationally as well, causing a reduction in pricing power.
Once we settle on these projections, we can simply multiply price by quantity to come up with revenue projections.

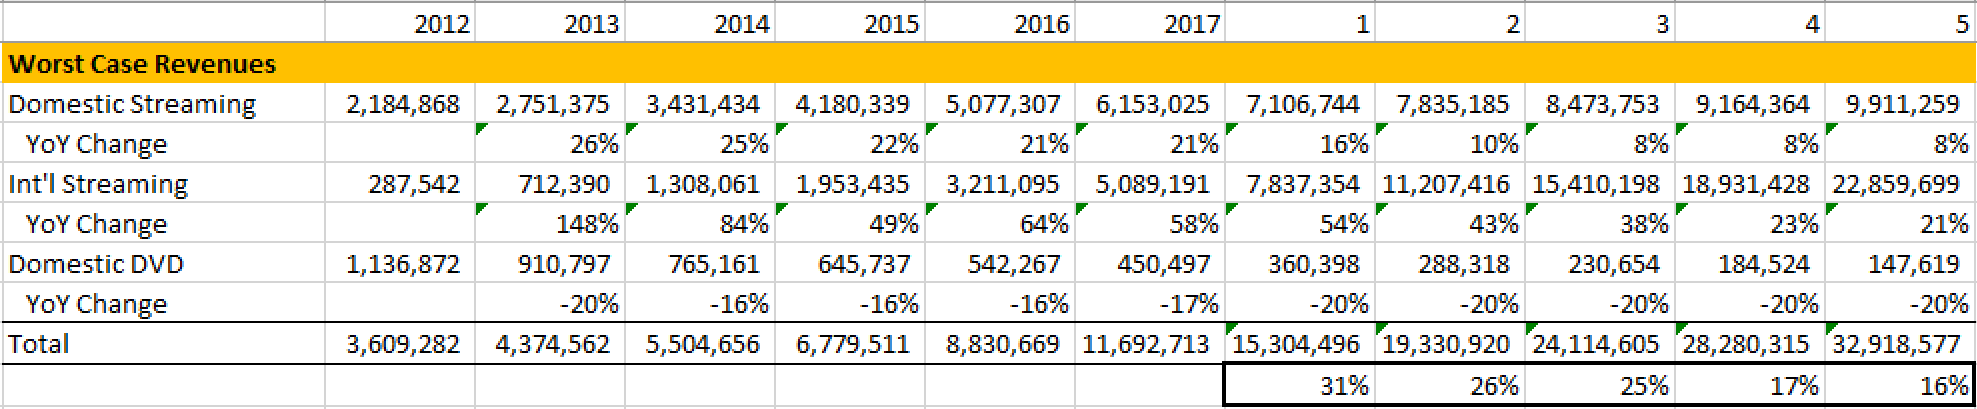 The percentage change figures you see within the thickly lined box are calculated ones. These are the figures that are tied back to our “Model” tab and which form the basis for the projections for our first valuation driver: Revenue Growth.
Now is a good time to take a sanity check, and this is where we used Disney as a handrail. Here is the graph representing our revenue assumptions for Disney’s studio business.
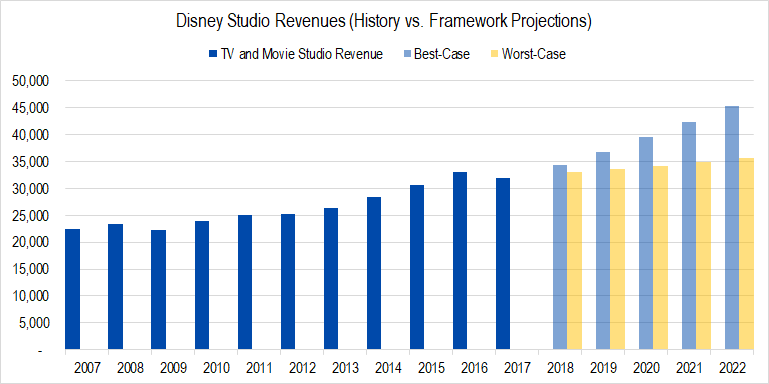
Figure 2. Source: Company Statements, Framework Investing Analysis
What do you notice about these numbers?
Comparing our projections for Netflix to our projections for Disney, the first thing I noticed was that our best-case projections imply that Netflix will be generating about $9 billion more from its studios than Disney is from its in five year’s time.
Worst-case projections still imply Disney will be the larger company, but only just barely.
Whether or not Netflix could grow to generate more revenues than Disney in five years is open to debate, but it seems far-fetched to me. (If one of you have a different opinion about this, let’s discuss in an Office Hour session.)
Given this triangulation, it seems like Netflix’s actual revenues will be closer to our worst-case projections. This would be the hypothesis that one could test going forward, along with our hypotheses regarding subscriber growth and pricing power.
In our next article on Netflix, we will walk through our assumptions for the second valuation driver: Profitability. Stay tuned!