When I checked prices this morning, I was surprised to see Kroger’s KR stock price had taken an enormous hit.
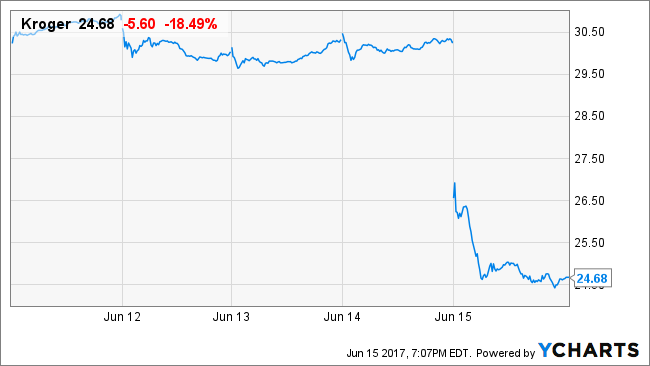
Figure 1.
Having done a full valuation of Kroger in July 2016 and knowing this is a well-run company, I thought there might be an opportunity for a lucrative bond-replacement investment (e.g., selling a put or a covered call) in the shares.
However, when I took a careful look at the valuation, I realized that my previous operational assumptions had been observably far too optimistic. Changing Owners’ Cash Profits (OCP) assumptions, generated a weighted average valuation scenario of $24 per share – about where the price is presently trading.
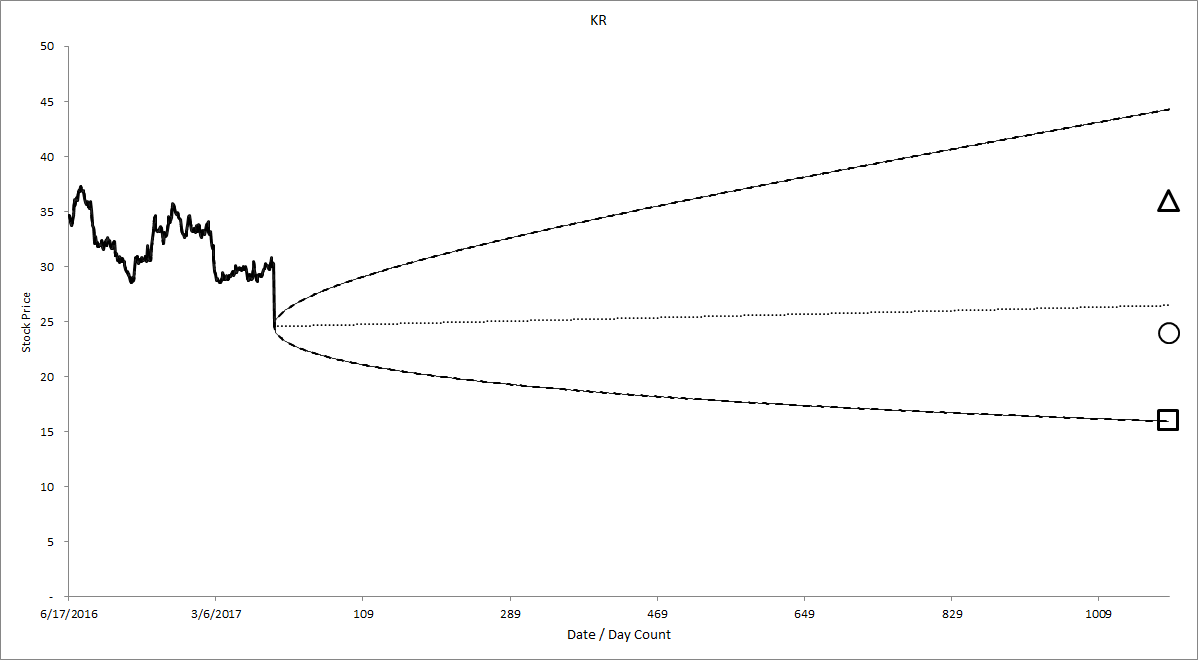
Figure 2. Source: CBOE, Framework Investing Analysis
With the BSM Cone overlapping our valuation range, there is not an opportunity for an investment that would tilt the balance of risk and reward in our favor.
In fact, even this lowered valuation might be too optimistic, depending on how much the firm has to spend on investments over the next few years.
Let’s look at what I got wrong with our original valuation.
Profitability
Here is my original profitability forecasts for the company. Dark blue columns represent actual OCP, light blue columns represent best-case forecasts and yellow columns, worst-case. Actual values are read off the left-hand margin. The black line shows OCP margin and is read off the right-hand margin; dashed line is best-case, dotted line is worst.
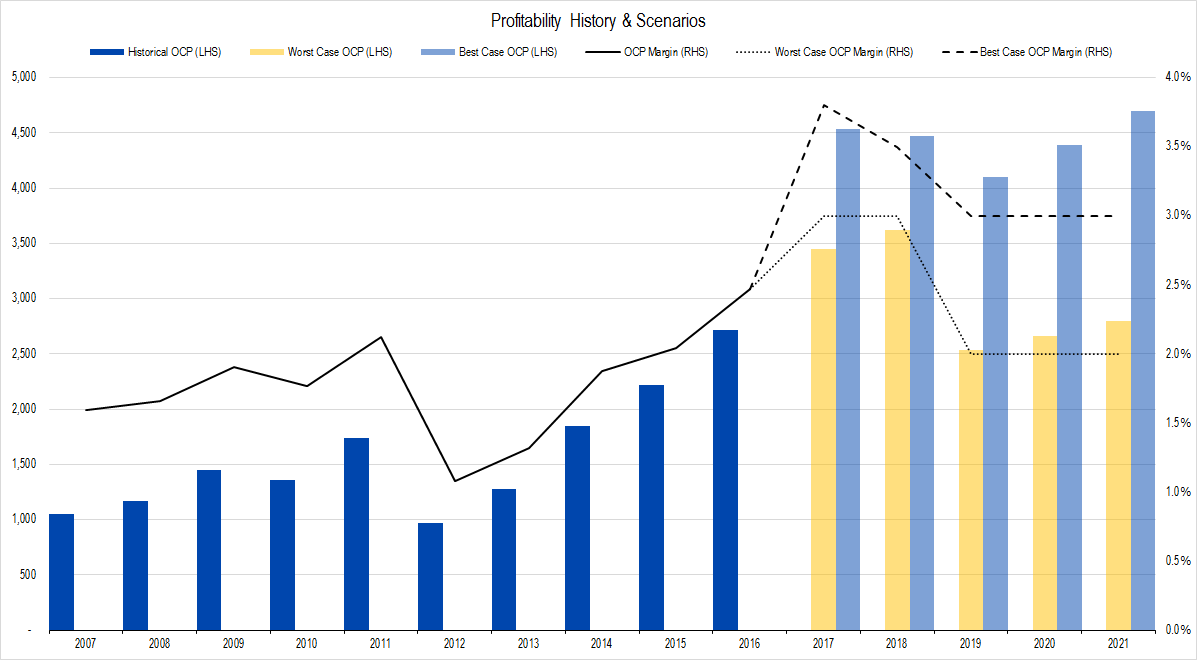
Figure 3. Source: Company Statements, Framework Investing analysis
I analyzed Kroger’s financial statements in July, so had access to the annual report for the company for the fiscal year ended in January 2016 as well as the first quarterly report for FY 2017.
The annual OCP trend had been upward and the first quarter OCP was an astounding 3.8% (believe me – that’s astounding for a grocery store). As such, I set the best case profitability at 3.8% and assumed that over time the profitability range would settle between 2.0% and 3.0%.
Here is the chart with the actual FY2017 value and my new profitability assumptions.
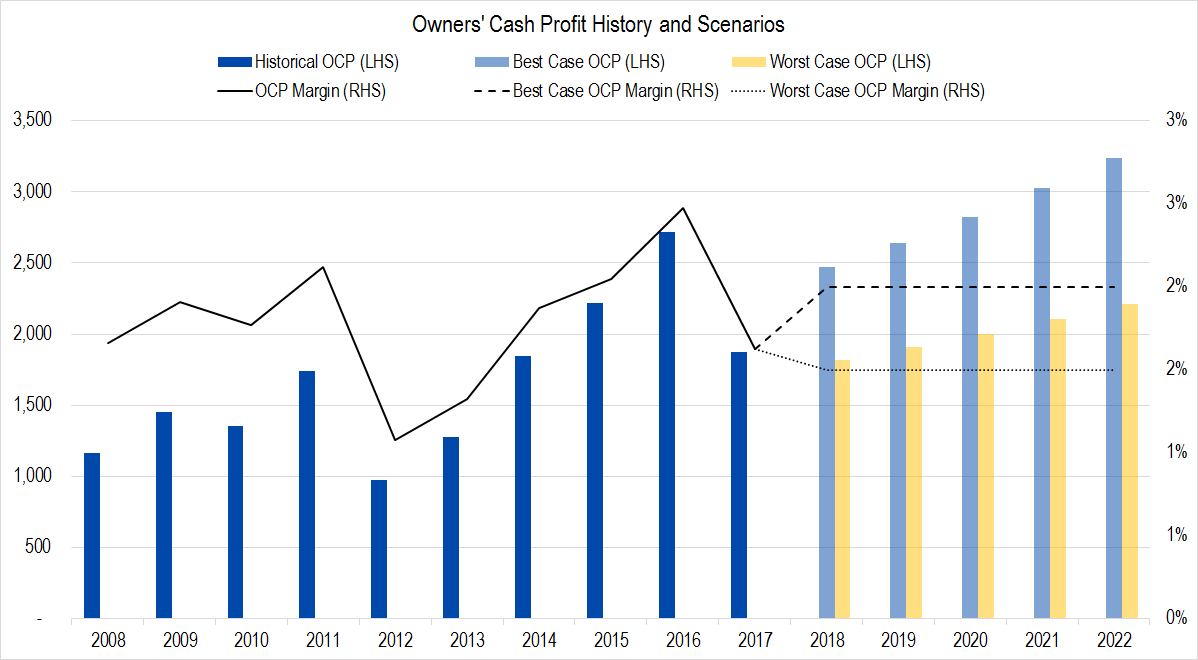
Figure 4. Source: Company Statements, Framework Investing analysis
Note that the actual value for 2017 was a complete reversion to the earlier range and was much lower than even my worst-case scenario.
Surprised by the about-face in profits, I pulled together an OCP Step-Through chart to figure out the root cause of the drop in profitability.
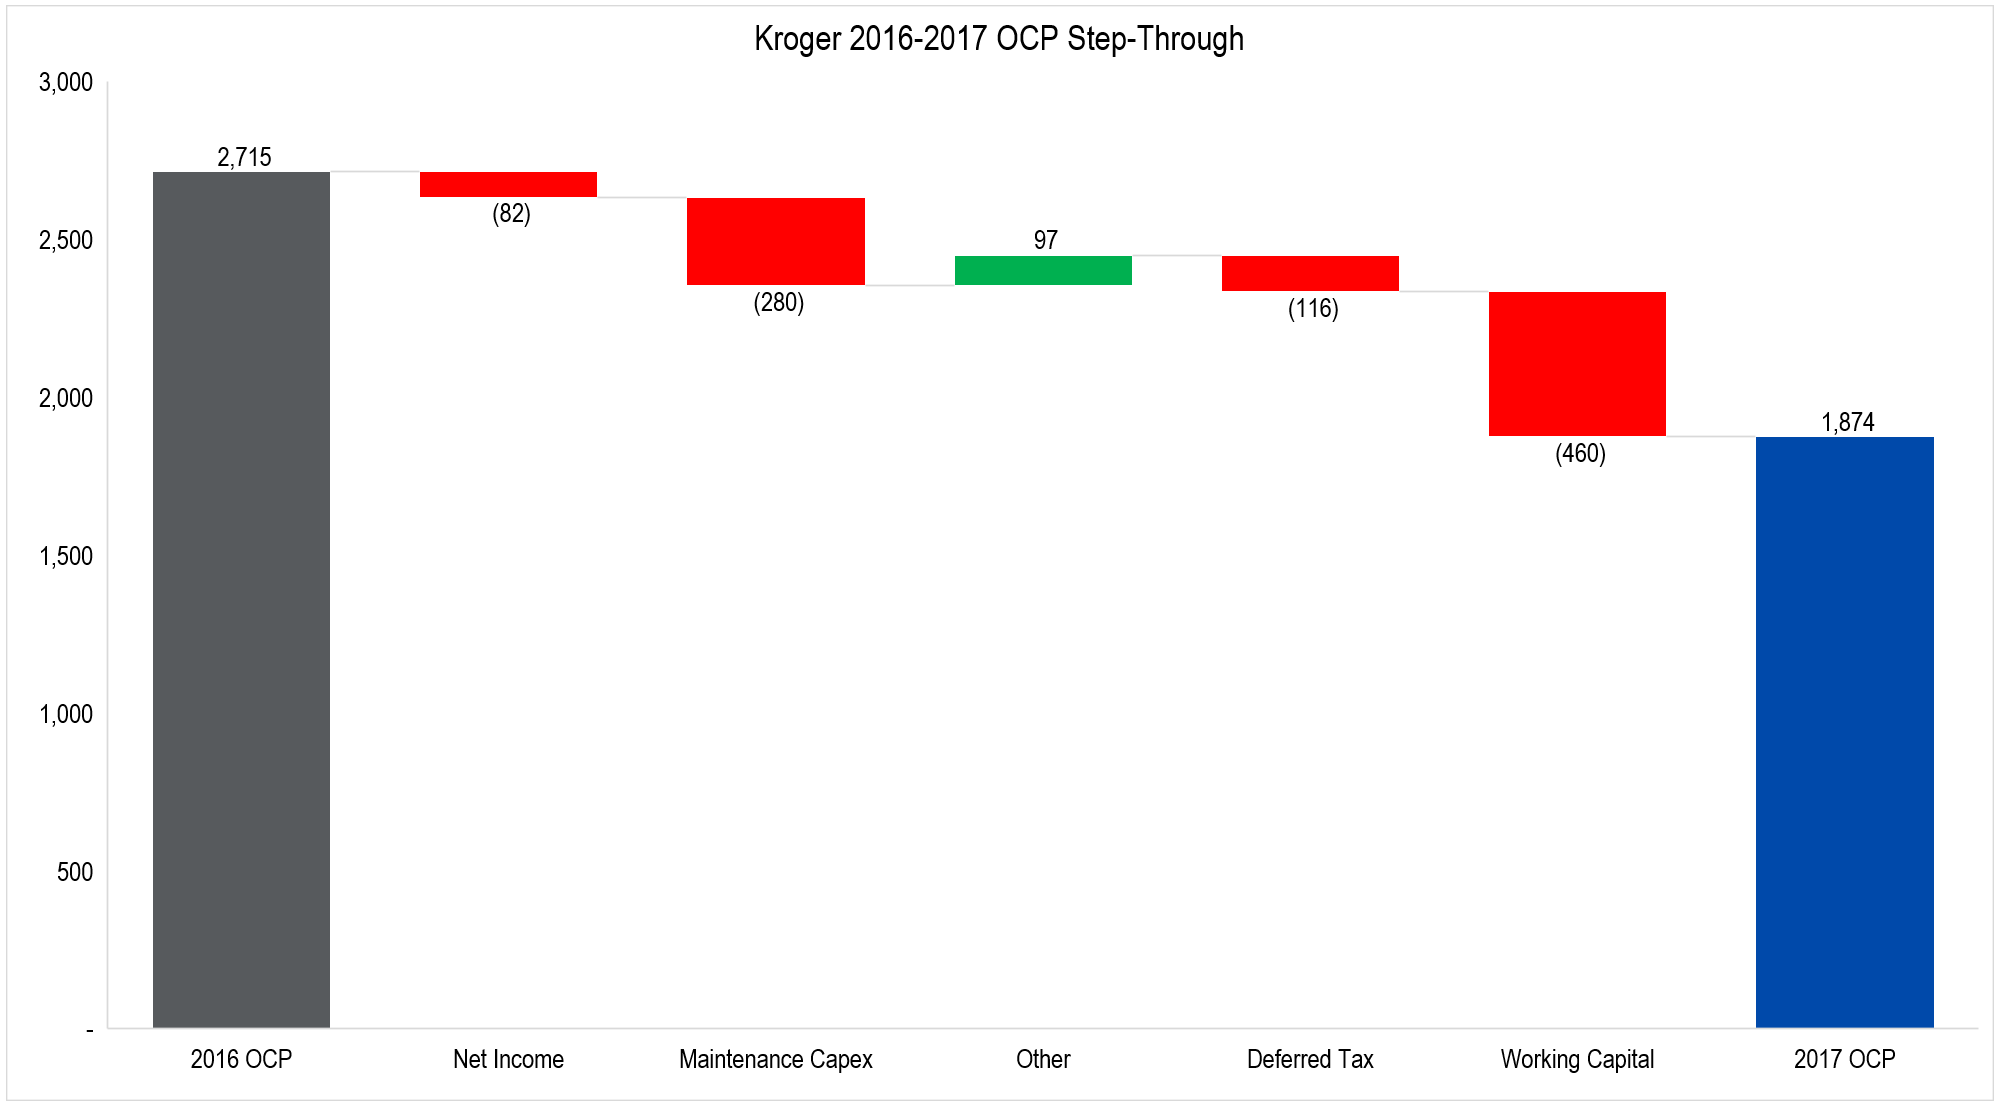
Figure 5. Source: Company Statements, Framework Investing analysis
The two most notable decreases were generated by changes in the amount of capital needed for maintenance and an increase in cash spent on building working capital.
We think that both these categories are probably due to Kroger’s high level of acquisitions over the past few years. We are less worried about the working capital – that is likely to reverse in the future – but the increasing expenditure on maintenance capex is worrisome if not accompanied by an increase in revenues. 2017 revenues were up by roughly 5%, but our assumed expenditures for maintenance capital expenses was twice that: 10%.
The change in Net Income is likely related to deflation and its effects on gross margin (gross profits divided by revenues; gross profits = revenues – Cost of Goods Sold). We can see that clearly in our long-run chart comparing gross margin to OCP margin.
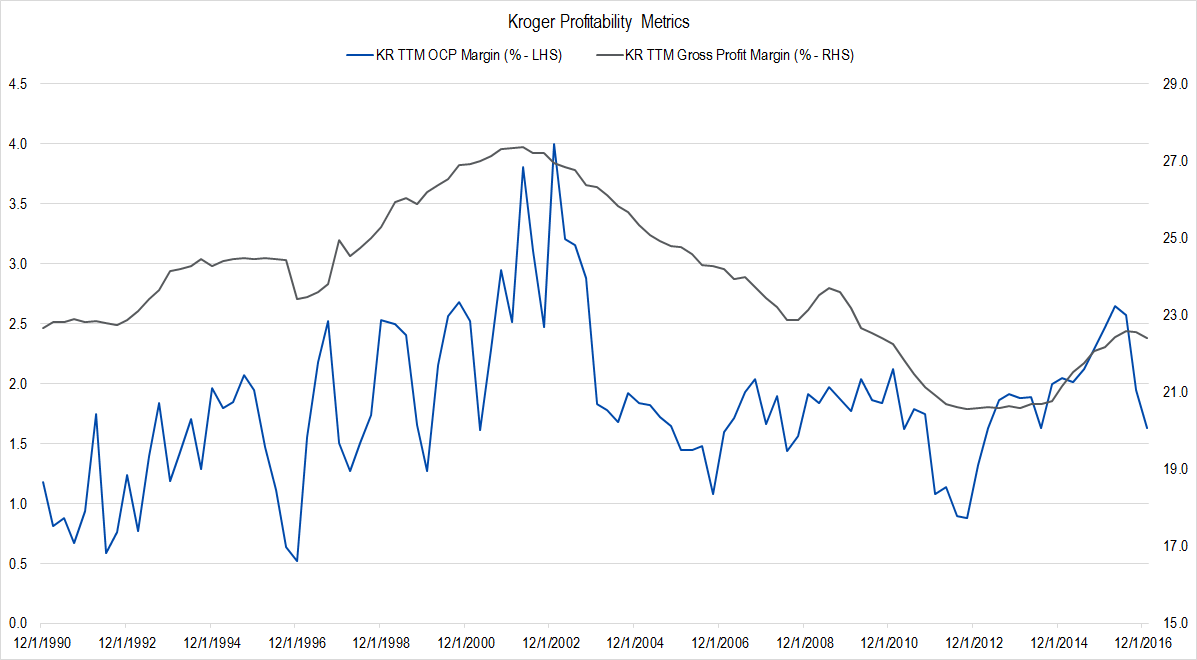
Figure 6. Source: Company Statements, Framework Investing analysis
Kroger’s large investments over the past four years look to be affecting its ability to control maintenance costs and to manage working capital. If this effect is temporary, Kroger would likely be a fairly good investment at this price. However, if profitability is durably lower – having reverted towards its prior mean in the 1.5%-2.0% range – the shares are roughly fairly valued at this price. Without access to in-depth industry knowledge, we think that a “reversion toward the mean” argument is more likely than a “conditions are permanently improving” argument.
Investments
Our original model estimated long-term investments as a percentage of profits at a level of roughly 50% – the firm’s 10-year average as of the end of 2016 and the same as Whole Foods Markets WFM and Wal-Mart’s WMT spending level as well.
However looking at a chart of investment spending as a percentage of profits at the end of 2017, we see that the firm continued to spend heavily last year.
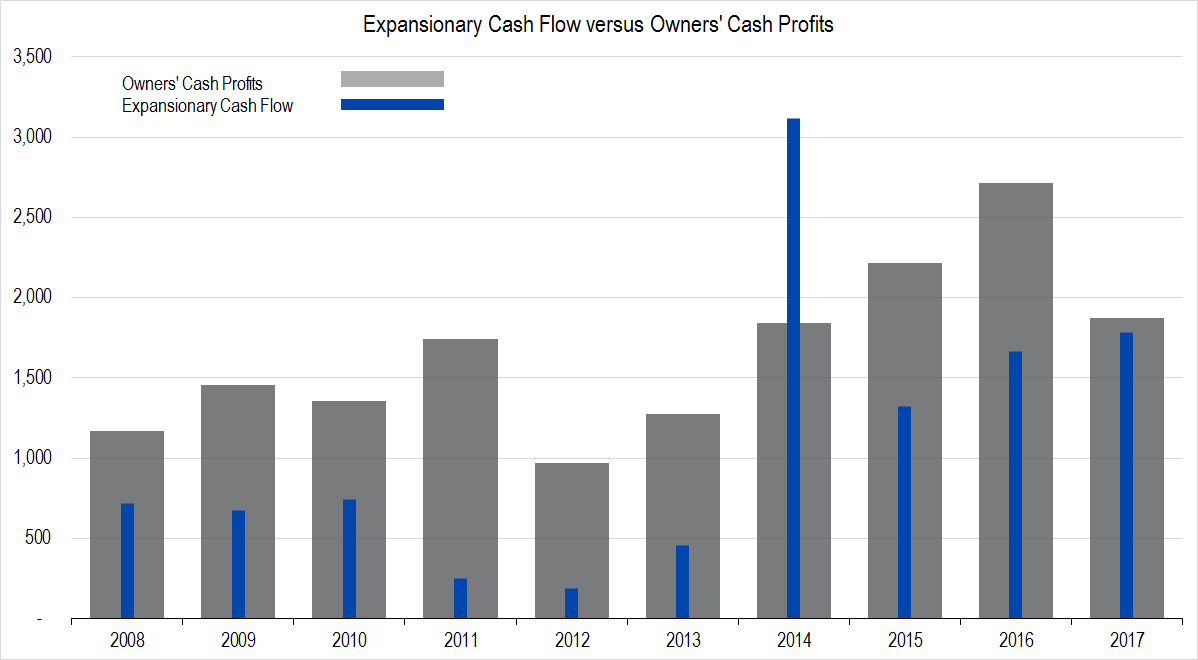
Figure 7. Source: Company Statements, Framework Investing analysis
The average over the most recent trailing 10-year period is 62% and over the trailing four-year period is 90%.
We are keeping our assumptions for investments as a percentage of profits for the five years in the future at 50% for now. However, with European bargain grocery stores such as Aldi and Lidl targeting the US market, and Wal-Mart attempting to make a strong push to compete against Amazon, we wonder if Kroger’s investment spending might not remain elevated for some time.
If we were to change the investment level assumption to, for example, 65% of profits, the fair value range would shoot down by another $10 per share or so.
Outstanding Questions
Before investing in Kroger, we would like to get a handle on two main questions:
- Have Kroger’s recent acquisitions permanently forced profitability to return to its prior 10-year average range?
- How much of its profits will Kroger have to spend on growth projects in order to stave off its competitive threats?
For right now, we cannot answer these questions, and the value of the firm under our present operational assumptions does not show mispricing, so we think it better to forego an investment.