
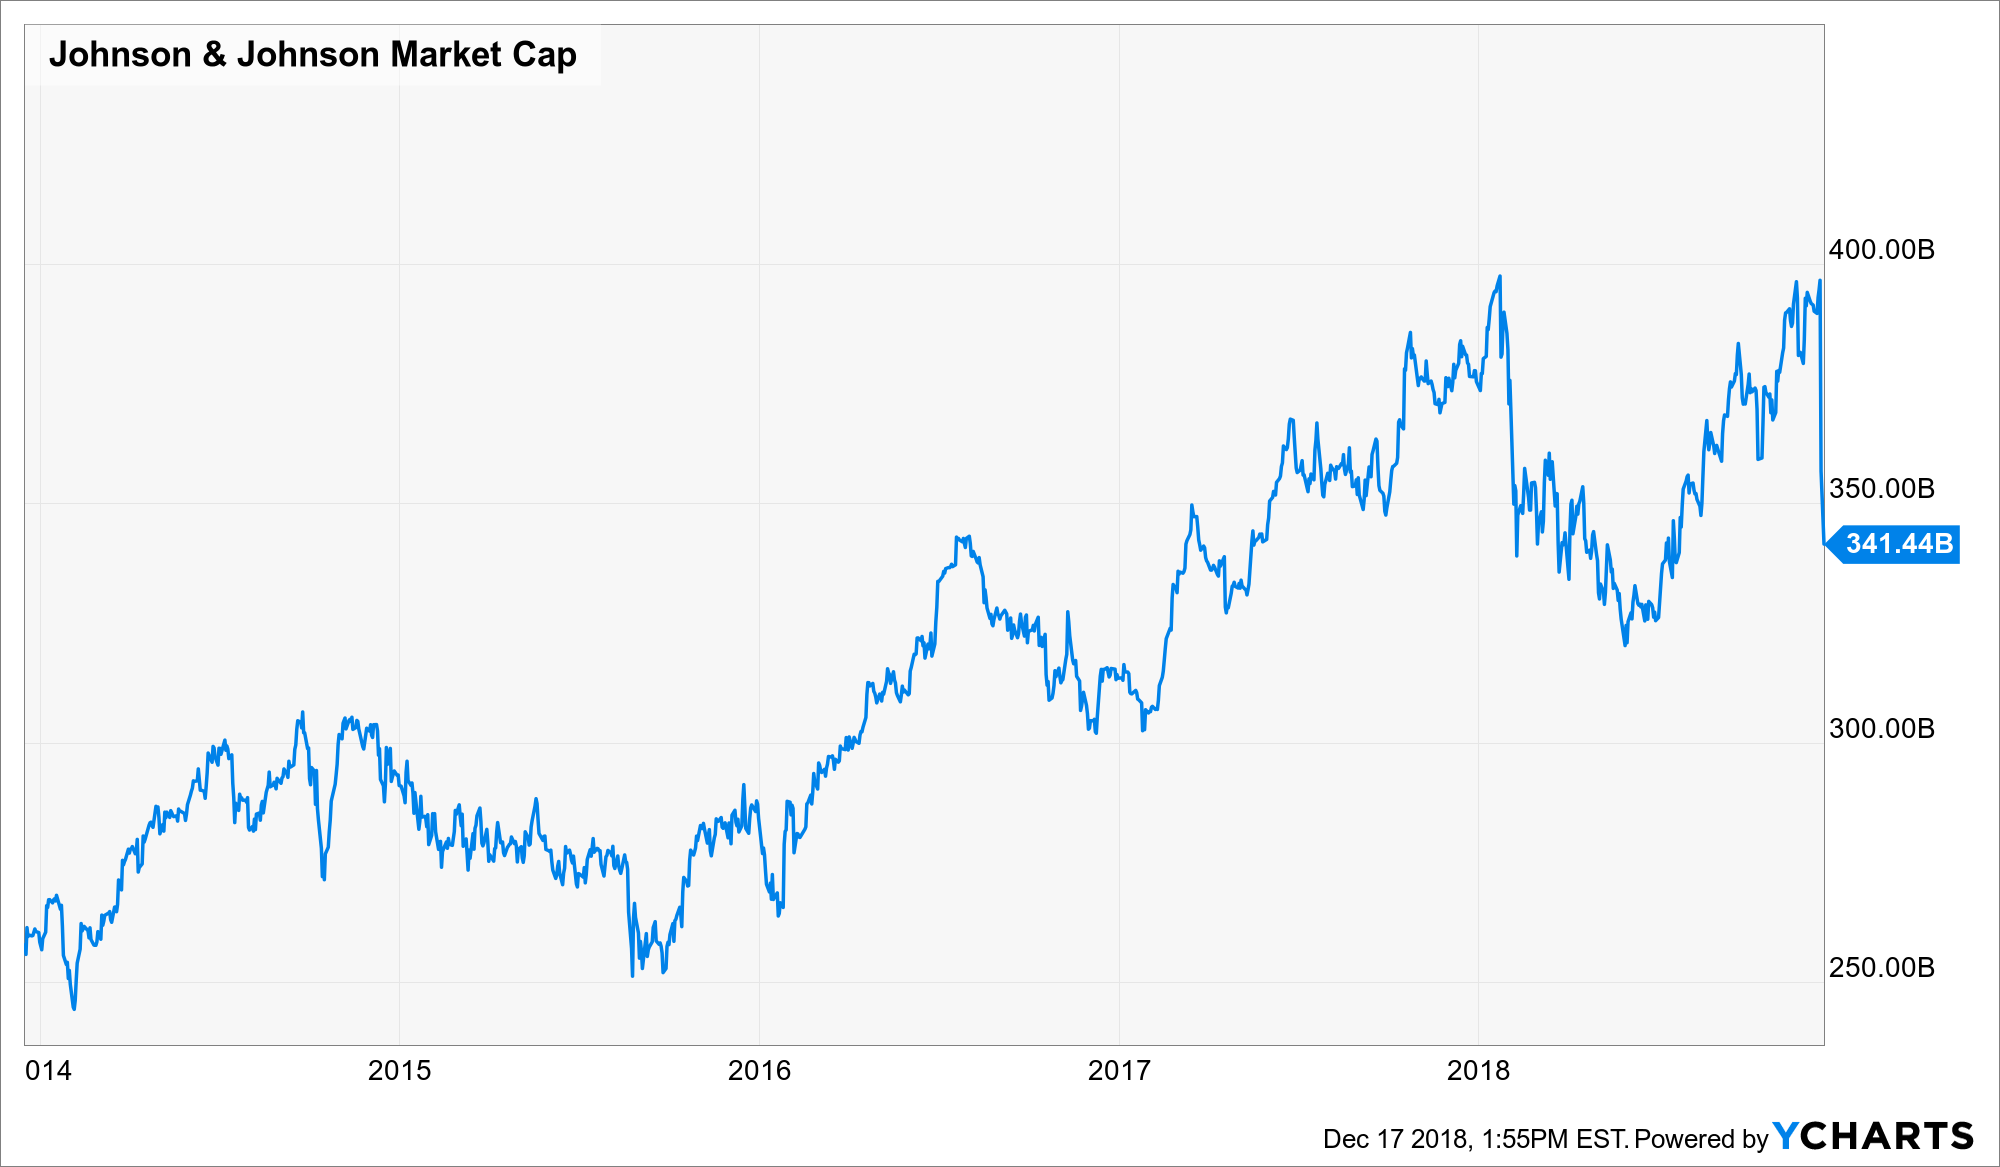
Friday morning, Reuter’s published a special report related to Johnson & Johnson’s JNJ recent court cases related to the health effects of talcum powder use.
Upon publication of the report, J&J’s stock price fell by 10%, wiping out about $40 billion in the firm’s market capitalization. (J&J issued a short rebuttal statement on Friday as well.)
 Long-time Framework member, Robert H. contacted me over the weekend asking for my impressions about the report and whether the steep stock price drop represented an investment opportunity.
I made a quick valuation of the firm, and based on that work, believe that talcum powder liability or not, J&J’s stock price is overvalued by a considerable amount. Even with the stock falling again today, I do not recommend an investment in the company.
This article summarizes my valuation work and includes my valuation model.
Valuation Driver Summary
From a valuation driver standpoint, analyzing J&J is pretty straightforward. The company is comprised of three related businesses: “Consumer, Pharmaceutical and Medical Devices.” (per the company’s 10-K)
While revenues are influenced by currency fluctuations from the 48% (in FY 2017) of its business in overseas locations, over the last 10 years of five-year rolling periods, its revenue percentage growth has remained in the low single-digit range.
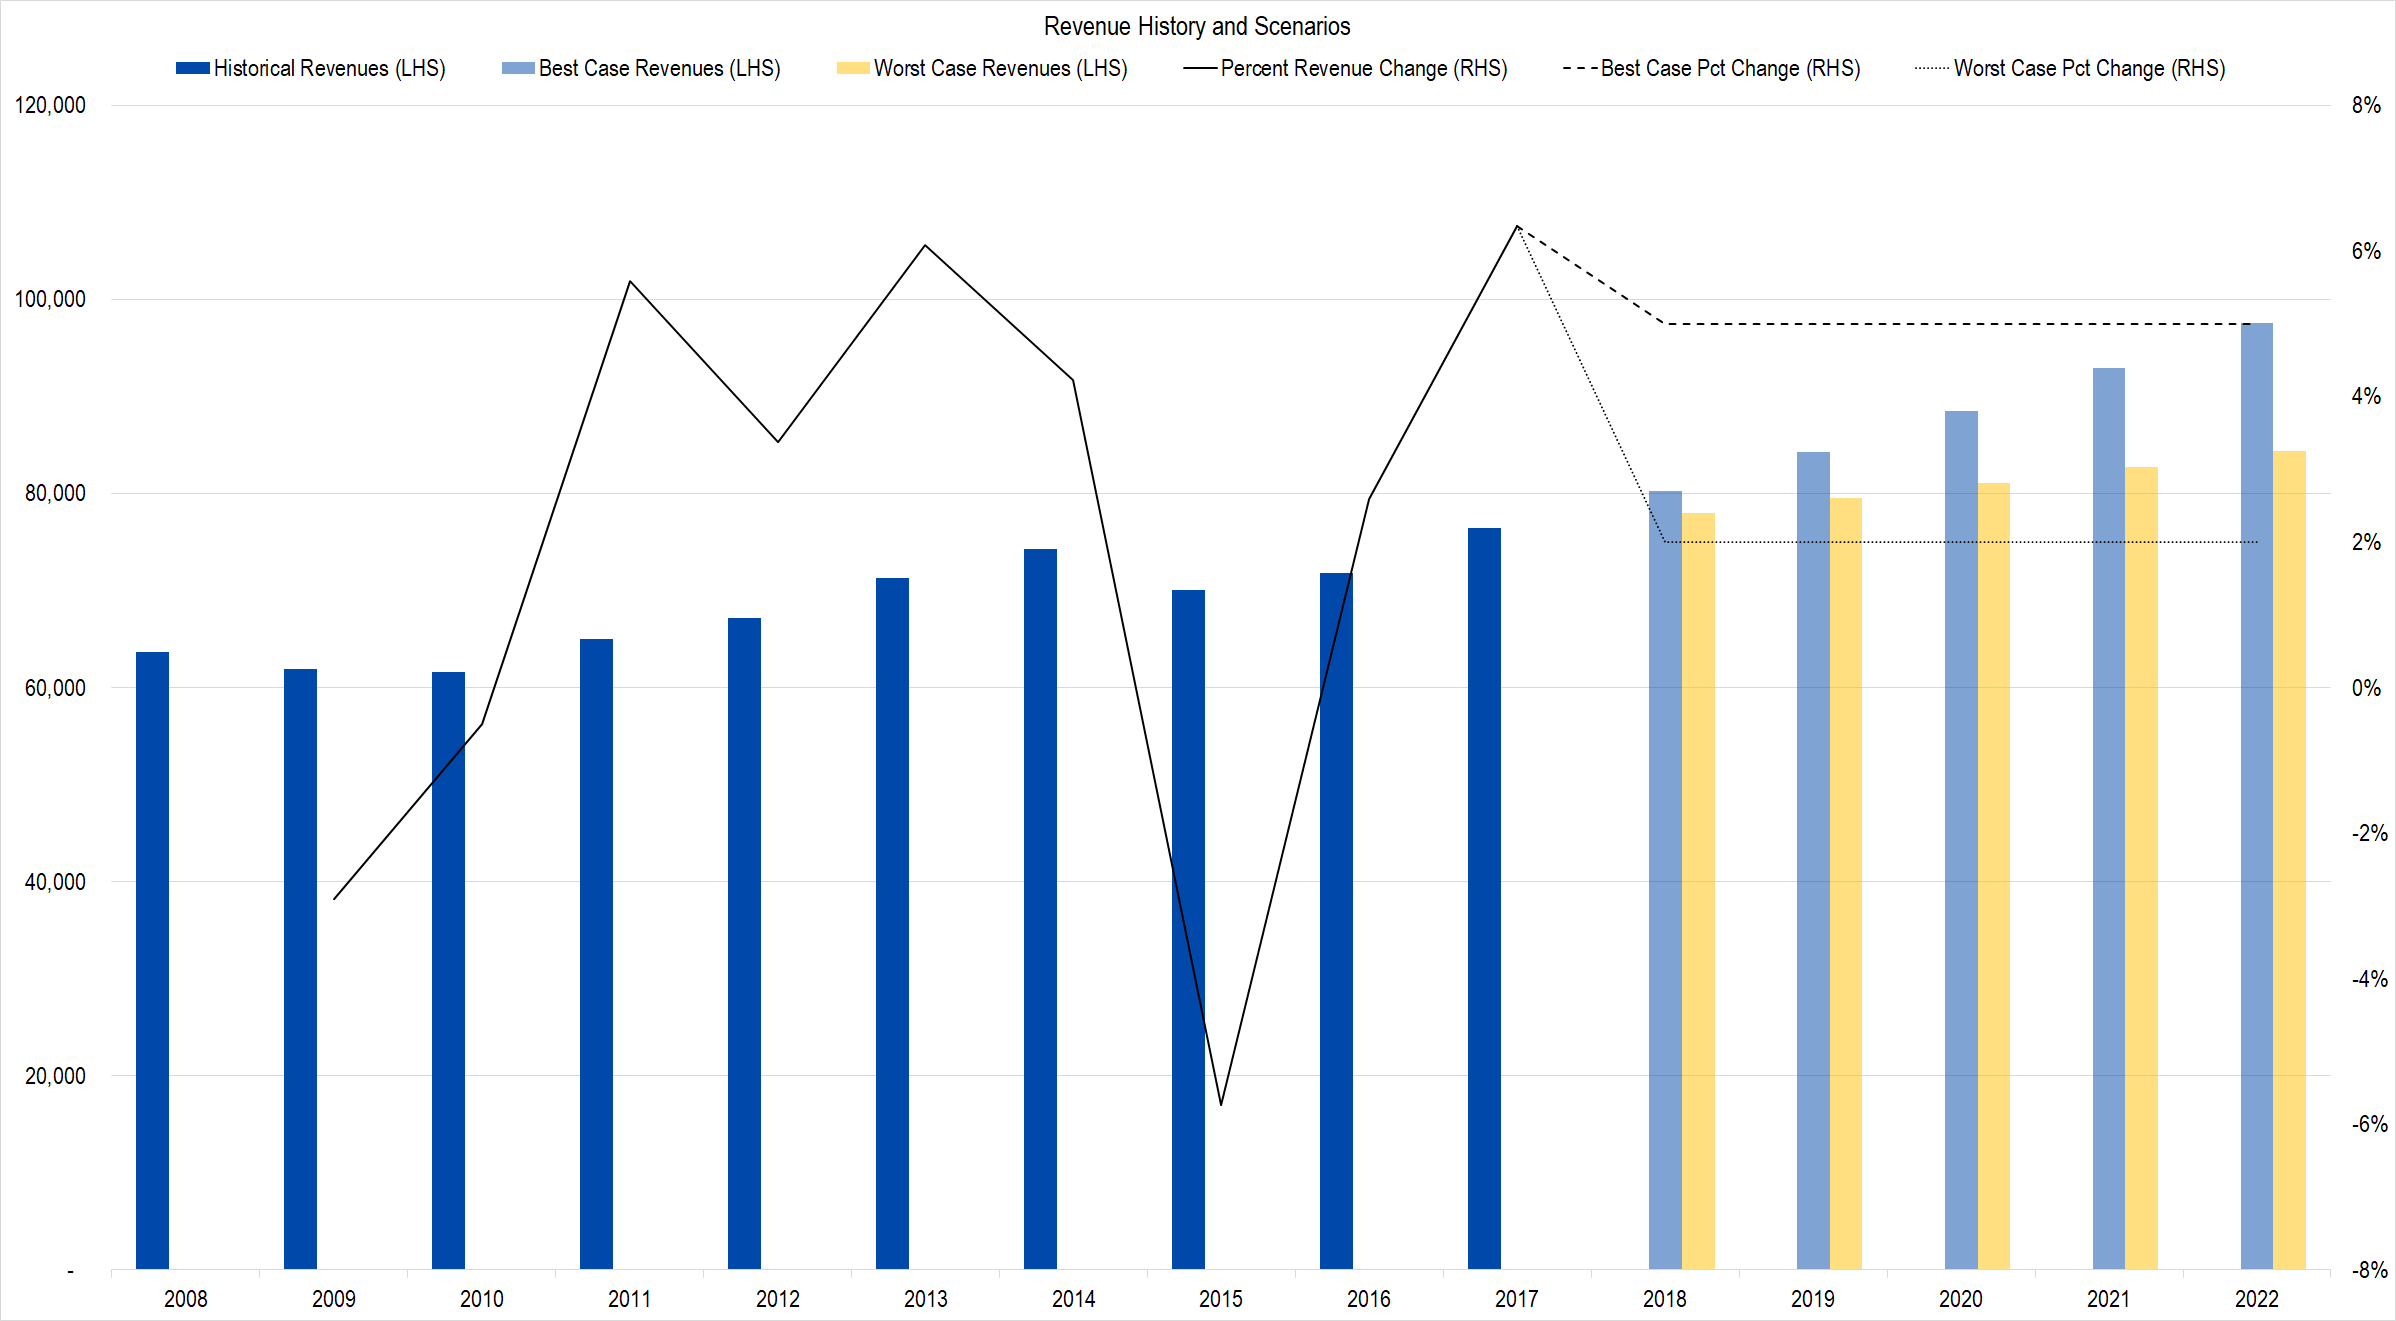
Figure 1. Source: Company Statements, Framework Investing Analysis
The huge dip you see in 2015 stems from two factors — 16 percentage points of currency-related weakness from its foreign operations and two percentage points of weakness from the loss of competitiveness of its hepatitis c franchise (likely due to the success of Gilead’s GILD offerings). These headwinds completely offset and obfuscated its low single-digit growth rate that year.
Its profits too, have been remarkably stable over the last 10 years.
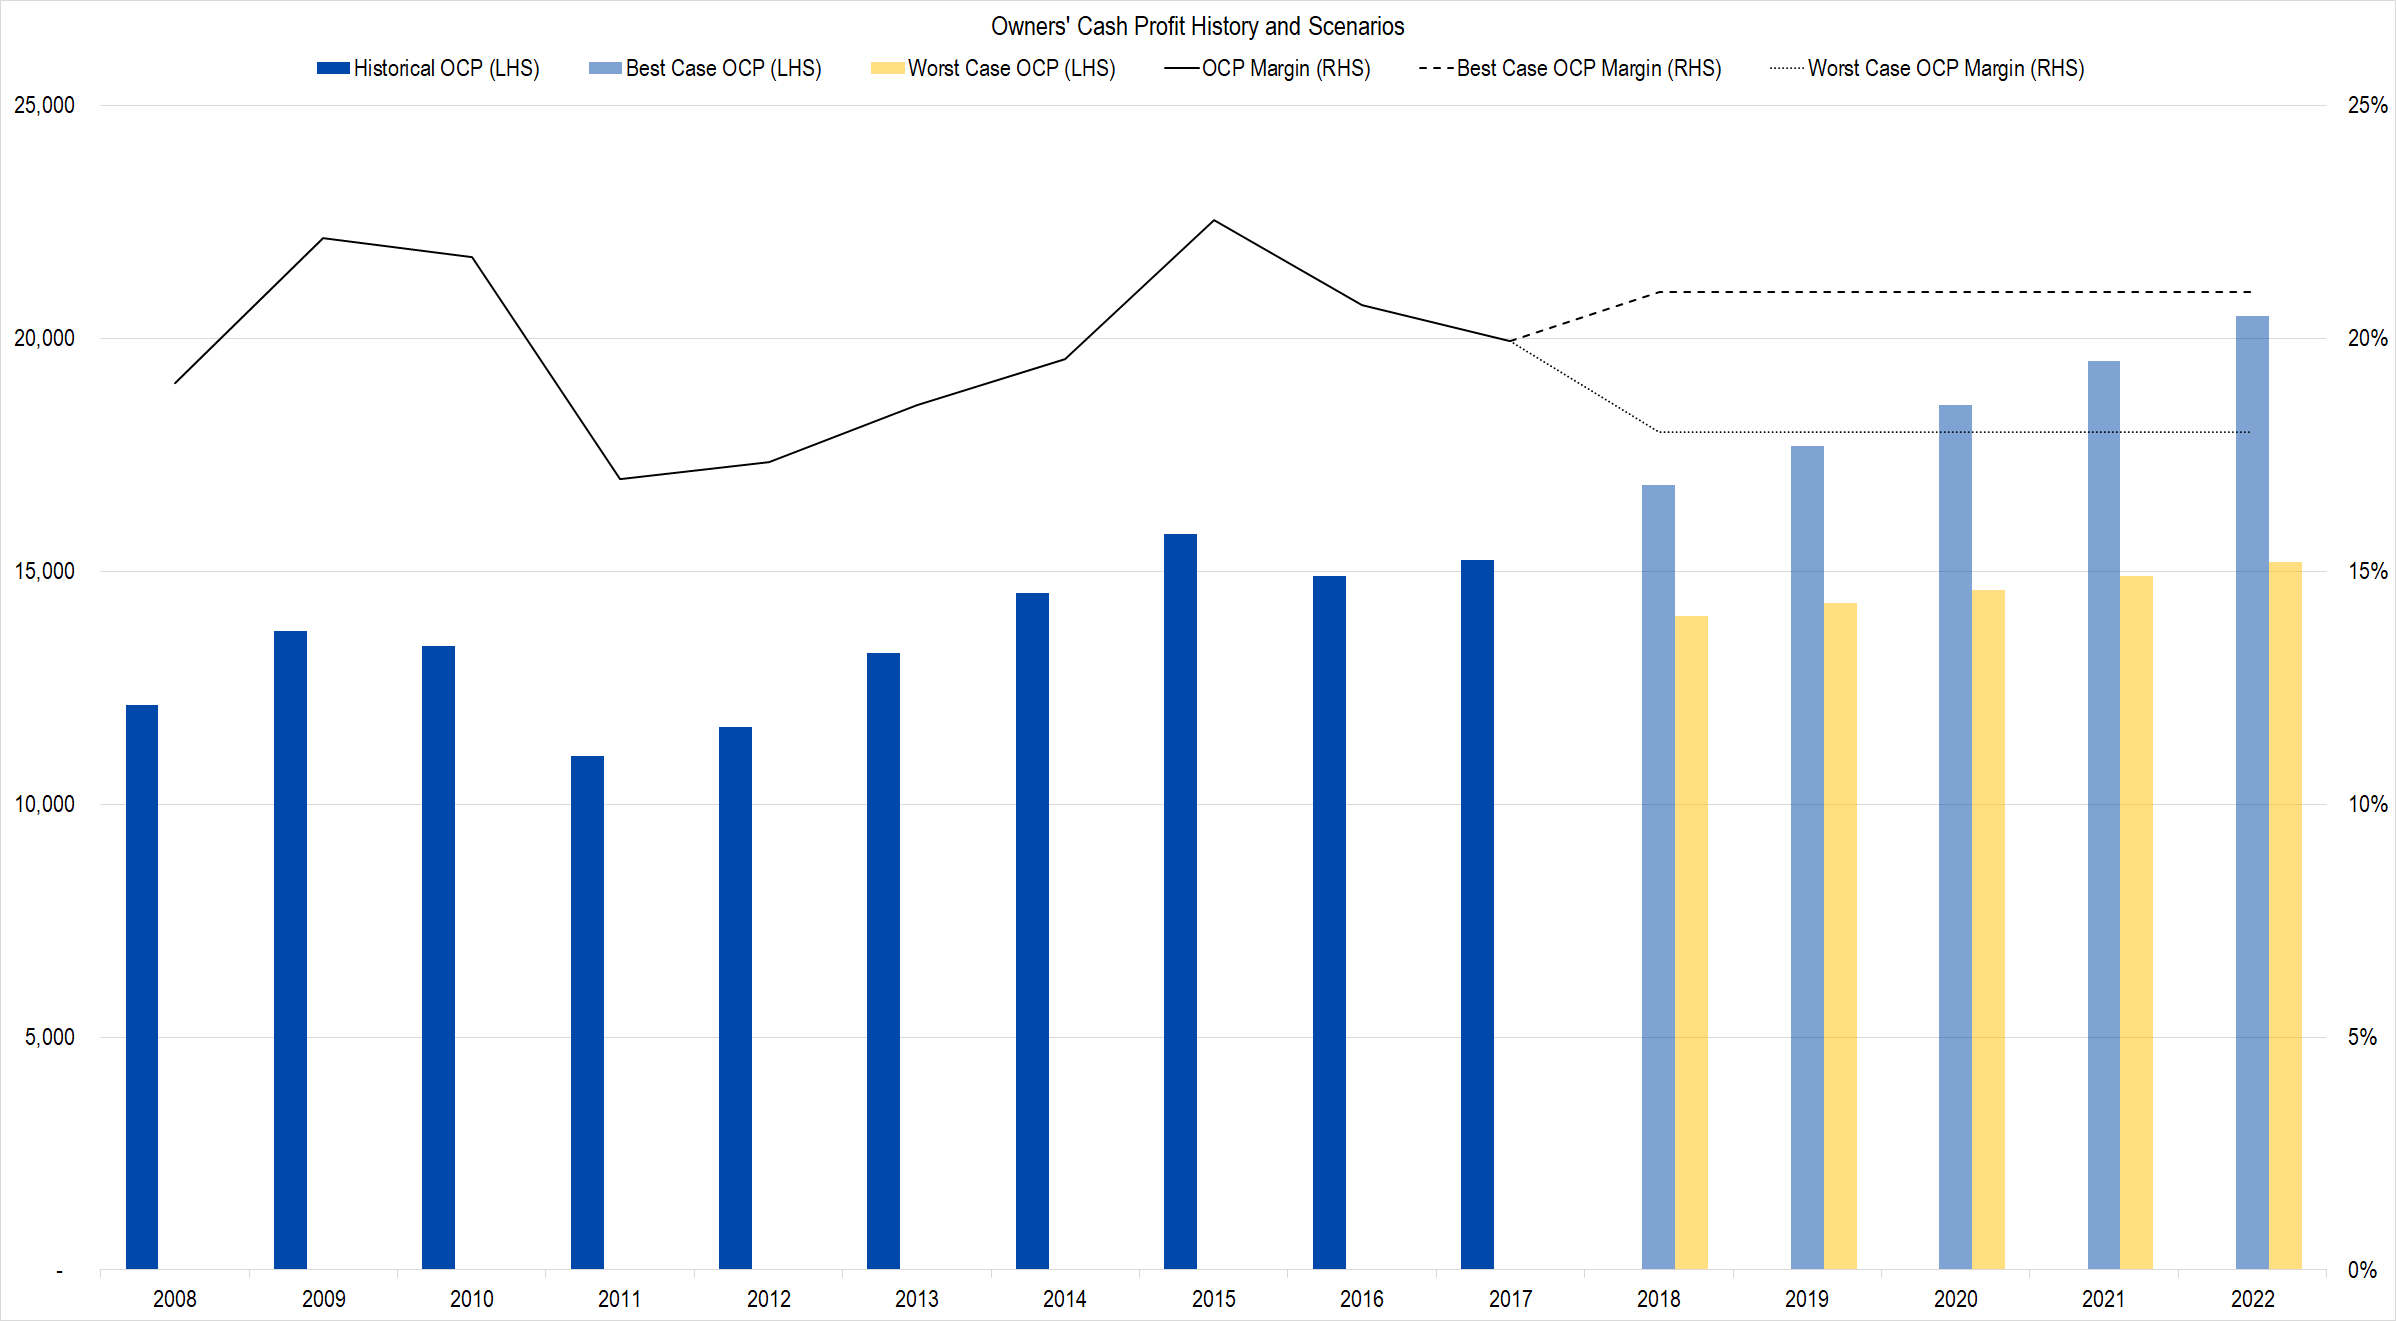
Figure 2. Source: Company Statements, Framework Investing Analysis
The last two observations of the five-year rolling growth of profits have shown an increase to the prior three observations, but the entire series remains tightly in the 19%-20% range for the entire duration.
The company normally spends a modest amount on investments – around 12% of Owners’ Cash Profits (OCP) if years in most years.
However, last year, the company made two large acquisitions, one of Abbot Optical ($4+b) and one of Swiss pharmaceutical company, Actelion ($30b). Additionally, in 2012, J&J acquired Swiss medical devices company, Synthes, to form the #1 market share firm in the industry.
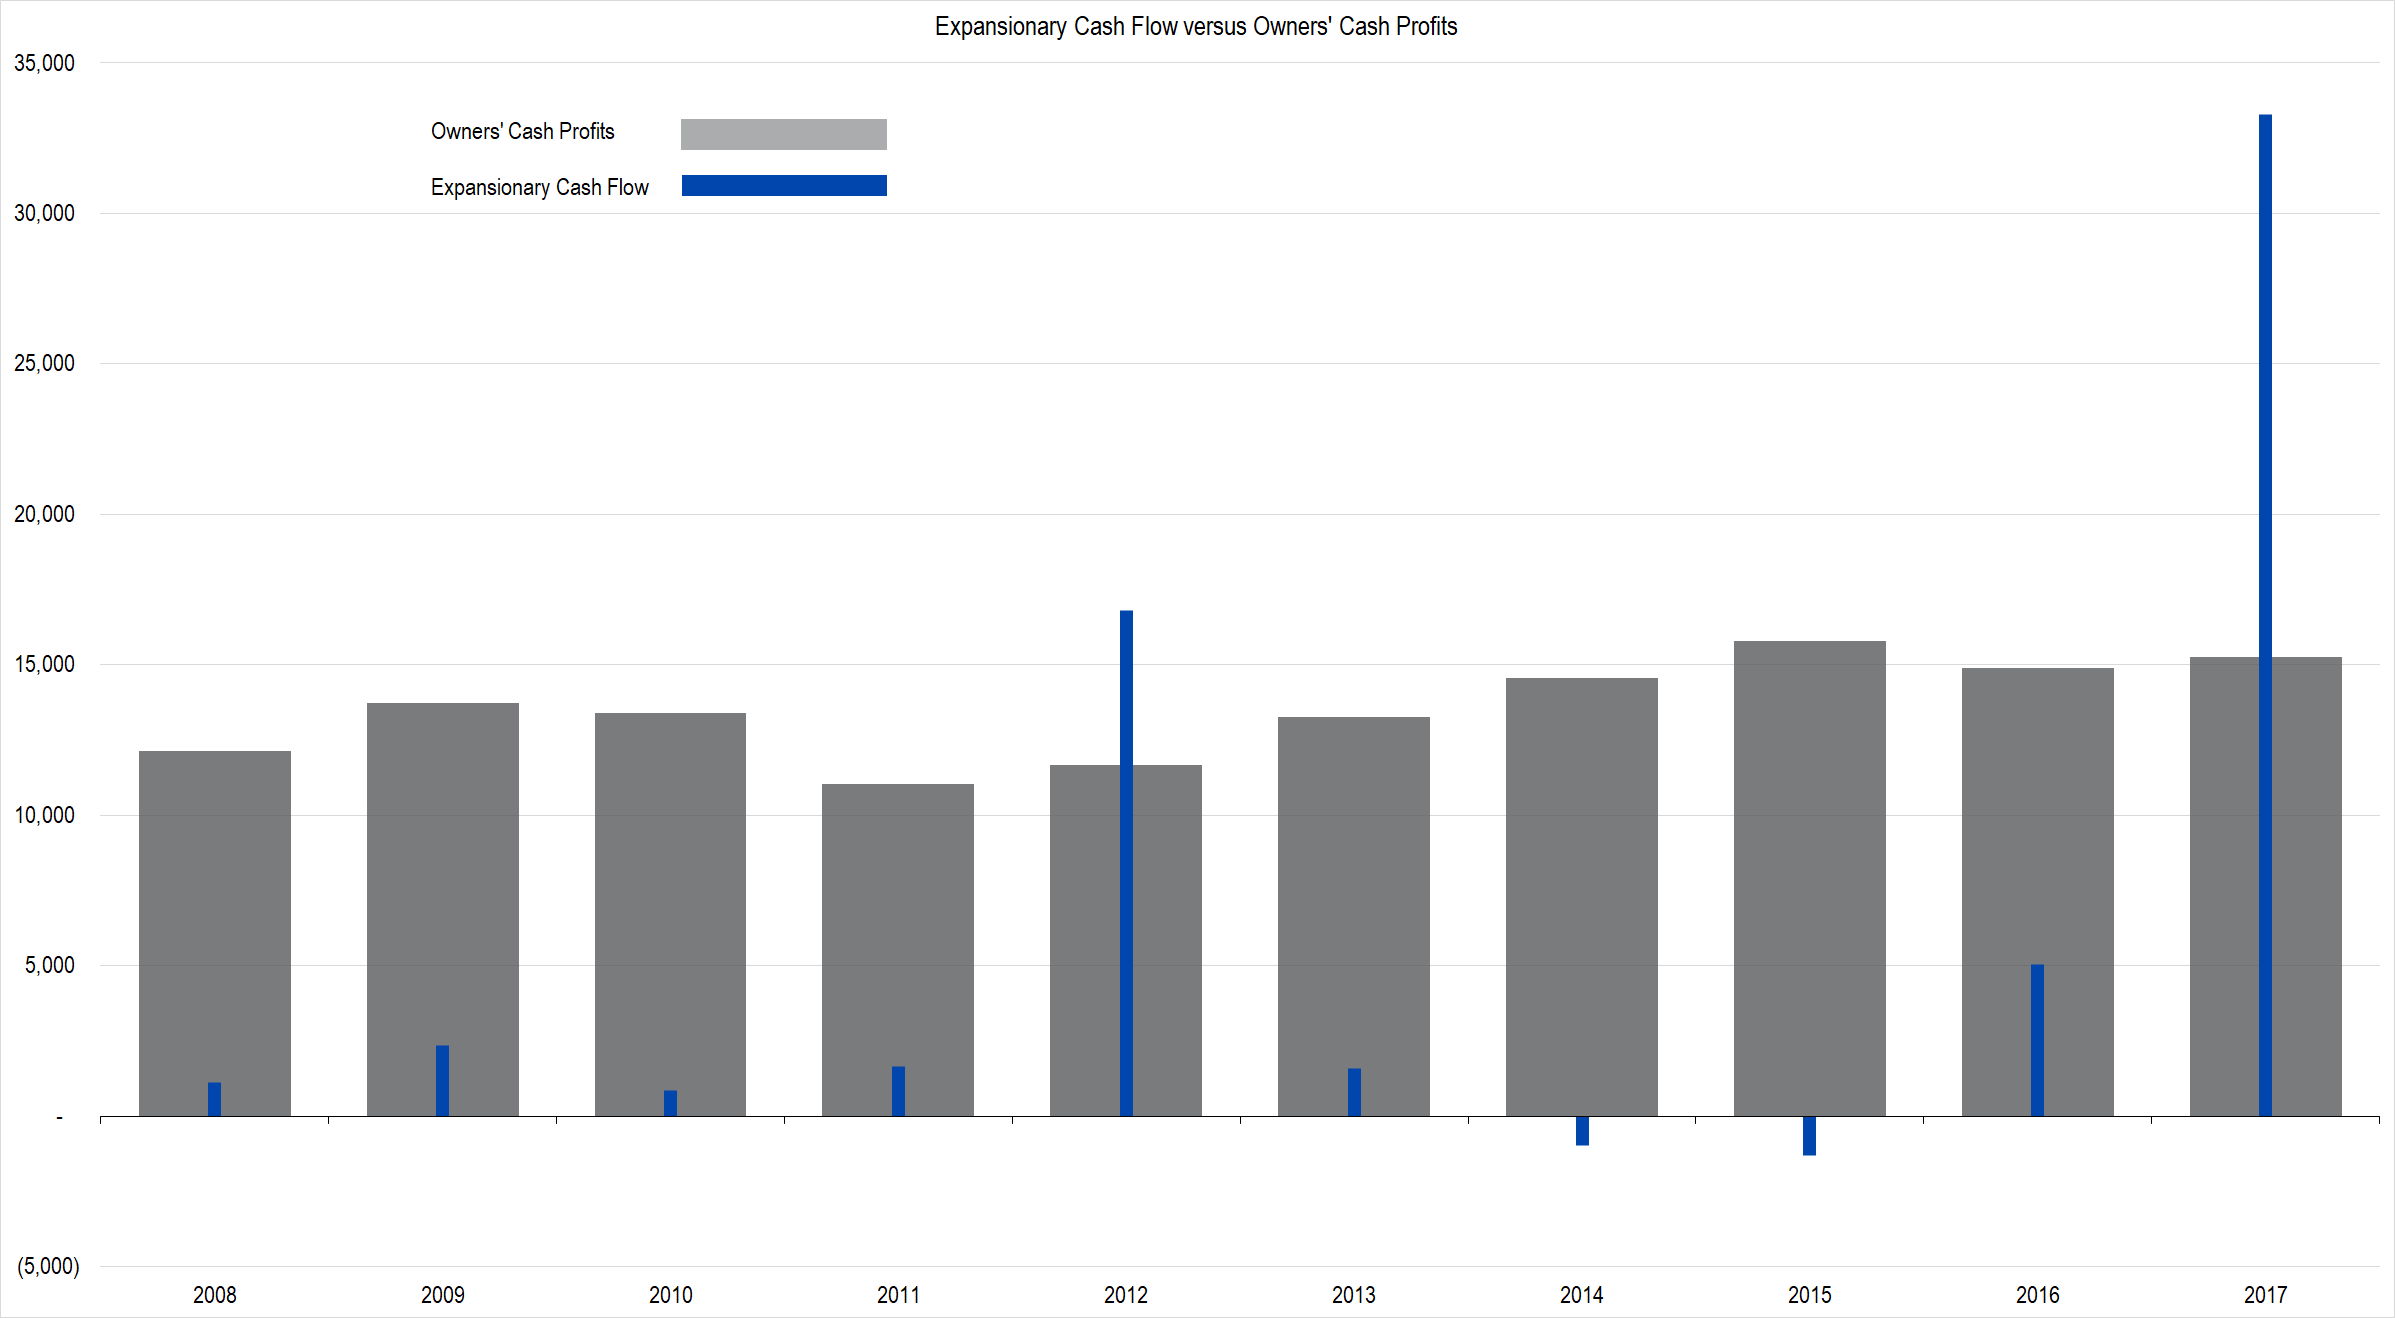
Figure 3. Source: Company Statements, Framework Investing Analysis
Including these large spending years — which we can expect to occur periodically as J&J boosts the depth and breadth of its product portfolio — brings the ratio of Expansionary Cash Flow (ECF) to OCP of 44%.
Our model gives J&J the benefit of the doubt and assumes that the firm will only spend about 12% of profits on average over the next four years. We believe this forecast will be in the correct ballpark, but may be considerably off during any one year. In comparison, in the four years after the Synthes acquisition, average ECF-to-OCP was only 8%. That figure jumps to 50% if the fifth year — 2017 — is included.
Combining all these elements, our Free Cash Flow to Owners (FCFO) picture for the firm looks like this:
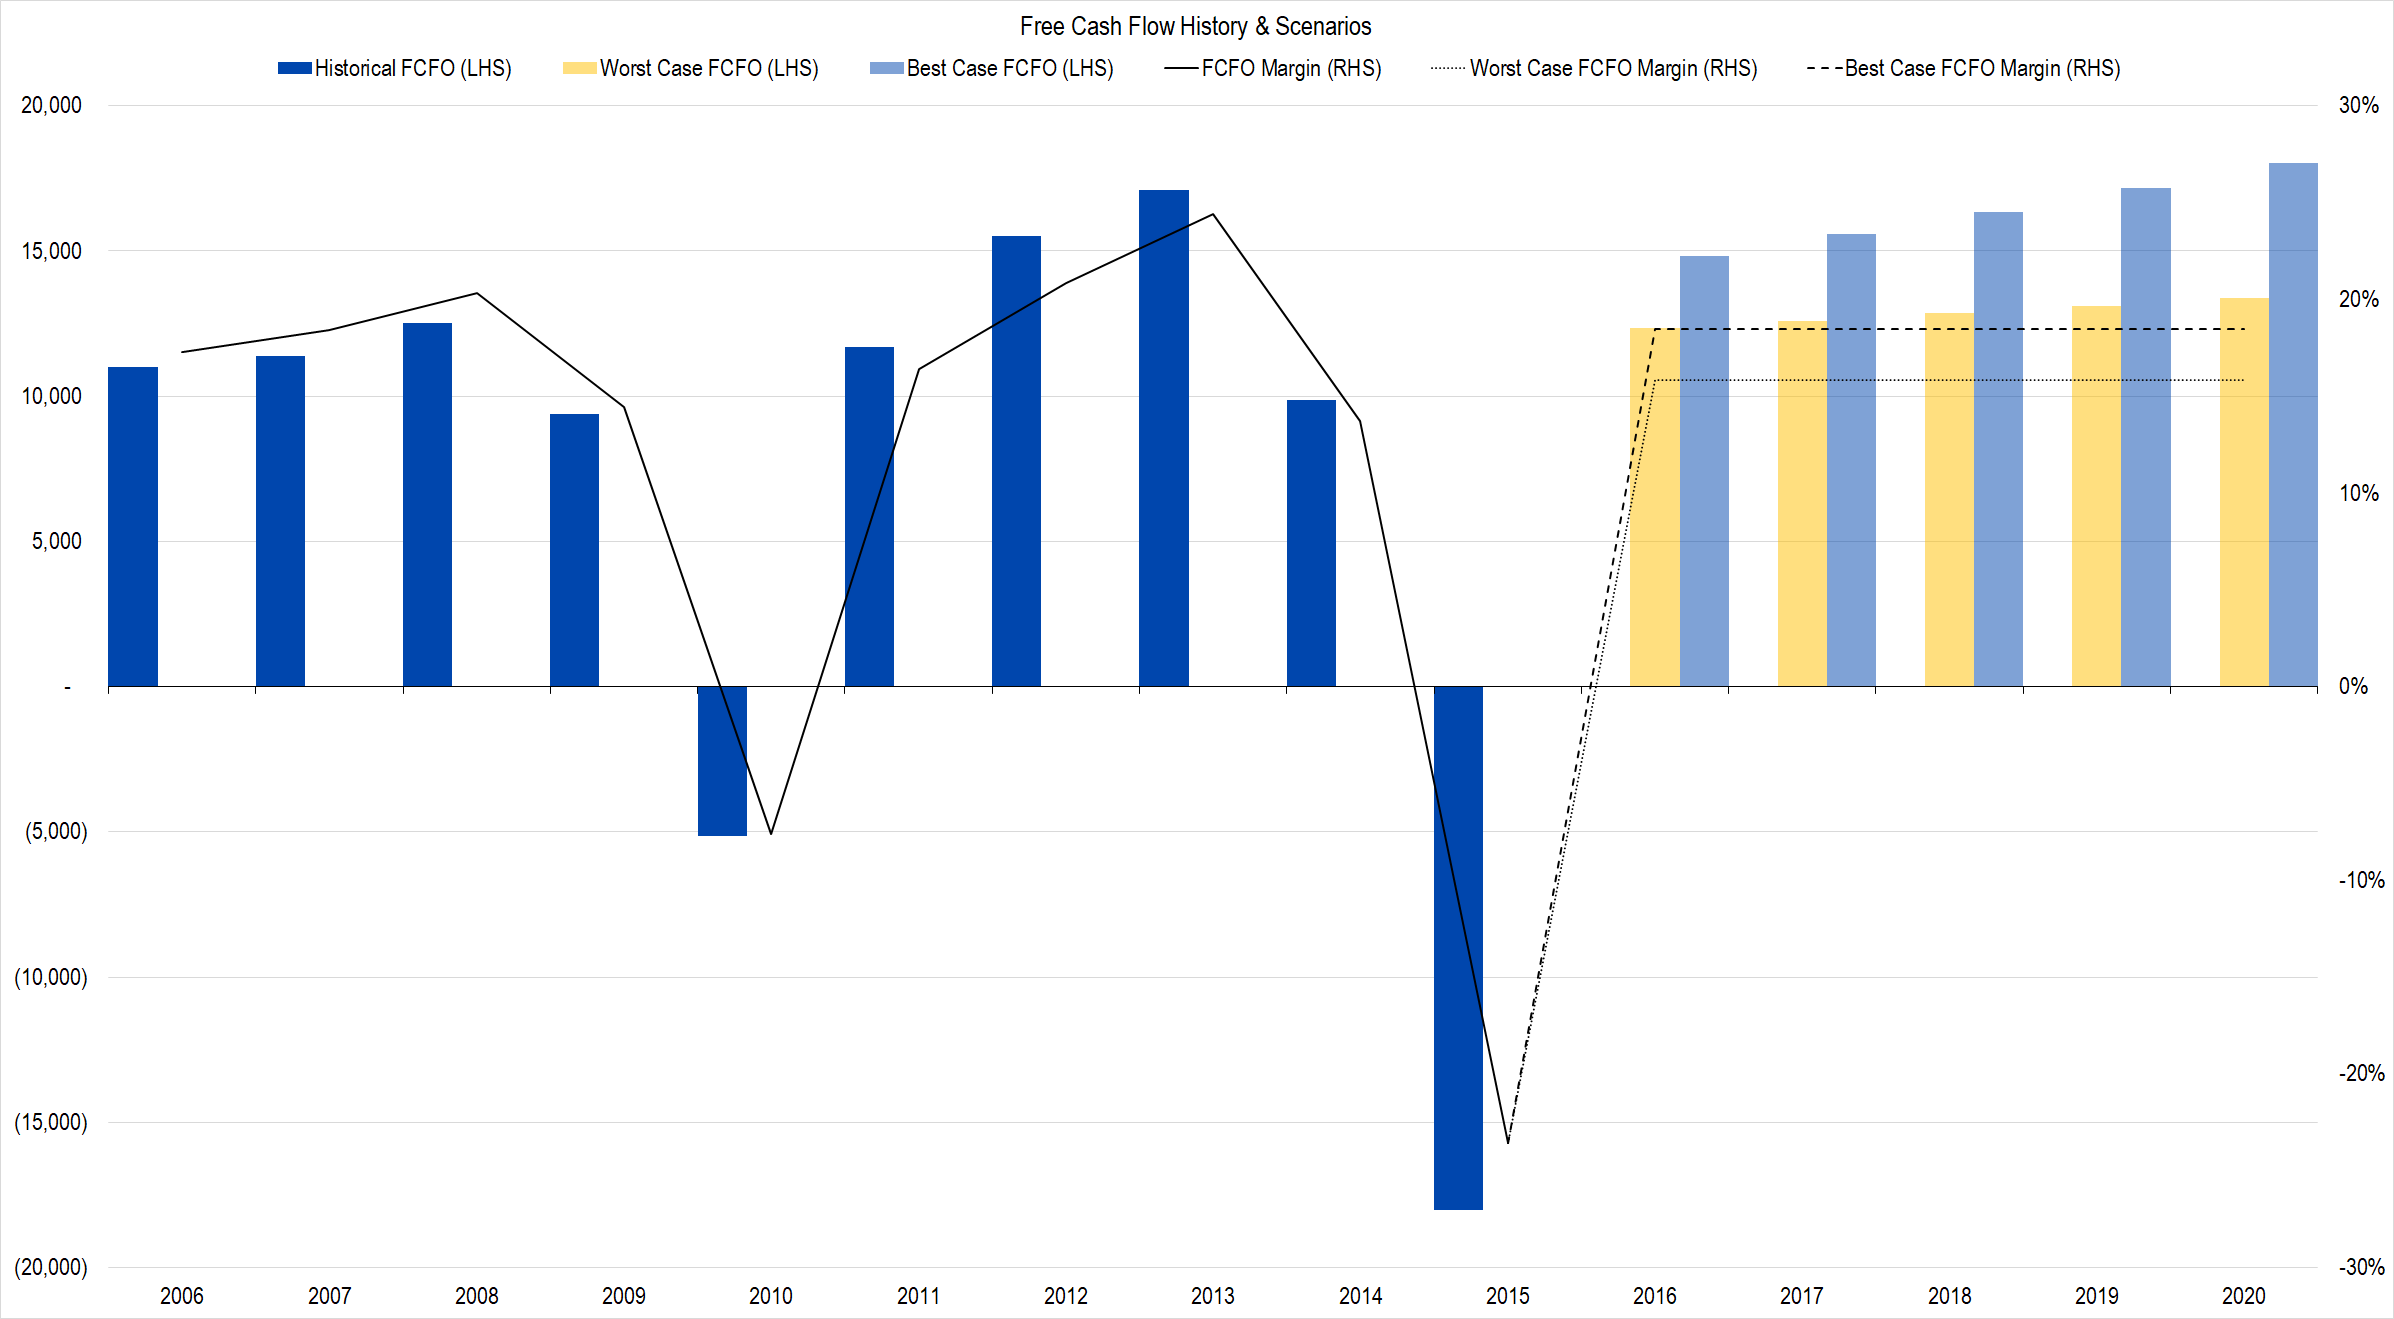
Figure 4. Source: Company Statements, Framework Investing Analysis
Knowing that J&J will have to spend money periodically to buy new businesses, and noting that we are assuming no acquisitions for the next five years, it’s sensible to assume that medium-term FCFO growth will face a headwind from the purchase of another firm. As such, we are assuming medium-term FCFO growth to only total 1% per year in the worst case (10% growth in the best case). We think this 1% probably too optimistic.
If we look at cumulative FCFO from 2008-2012, we find a total of $39.2 billion. During the next five-year period, it generated only $36.1 billion. On annualized basis, this is a bit more than a fall of 1% per year.
Valuations Under Various Assumptions
The best-case set of assumptions — in which the talcum powder issue is totally ignored and in which we assume that the company makes no more acquisitions over the next five years — gives a valuation range of $77 / share to $141 / share with an average of all scenarios at $106 / share.
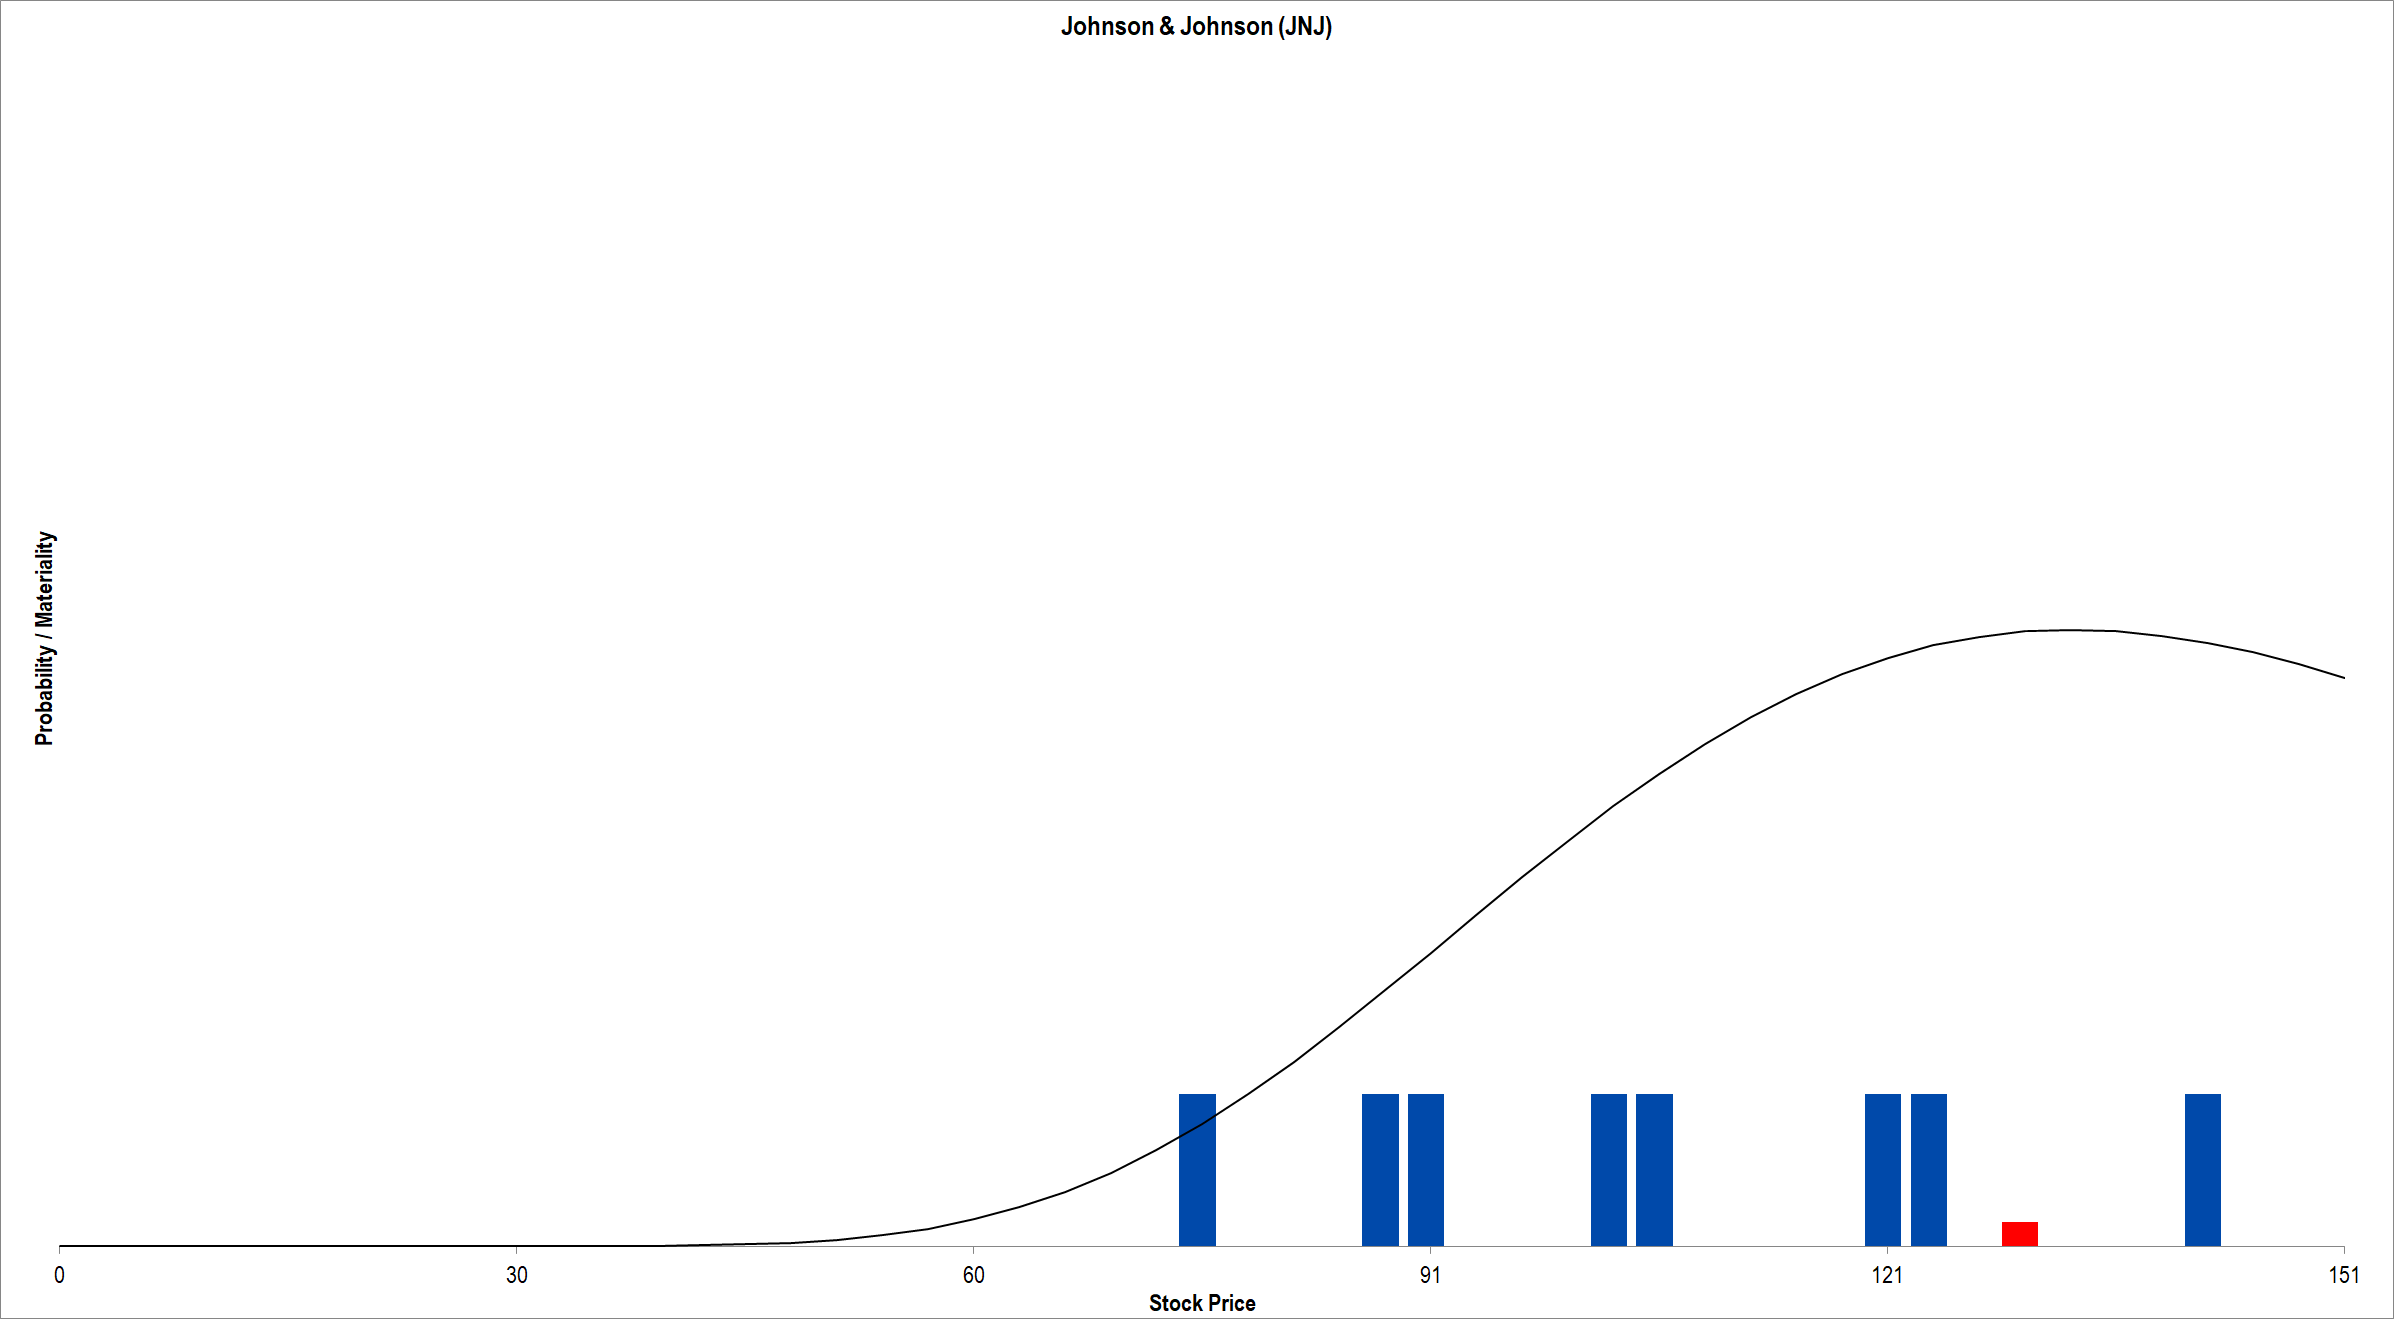
Figure 4. Source: MarketChameleon.com (IV data), Framework Investing Analysis. Red column shows current market price of $130.16 / share.
A more reasonable assumption set, in which one year sees an acquisition that drives expansionary spending to 125% of OCP brings the range down slightly — $72 / share to $135 / share with an average of all scenarios at $101 / share. (This is the version saved in the model linked below.) Note that this valuation also assumes that the talcum powder issue does not deduct from the firm’s value.
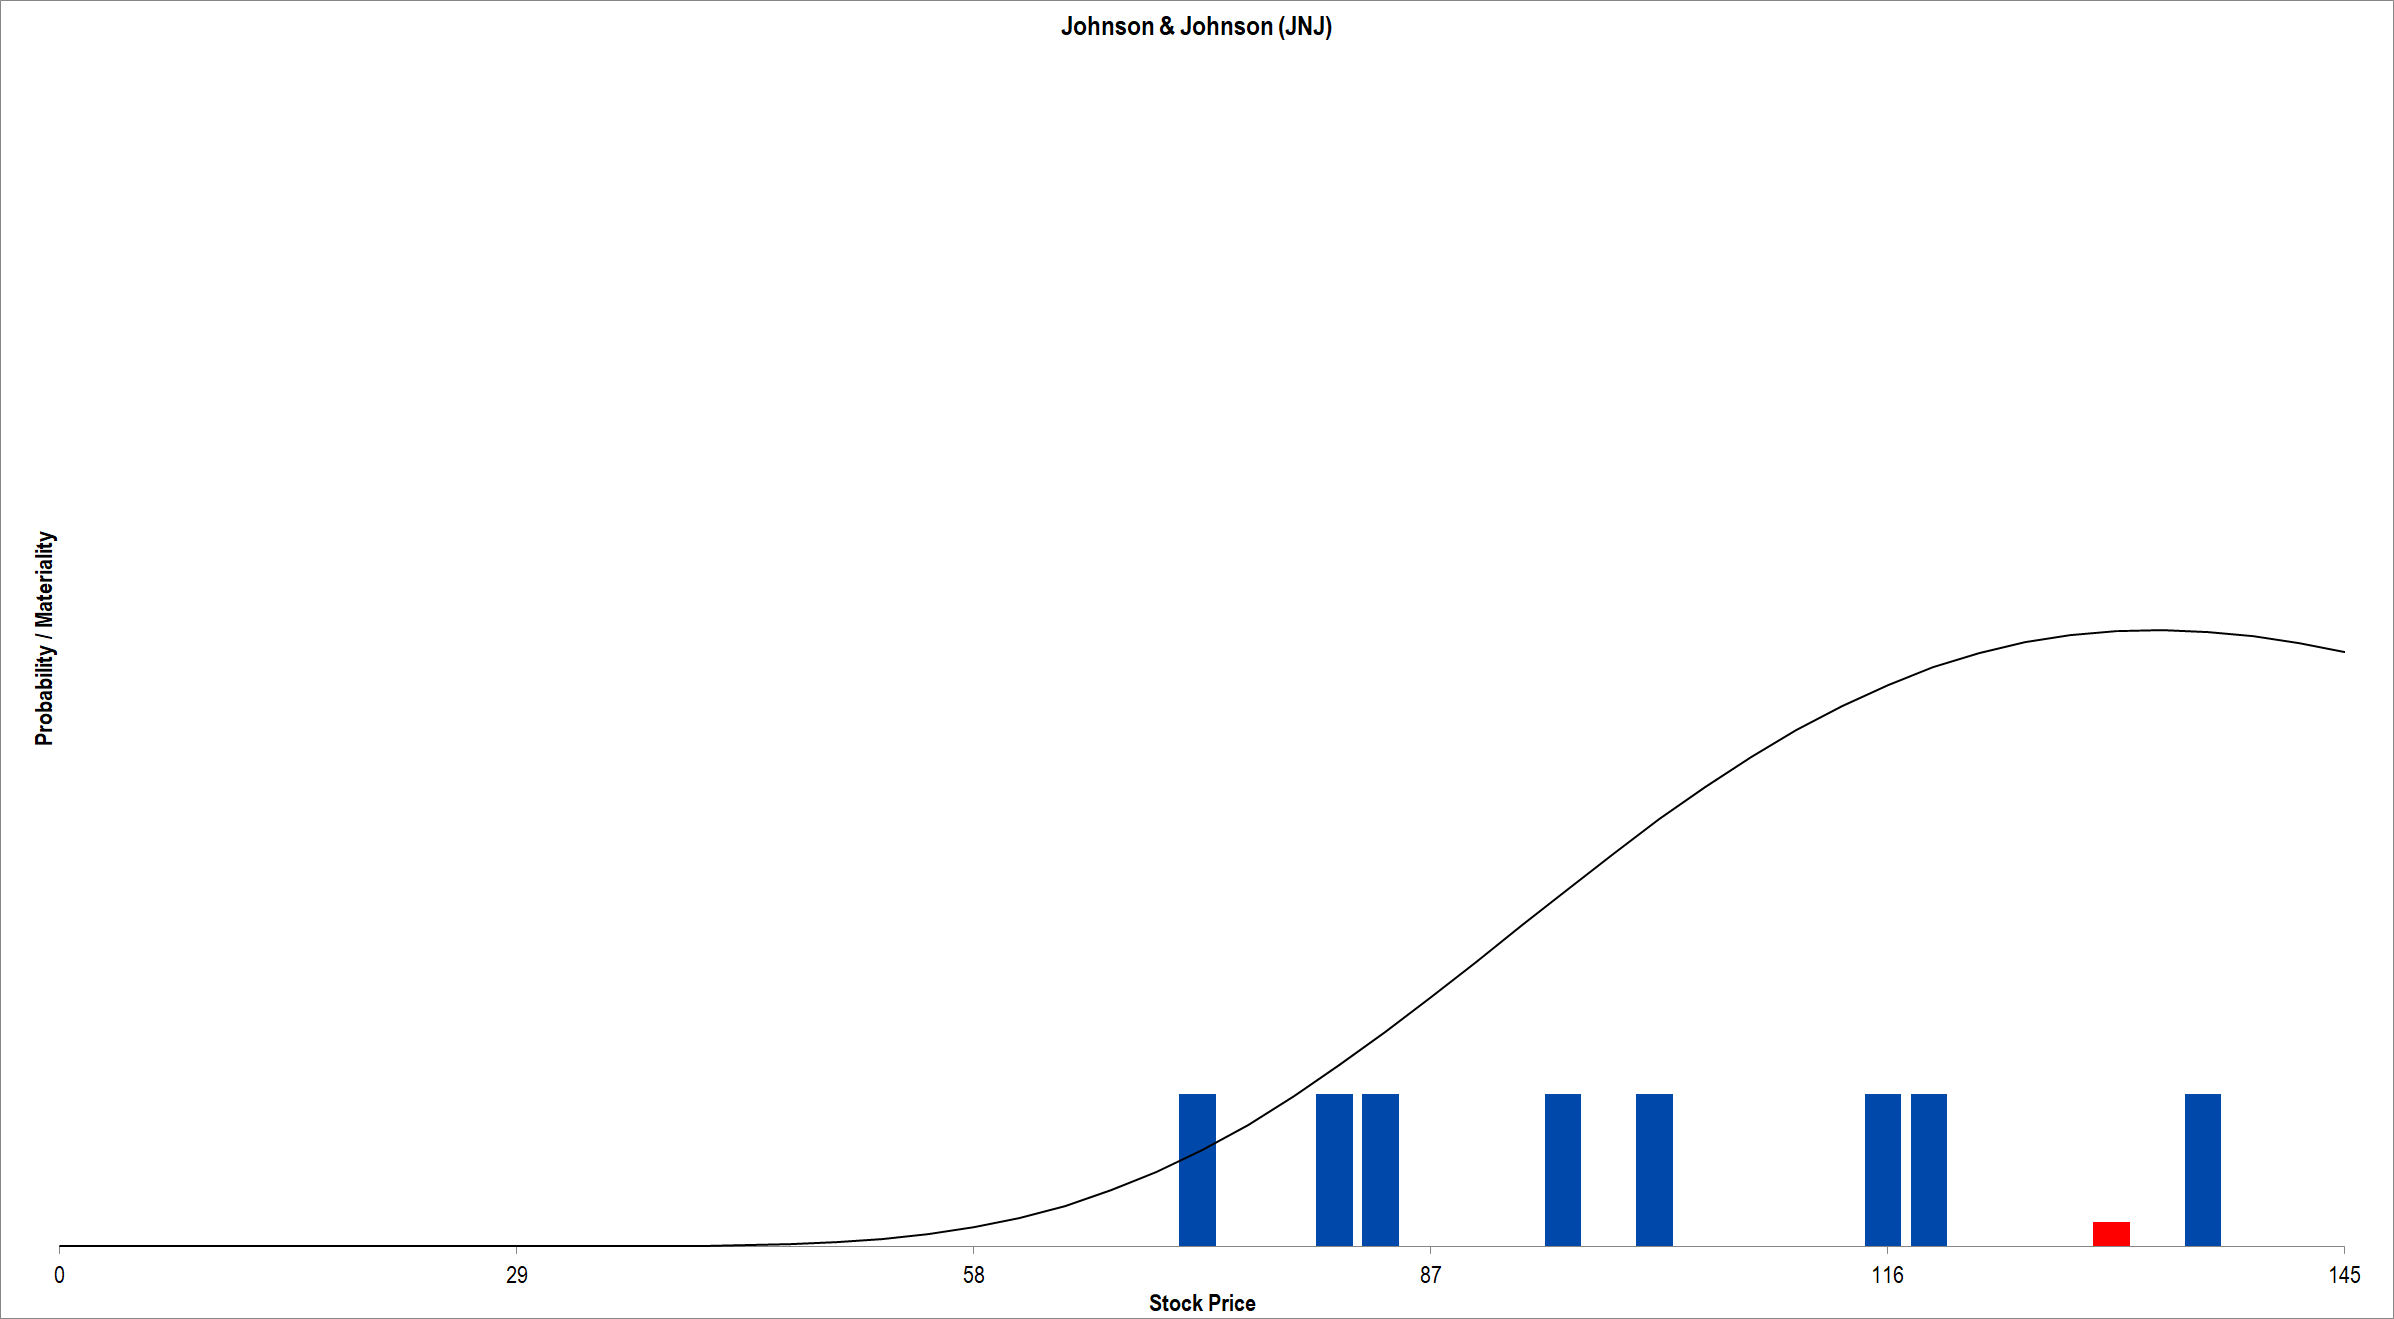
Figure 5. Source: MarketChameleon.com (IV data), Framework Investing Analysis. Red column shows current market price of $130.16 / share.
If we use the same base assumptions as above, but assume that the market reaction to the Reuter’s story is appropriate in size — $40 billion — and deduct that amount as a balance sheet effect, we end up with a valuation range of $57 / share to $120 / share and an average valuation of $86 / share.
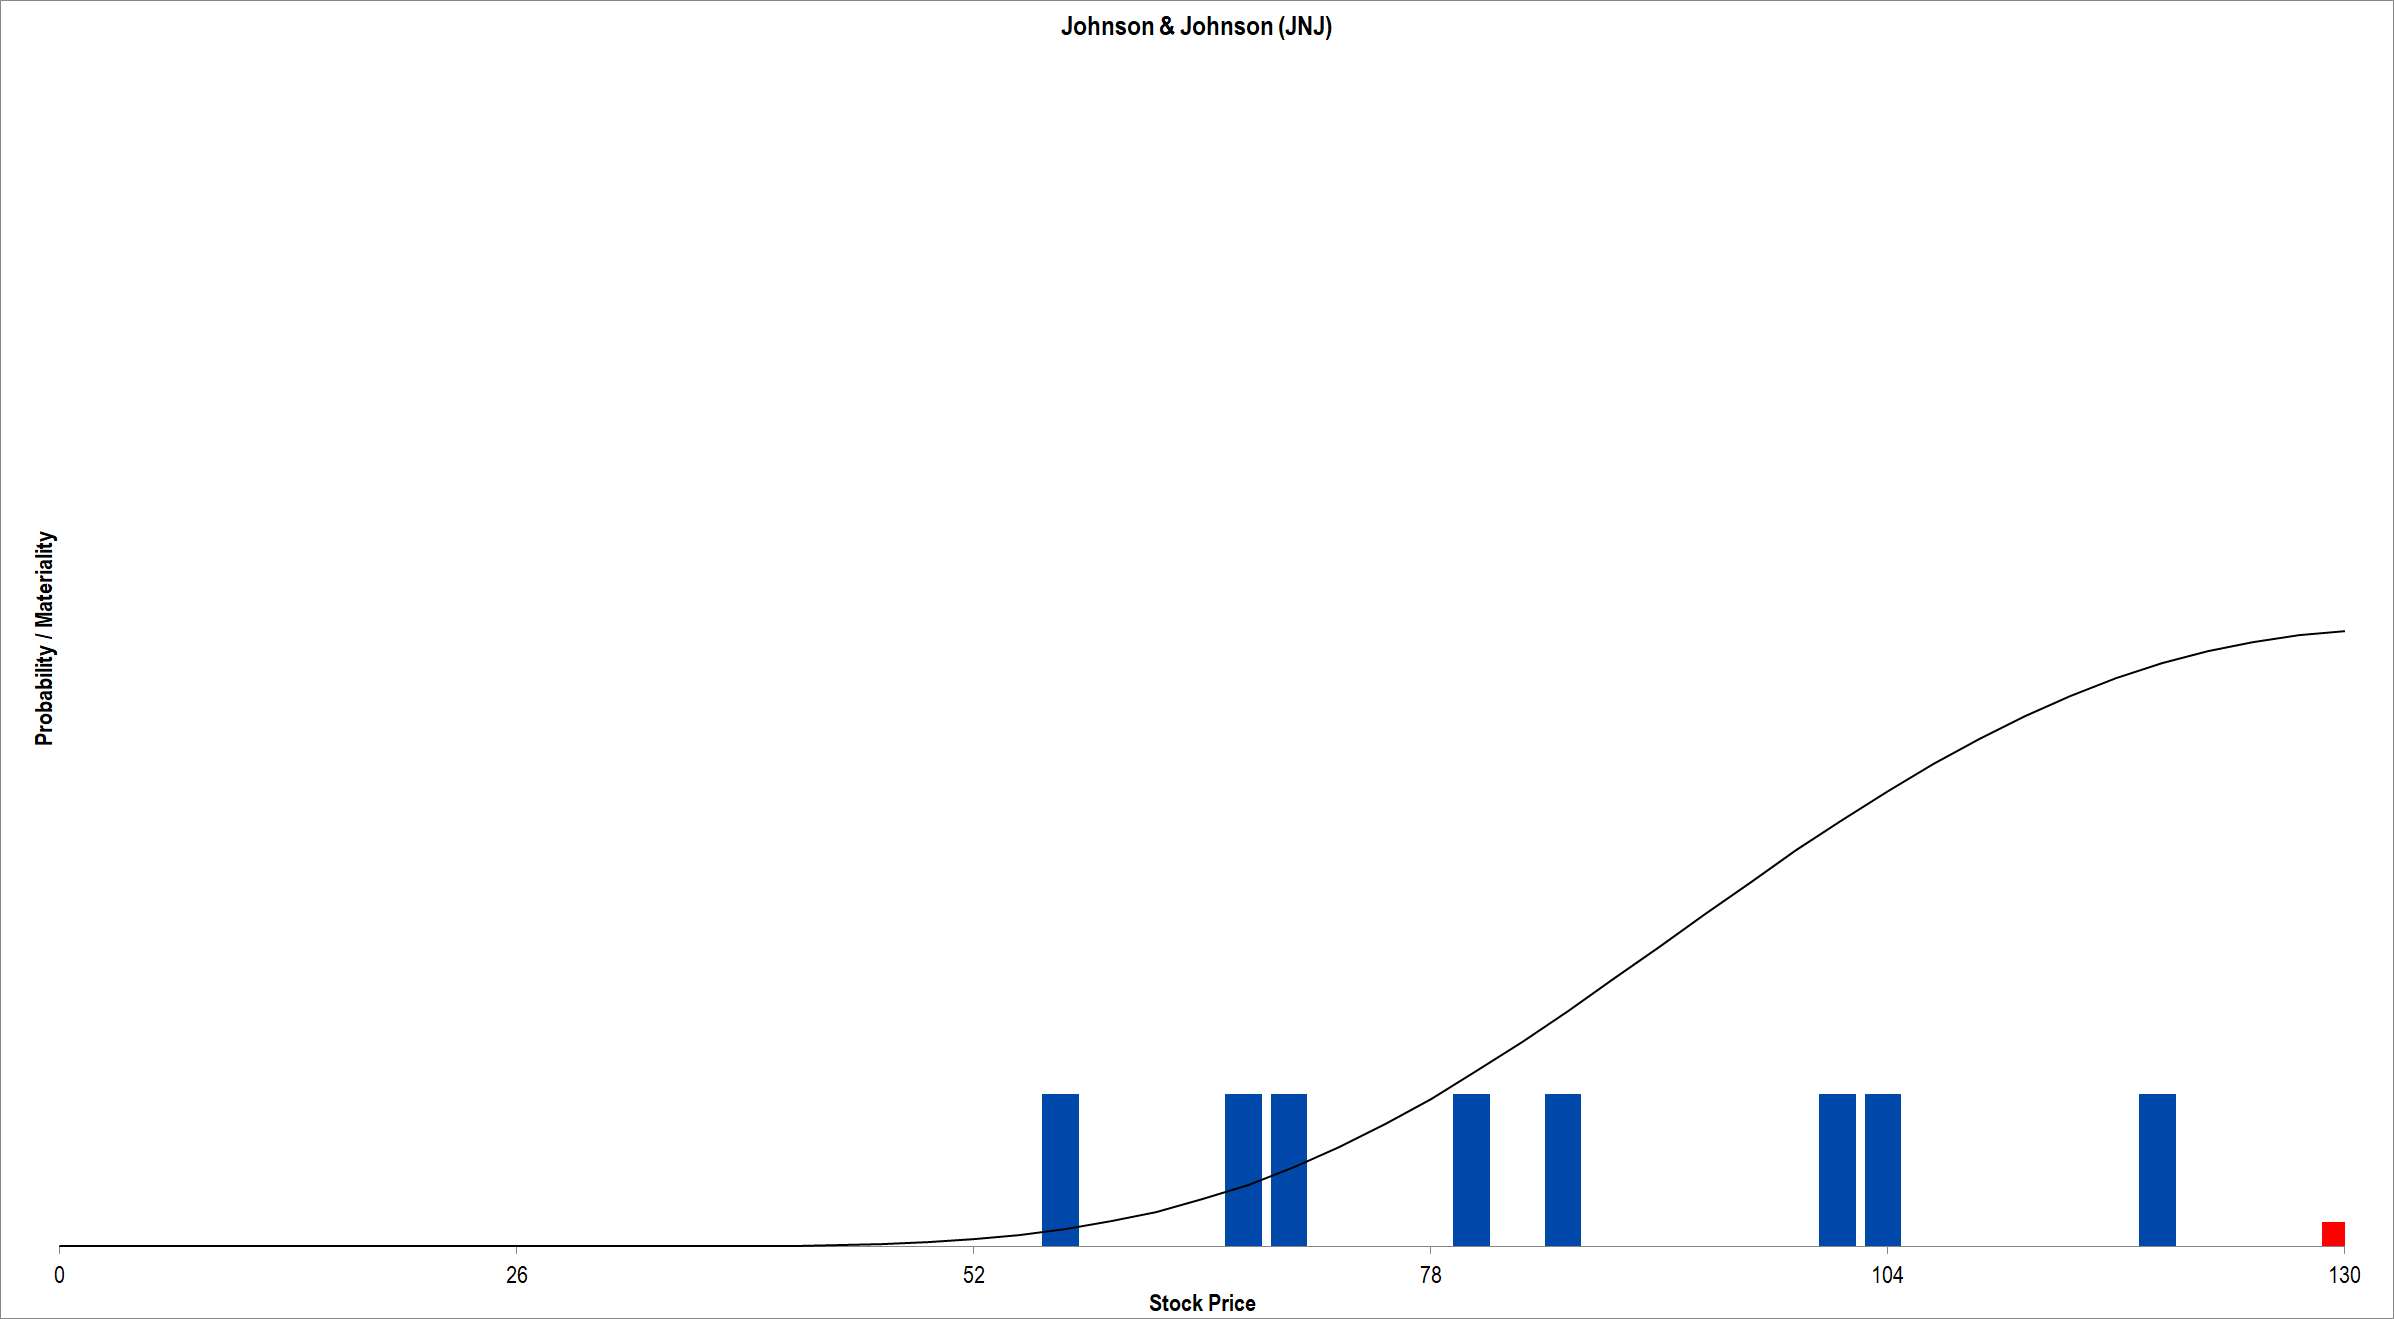
Figure 6. Source: MarketChameleon.com (IV data), Framework Investing Analysis. Red column shows current market price of $130.16 / share.
Considering that the best-best-best case scenario in all models — with their assumption of 10% annual medium-term cash flow growth — seems too optimistic, and you’ll see why I’m not interested in buying or holding J&J at current prices.
Framework Integrated Valuation Model – Johnson & Johnson (JNJ)
![]()