In this yield-starved world, people may be paying too much for generous dividend payers – so much so that the Consumer Staples sector is in a bubble. This was the contention made to me by one of our readers, and it seemed plausible, so we sat down to take a closer look. Taking a bottom-up approach, we started by looking at a single company – prominent Buffett holding, Coca-Cola (KO).
We found that…
- Coca-Cola is trading at moderately higher levels than in the recent past, but the growth assumption implied by its present ratio of price to Owners’ Cash Profits (OCP) is still reasonable.
- Coca-Cola’s OCP has dropped over the past few quarters, and the company’s present payout ratio is very high by historical standards.
- In aggregate, we do notice that the price the market has paid for each unit of OCP among large capitalization Consumer Staples stocks has edged up over the past five years; present prices now imply a future perpetual growth rate of around 5% per year for the sector’s profits.
The Analaysis
Our first step was to look at the ratio of Price-to-OCP to see if the market was paying more for Coca-Cola’s profits than it had been a few years ago. Here is the graph of that relationship:
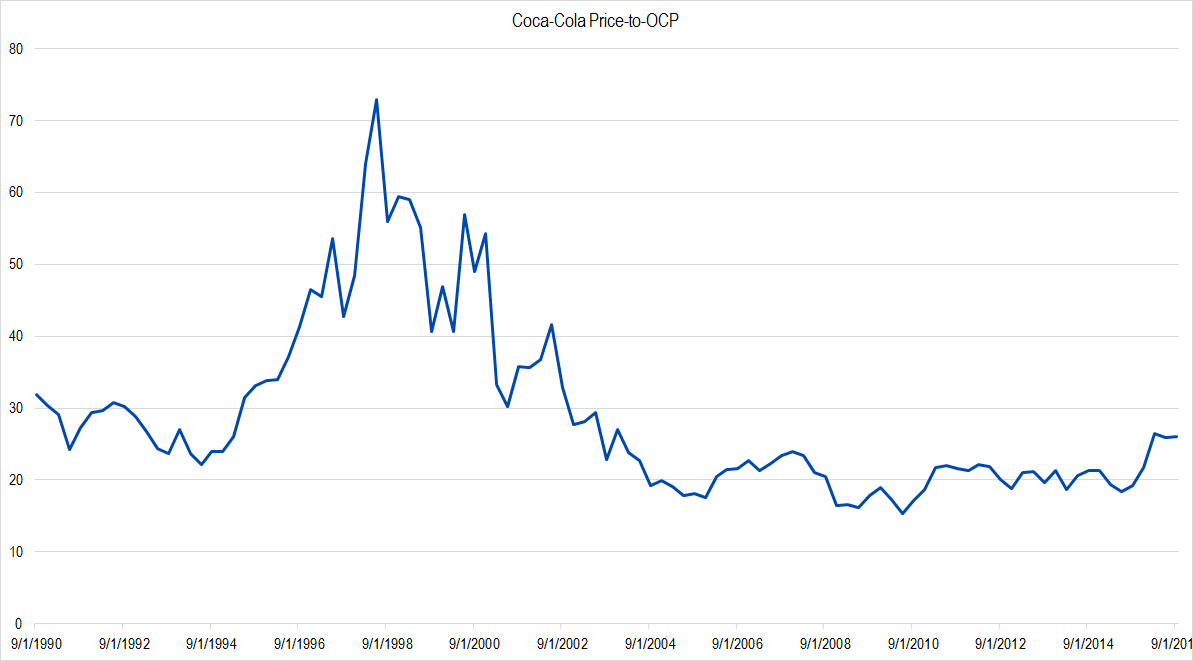
Figure 1. Source: Company Statements, IOI Analysis
Indeed, the ratio of price-to-OCP in the figure above shows a prominent uptick in the recent past over its 10-year average value. Looking back a bit further, though, the present level – in the 26x range – is fairly modest. Assuming a discount rate of 10%, this multiple translates into a growth of trailing twelve-month (TTM) OCP of just over 6% per year in perpetuity. This figure is about one percentage point faster of an assumption than the market has made over the past 10 years, but does not seem terribly unreasonable.
Next, we wondered what the relationship of OCP versus total dividends paid looked like, and pulled data for the chart below.
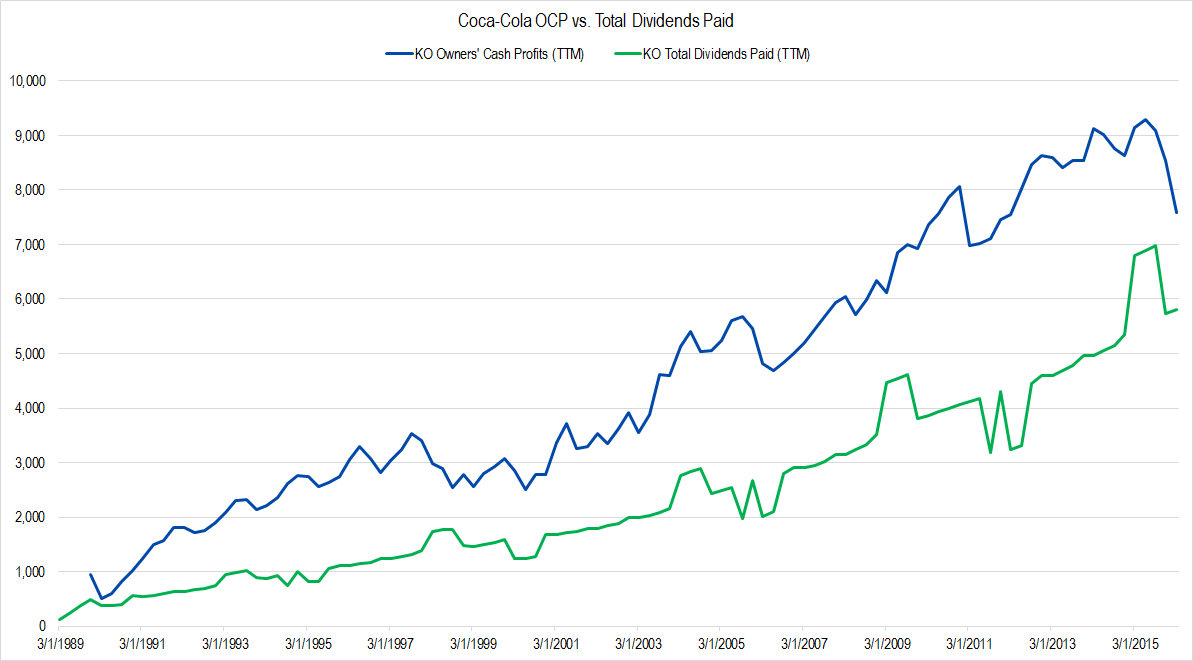
Figure 2. Source: Company Statements, IOI Analysis
Two things interested us about this graph. First, comparing the slope of the green dividend line to the slope of the blue OCP line, it seems that the latter has been steepening over the past ten years. In other words, it looks as though the firm’s payments to owners is not keeping up with the profits generated on behalf of its owners.
The second feature that caught our eye was the steep fall-off of OCP over the past few quarters. Looking back at the company’s financials, nothing stood out as to why profitability may be weakening lately, though some element of dollar strength and, over the past quarter, the building up of current assets (inventories, probably) may explain part of the weakness.
The relationship between the blue and green line made us wonder what the historical value of dividends as a percentage of OCP looked like, so we drew data for the graph below.
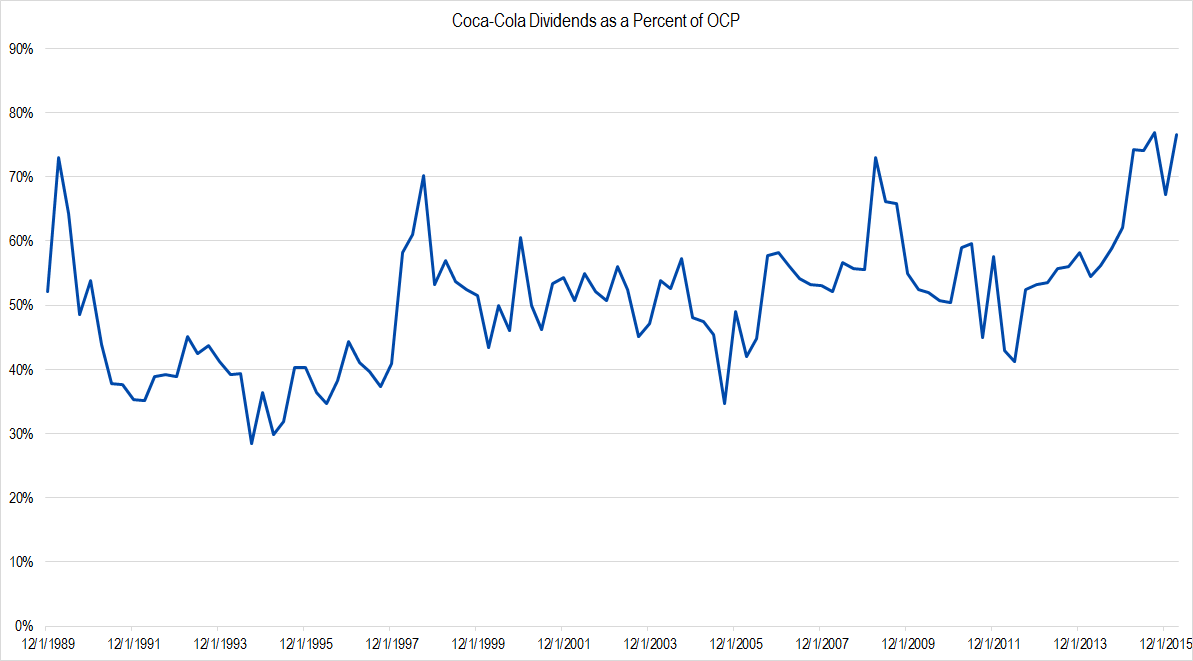
Figure 3. Source: Company Statements, IOI Analysis
Indeed, the average payout ratio over the past 5 quarters has been 74% – well above a “typical” value that looks to fall between 50% and 60%. While the price-to-OCP statistic shown in figure 1 looks benign, the relationship shown in figure 3 makes me want to take a closer look at what might be happening with Coca-Cola’s operations.
Having a better feel for the statistics of a single company, we decided to aggregate the data for 33 of the largest capitalization Consumer Staples companies whose data extended back to 2000 to see if any trends presented themselves from a top-down perspective. We looked at only a single metric – the ratio of aggregate market capitalization to aggregate OCP. Here is the graph of those data:
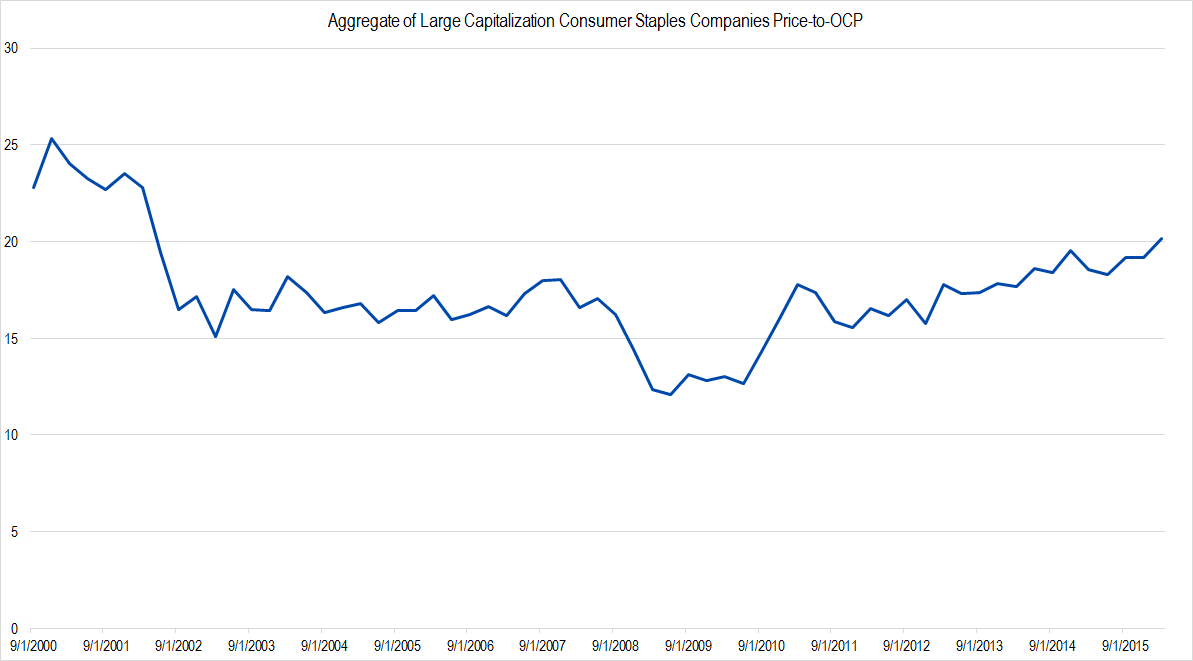
Figure 4. Source: YCharts (data), IOI Analysis
Indeed, we can see that the price-to-OCP ratio for the largest Consumer Staples companies in aggregate has been inching up since the end of the mortgage crisis. However, even at the present ratio implies a perpetual future growth of aggregate OCP for the sector of only around 5% per year.
So are Consumer Staples values stretched? It does not seem that way to us, but the root cause of Coca-Cola’s recent OCP declines is probably worth a second look.