Quarterly earnings announcements are not usually chock full of material information, but because several people have asked about IBM, we’ll do a quick rundown about how the company’s actual performance is tracking vis-a-vis our valuation assumptions.
Even though the stock is down today, we are happy to continue holding the position we highlighted in our last Tear Sheet on the company. Please also see our newest Tear Sheet, using updated price data.
Revenues
IBM generated $19.3 billion of revenues this quarter; added to the first quarter revenues of $18.2 billion gives us a mid-year total of $37.5 billion. Compared to last year’s mid-year total of $38.9 billion ($18.7 billion in 1Q16, $20.2 billion in 2Q16), IBM’s revenue has shrunk by 3.6%. There is some effect of foreign currency changes in the headline number that, when excluded from calculation, would make the drop seem a bit less severe.
Management said that revenues generated by the firm’s “Strategic Imperative” businesses grew by 12% year-over-year, which would imply a 13% fall in its legacy business over the same period. At the end of this quarter, Strategic Imperatives revenues made up 43% of the firm’s total.
This all lines up nicely with our revenue forecasts for the company.
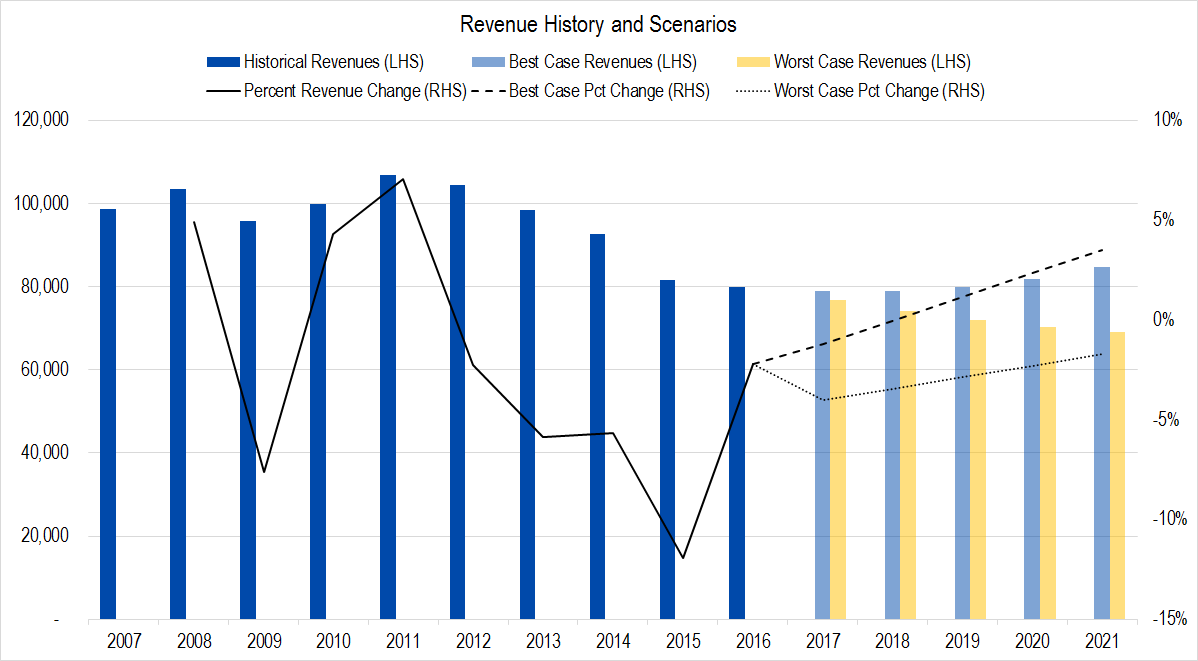
Figure 1. Source: Company Statements, Framework Investing Analysis
Our worst-case revenue growth assumption for 2017 is for contraction of 4.0%, slightly more severe than actual, and if currency effects are removed, 1Q17 revenues are just about in the middle between our best- and worst-case revenue assumptions.
(Currency effects are only important if 1) the effects never reverse – which is unlikely – or 2) the firm is generating cash in one currency but must pay its financial obligations in another that is strengthening. We do not believe either of these situations apply to IBM.)
We have modeled Strategic Imperatives to grow at a best-case rate of 12% per year and Legacy business to shrink at a best-case rate of 10% per year. The fact that Legacy business shrunk a bit faster than our projections this quarter explains why revenues came in toward the lower end of our range. It’s important to note that one of the reasons that it is tough to put too much emphasis on quarterly announcements is that timing issues (e.g., a contract signing that slides into the next quarter) can affect this number. So far, we have no reason to believe that our revenue growth range for this year are wrong.
Profits
Unfortunately, IBM does not provide Statements of Cash Flows with its earnings announcement, but rather just gives an overview. As such, our comments about profits rely on an assumption about maintenance capital expenditures (maintenance capex).
The company reported $7.4 billion in Cash Flow from Operations in the first half of 2017 (compared to $9.0 billion in 1H16). It reported a combined figure for Depreciation and Amortization of Intangibles of $2.2 billion this half, and judging by IBM’s quarterly financial statements for 2016, we believe this translates into an expenditure of maintenance capex of around $1.4 billion. If this is correct, this implies the firm generated $6.0 billion in Owners’ Cash Profits during the first half of 2017, which implies an OCP margin of ($6.0 / $37.5 =) 16.0%. This is precisely in the middle of our best- and worst-case profitability range.
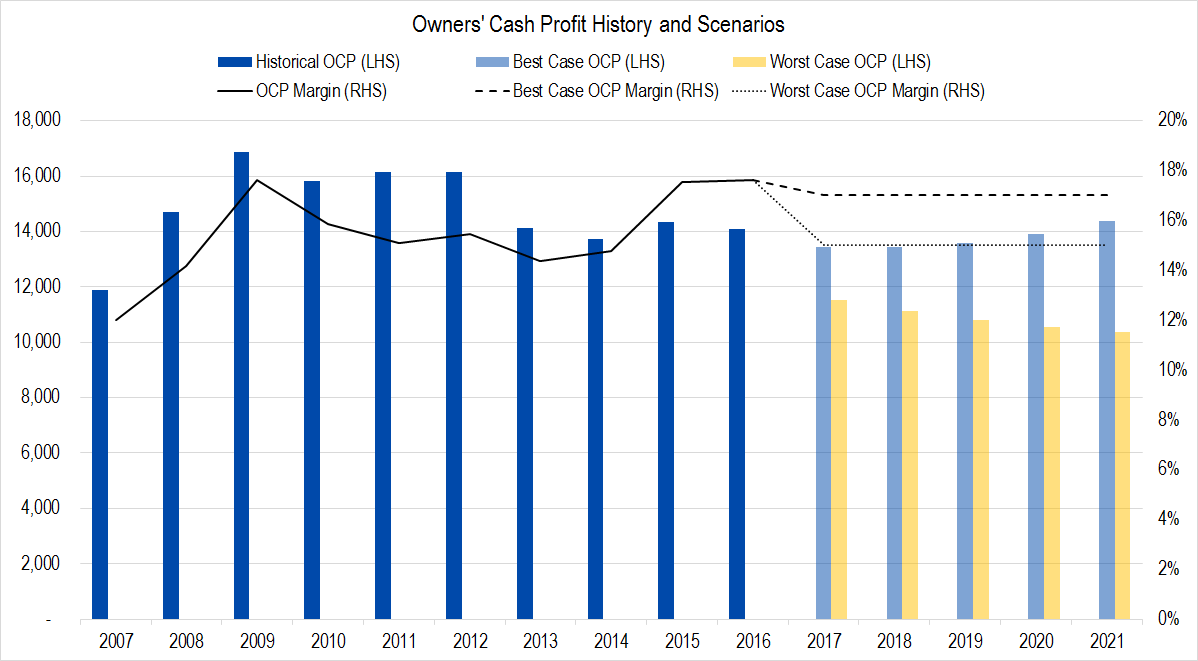
Figure 2. Source: Company Statements, Framework Investing Analysis
On an absolute basis, our best-case OCP forecast is that the firm will generate around $13.0 billion this year and our worst-case is that it will generate around $11.5 billion. In contrast, the OCP run-rate is just $12.0 billion – a little closer to the bottom end because of the revenue weakness.
Investments
No company provides enough disclosure in its earnings announcement to accurately calculate Framework’s measure of investment spending: Net Expansionary Cash Flow. From the disclosure IBM does offer, we think total Net ECF will come in at around $500 million for the first half of the year – 8% of OCP so far.
In contrast, our model assumes the company will spend 25% of its profits on investment spending. If IBM were to have spent 25% of its profits in the first half of 2017, it would have spent $1 billion more than we have assumed it has. As such, first half Free Cash Flow to Owners (FCFO) should be on the high side of our projections.
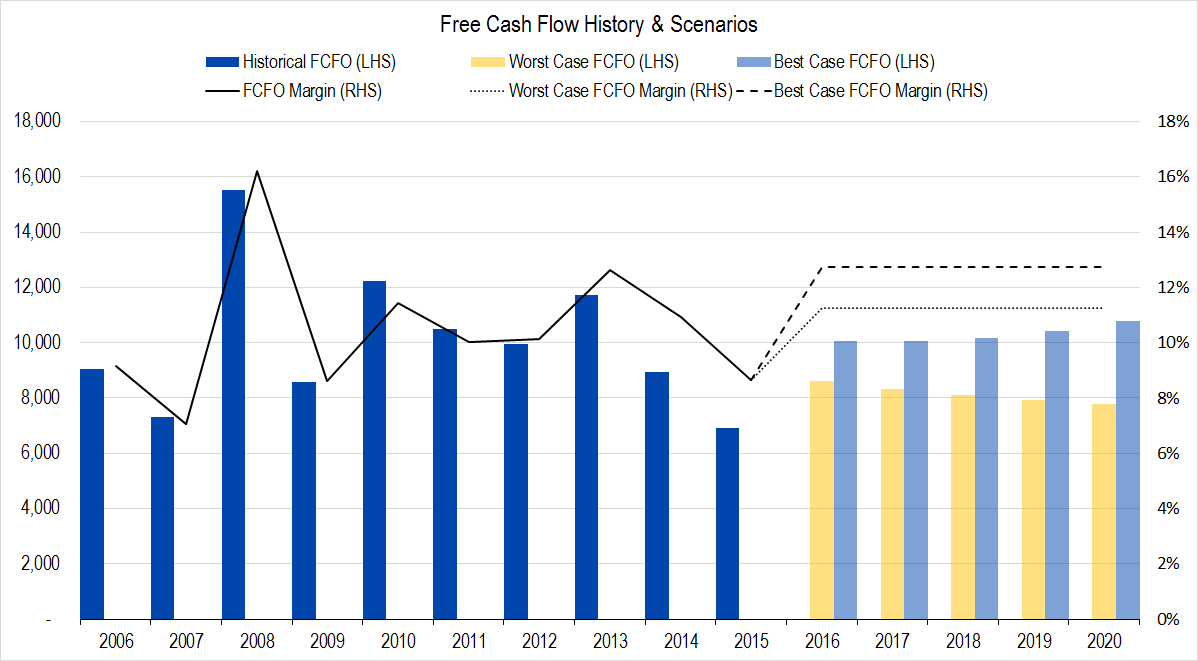
Figure 3. Source: Company Statements, Framework Investing Analysis
That said, you should take this FCFO datapoint with a grain of salt. Investment spending is not constant, and we view the 25% forecast as the company’s capital investment requirements over the next five years, not over any single quarter or even any single year.
Valuation
There is no reason to alter our medium-term growth view based upon two recent quarters of earnings results, so we are leaving these unchanged.
 Loading...