You can discuss Nike (NKE) here on the Framework Forum.
Video Transcript
Nike is a great company – we have been impressed with how well the company creates demand and with the stability at which it converts revenues to profits. However, viewing Nike’s results through the lens of our valuation framework, we believe the market has gotten ahead of itself in terms of its share price.
Our valuation framework focuses in on a handful of fundamental drivers, of which there are only three main ones in the short-term and one related one in the medium-term. We’ll work through each one-by-one.
Revenues
Nike’s revenue growth rates are astounding.
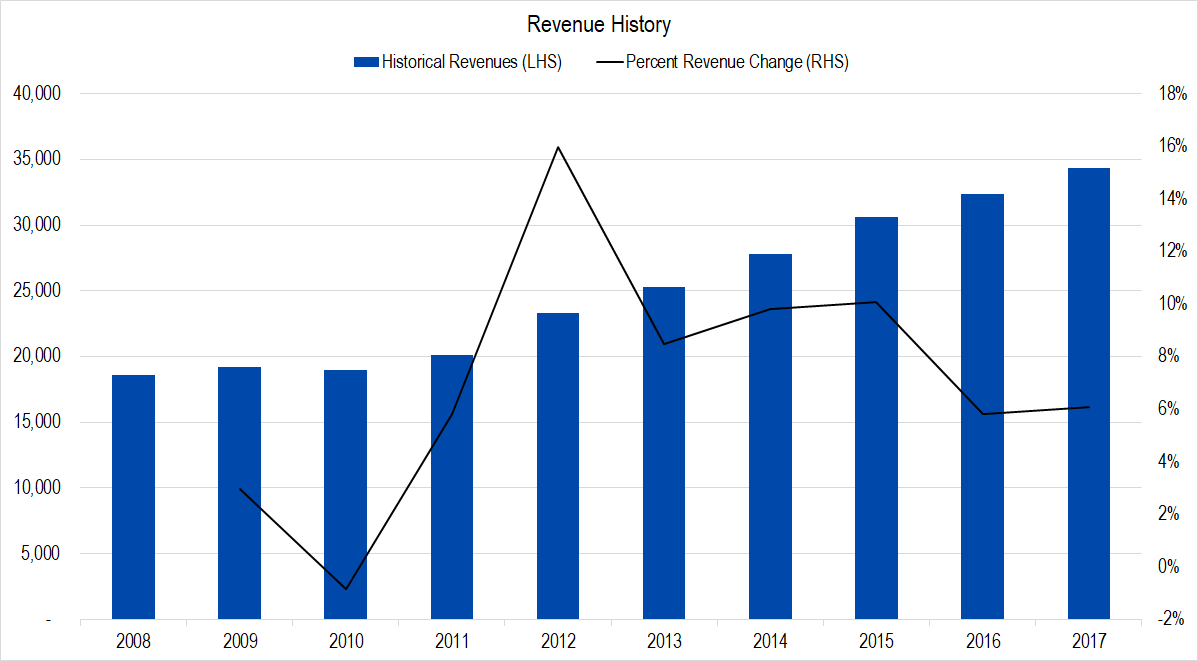
Figure 1. Source: Company Statements, Framework Investing Analysis
In this graph, revenues are represented by the blue columns and read off the left-hand scale and year-over-year growth rates are represented by the black line and read off the right-hand scale. Over this entire period, five-year average revenue growth rates have dependably been in the upper single-digit range, though the last few years have seen a slow-down.
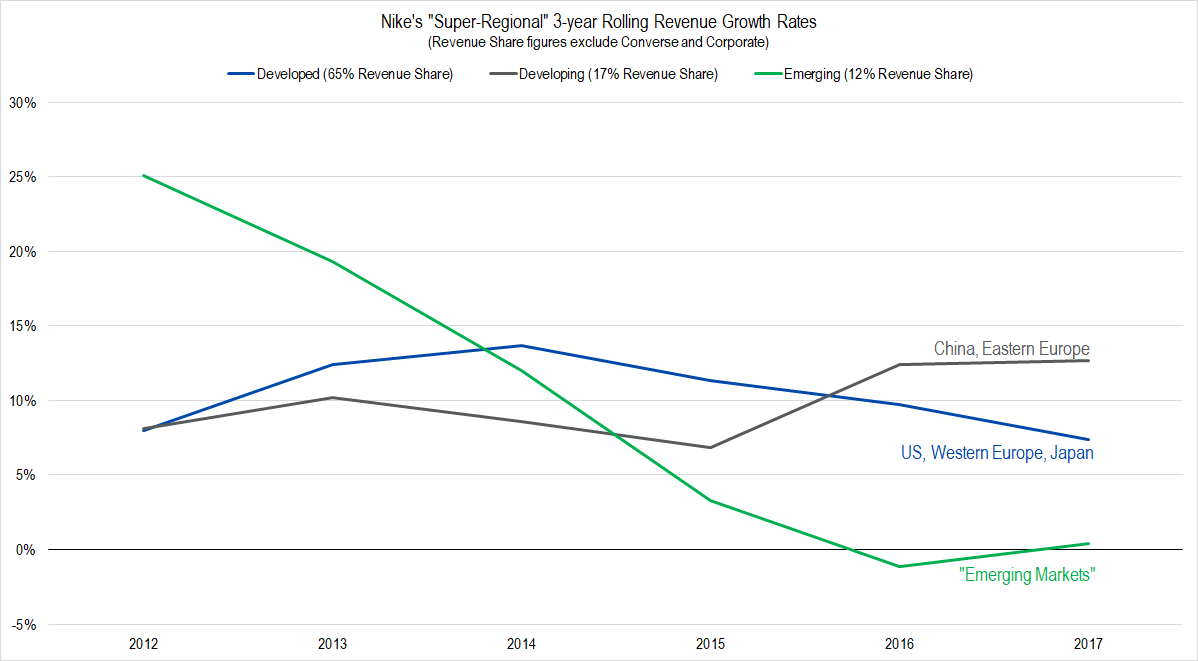
Figure 2. Source: Company Statements, Framework Investing
Digging into the slow-down, we can see that the weakness is mainly due to softness in both the Developed and Emerging Market regions. However, a large component of this was foreign currency fluctuations; viewing revenues on a currency-neutral basis shows us that underlying demand is strong.
We think that annual revenue growth over the next five years is likely to average 6% in the worst case – shown by the dotted line here – and 9% in the best – shown by the dashed line – driven by brisk sales in China, especially. These best- and worst-case forecasts imply that 2022 revenues will range between $46 billion – shown by the light-yellow column – and $54 billion – represented by the light blue column – compared to $34 billion in the year just ended
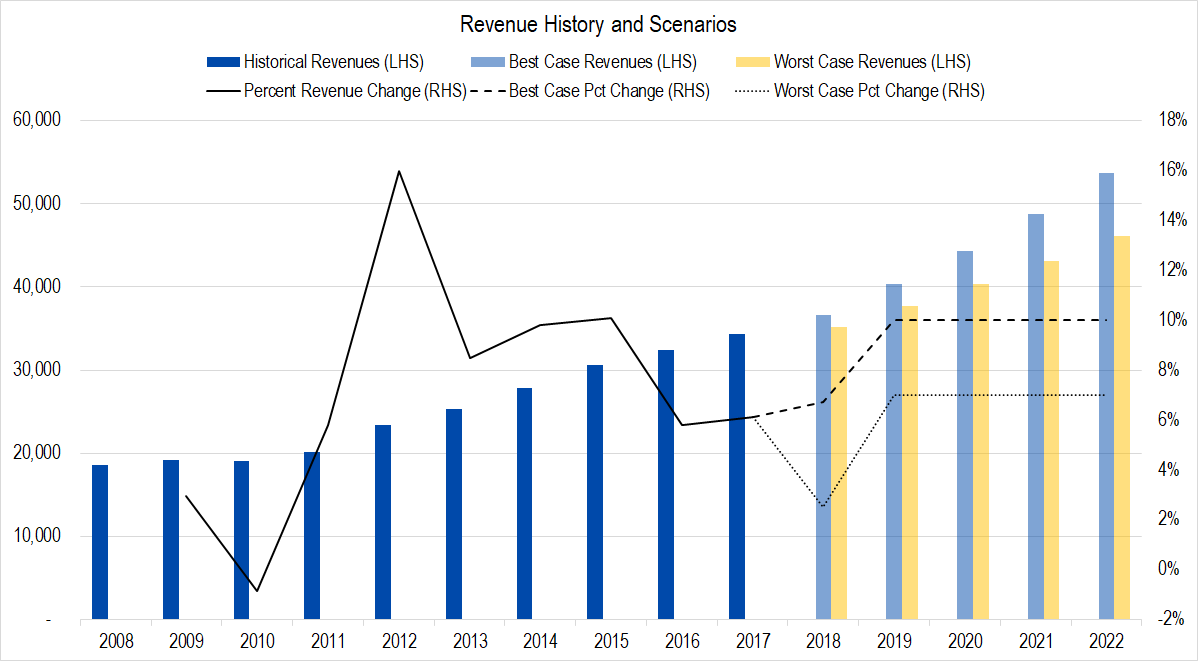
Figure 3. Source: Company Statements, Framework Investing Analysis
Profits
Our preferred metric is called Owners’ Cash Profits – OCP – which is based on the firm’s cash flows.
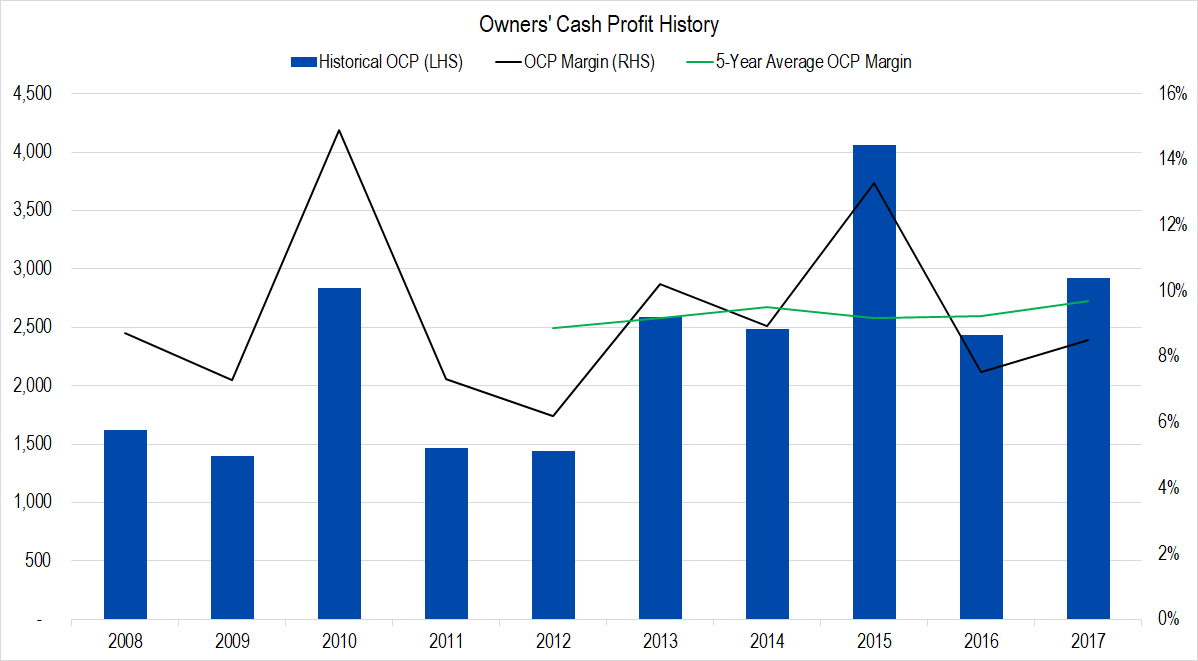
Figure 4. Source: Company Statements, Framework Investing Analysis
While there is some volatility year-to-year, the trailing five-year average OCP margin is very stable between 9% and 10%. Operating Earnings – EBIT – also appears very stable on a trailing twelve-month basis.
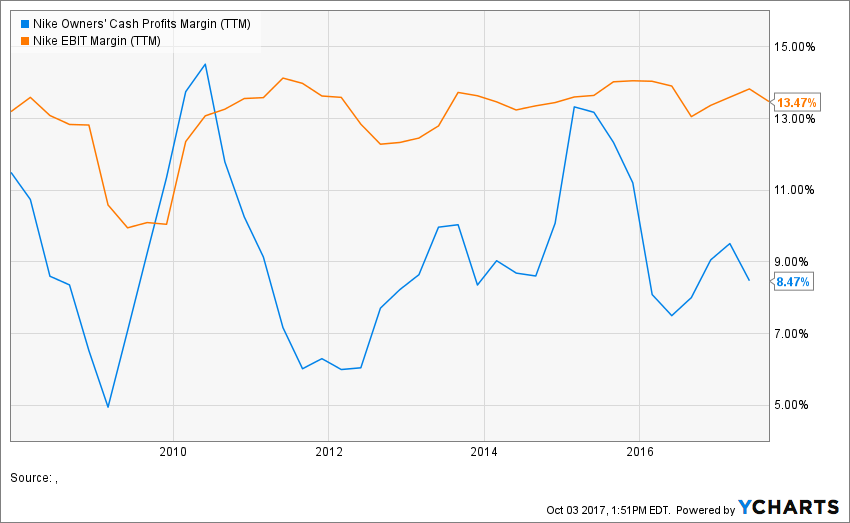
Figure 5.
Still, investors seem convinced that Nike will be able to increase profitability, so we are giving the firm the benefit of the doubt and assuming that average best-case profitability will increase by 100 basis points versus historical to an OCP margin of 11%. Worst-case, we assume that average profit margins will be in-line with the historical values – 9%.
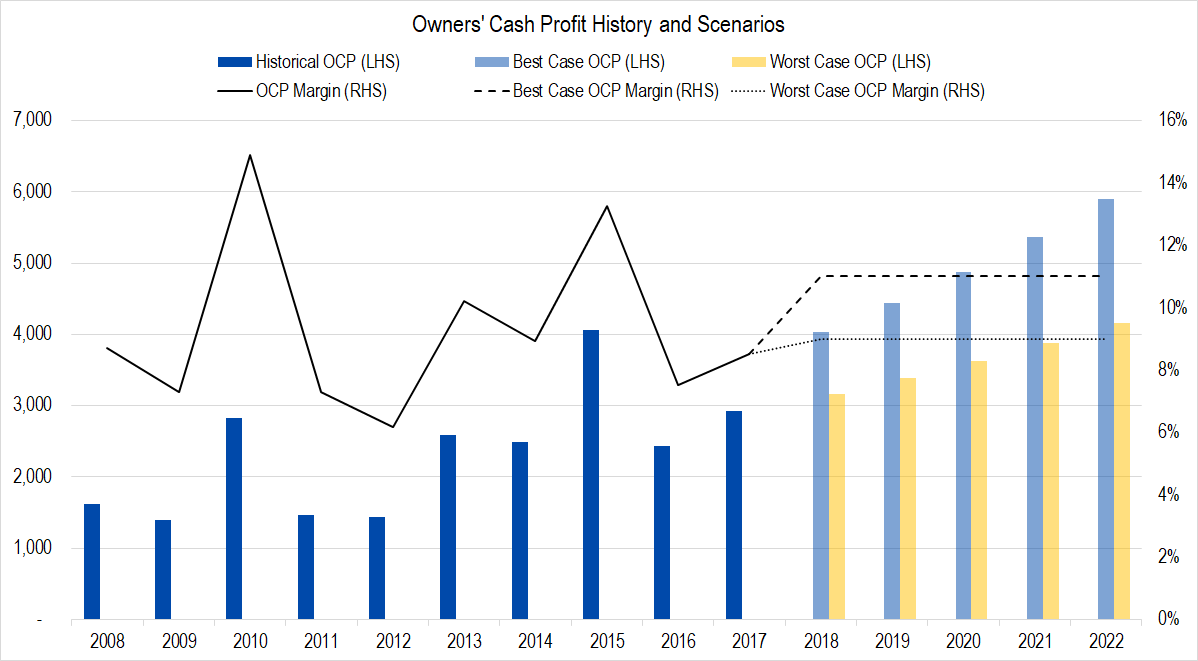
Figure 6. Source: Company Statements, Framework Investing Analysis
Investment Spending
In this graph, the wide gray columns represent Owners’ Cash Profits generated by the firm and the blue columns, the amount the company spent on investments. Over the past 10 years, the firm has spent roughly a quarter of its owners’ profits on growth investments.
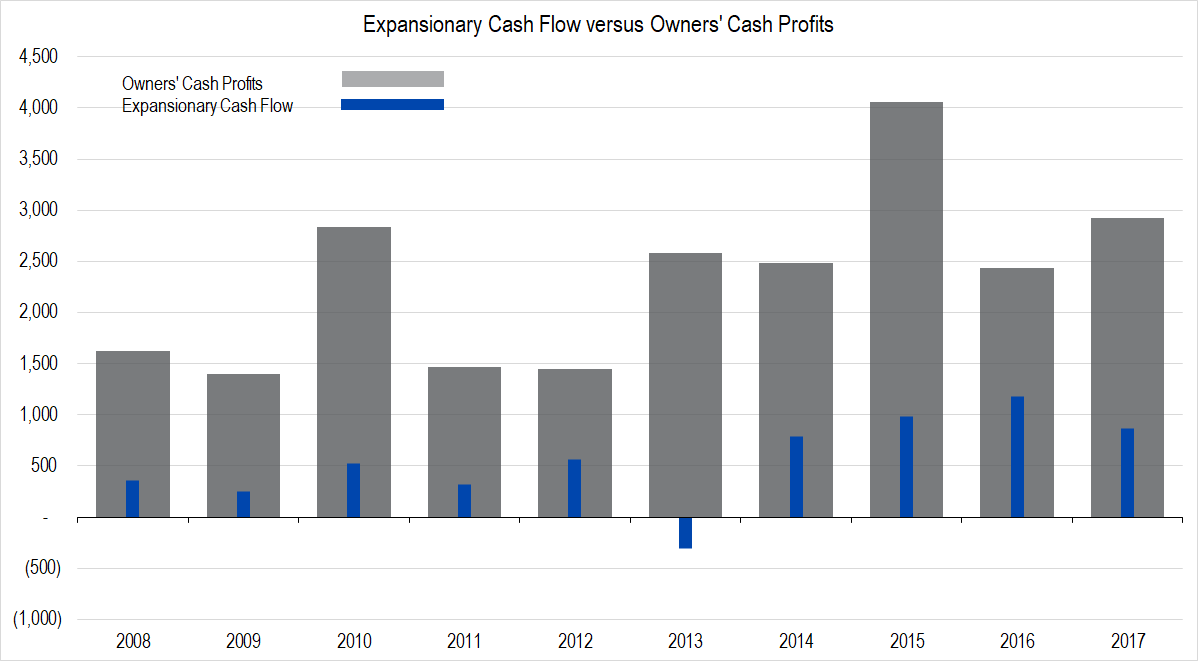
Figure 7. Source: Company Statements, Framework Investing Analysis
However, Nike shareholders should take note that a large proportion of the firm’s investments consisted of what we call “Anti-dilutive stock buybacks”. This is an estimate of the cash value of stock and option issuance to Nike executives and managers, as shown by the prominent green parts of the column in this graph.
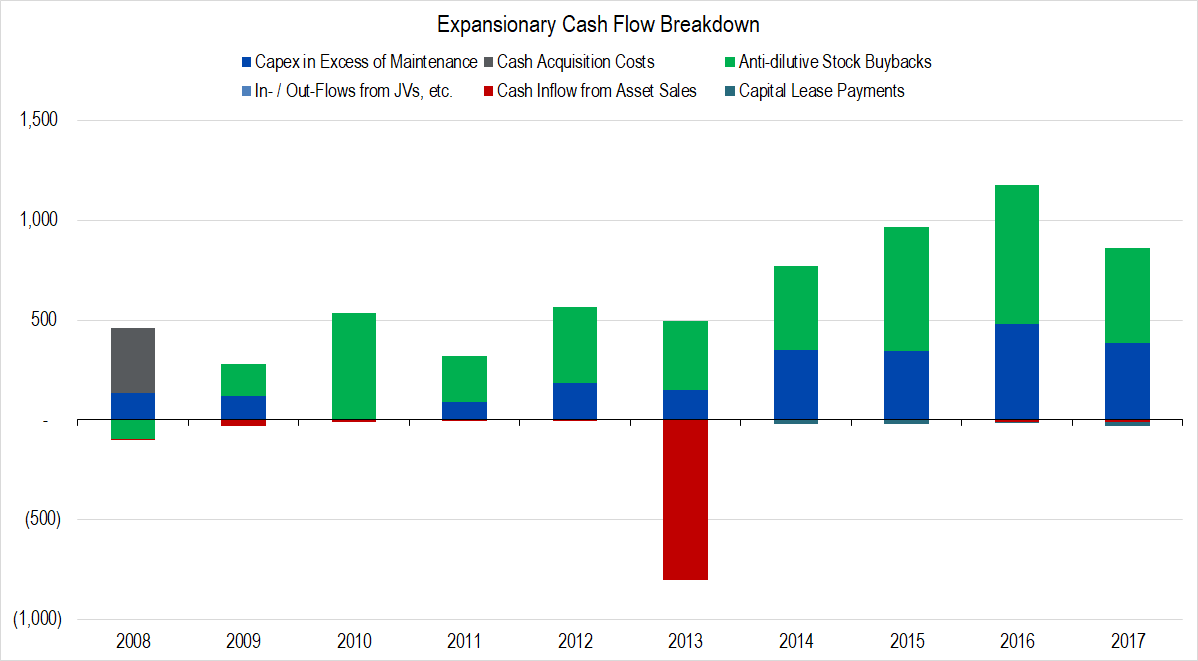
Figure 8. Source: Company Statements, Framework Investing Analysis
Assuming that Nike will continue to spend about the same amount in its investments, we figure Nike will be generating between $0.07 and $0.08 of Free Cash Flow to Owners (FCFO) for every dollar in revenues generated over the next five years.
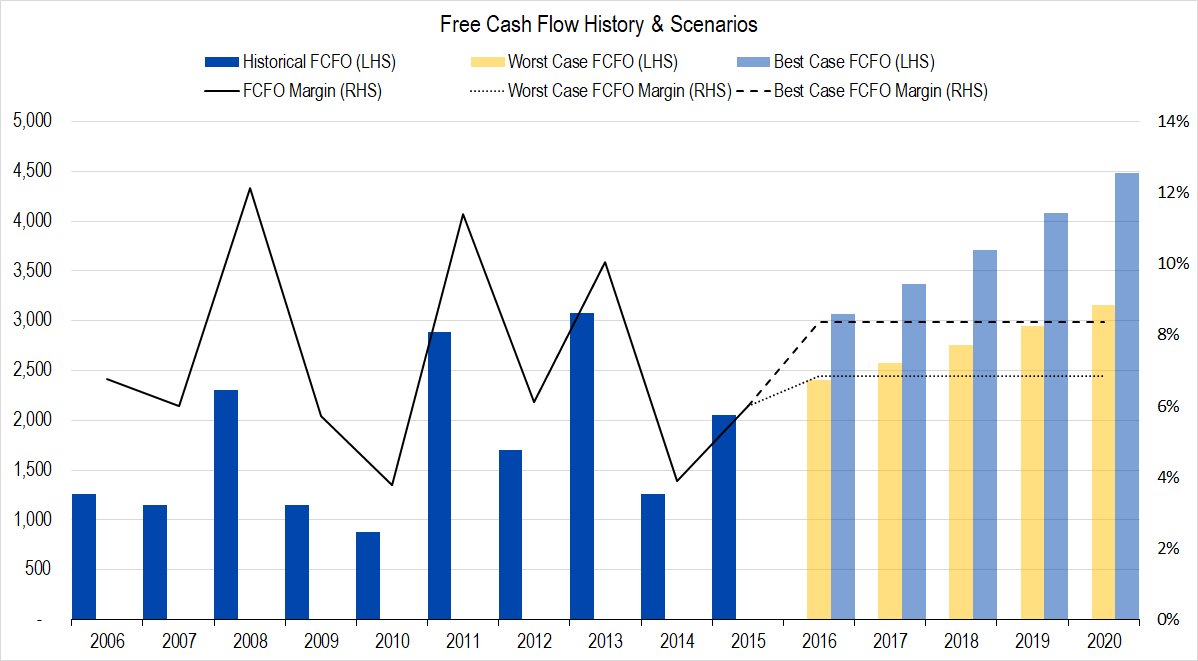
Figure 9. Source: Company Statements, Framework Investing Analysis
Medium-Term Growth
Nike has a phenomenal track record of generating profit growth that is much greater than the economy overall. This is unusual for a company that has been around so long. We are forecasting medium-term cash flow growth of 10% per year in the best case and 8% per year in the worst and assume that medium-term will last five years.
Valuation
Pulling this all together gives us a best-case valuation of $53 and a worst-case valuation of $35 per share with an equal weighting of all our eight valuation scenarios at $43 per share.
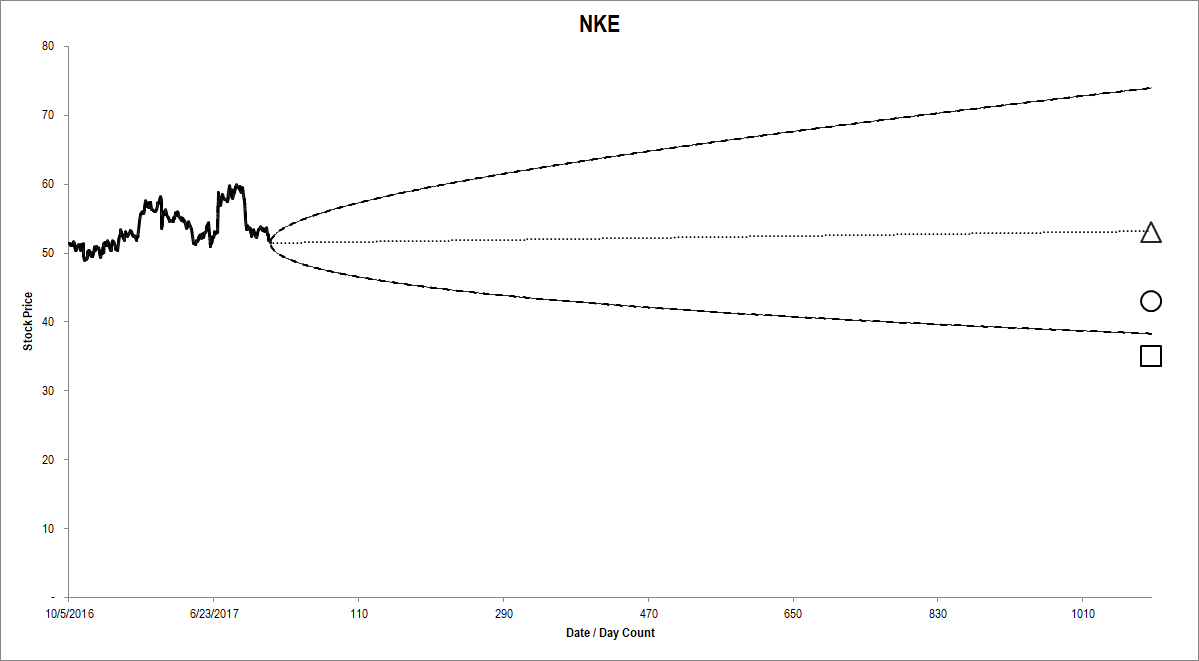
Figure 10. Source: YCharts, CBOE (data), Framework Investing Analysis
In comparison, the option market’s implied price forecast – represented by the cone and dotted line – suggests there is a much greater upside potential for Nike. The market’s projected most-likely future price about where we see Nike’ best-case valuation. This suggests that Nike’s stock is overvalued now.
We went back and changed our assumptions for medium-term growth to last for 10 years rather than five. This is pretty unlikely in our opinion; it’s been shown that large cap stocks generally do not show that kind of very long, very rapid growth. Even making this heroic assumption, the stock still looks moderately overvalued.
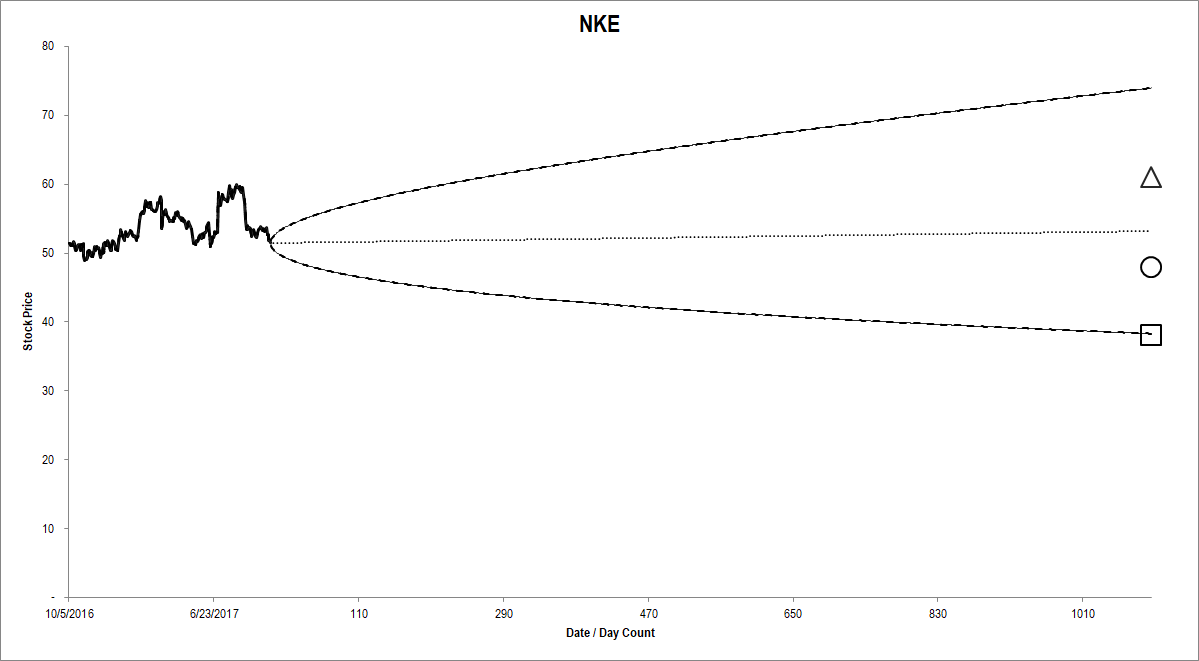
Figure 11. Source: YCharts, CBOE (data), Framework Investing Analysis
We are not interested in taking a bearish position in Nike, but those of you with positions in the company are encouraged to download a copy of our model and take a look at our assumptions for yourselves.