When Kroger took a shellacking after guiding current year earnings lower, it caught my attention.
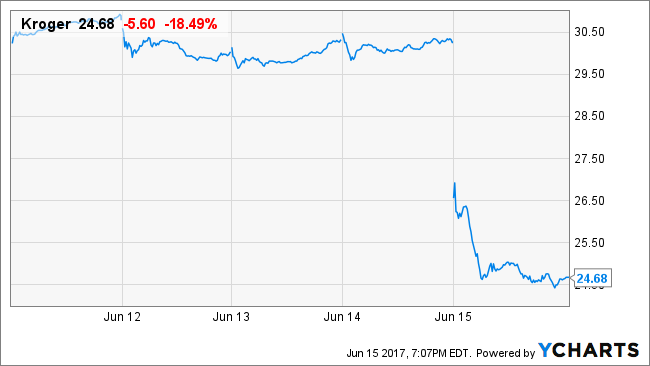
Figure 1
We had researched Kroger last year after researching Whole Foods Market, and I knew Kroger as a well-run company, with some great advantages, especially compared to Whole Foods.
The very next day, Amazon announced it would acquire Whole Foods, and Kroger belly-flopped again.
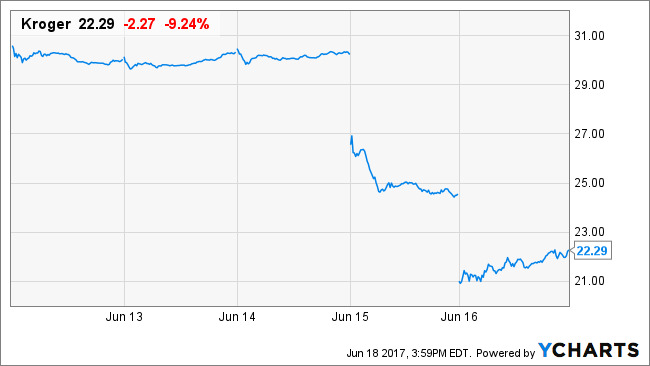
Figure 2
With drops as extreme as this, I had to apply our valuation framework to the company to see if there was an investment opportunity. Our valuation framework focuses in on a handful of fundamental drivers, of which there are only three main ones in the short-term and one related one in the medium-term. We’ll work through each one-by-one.
Revenues
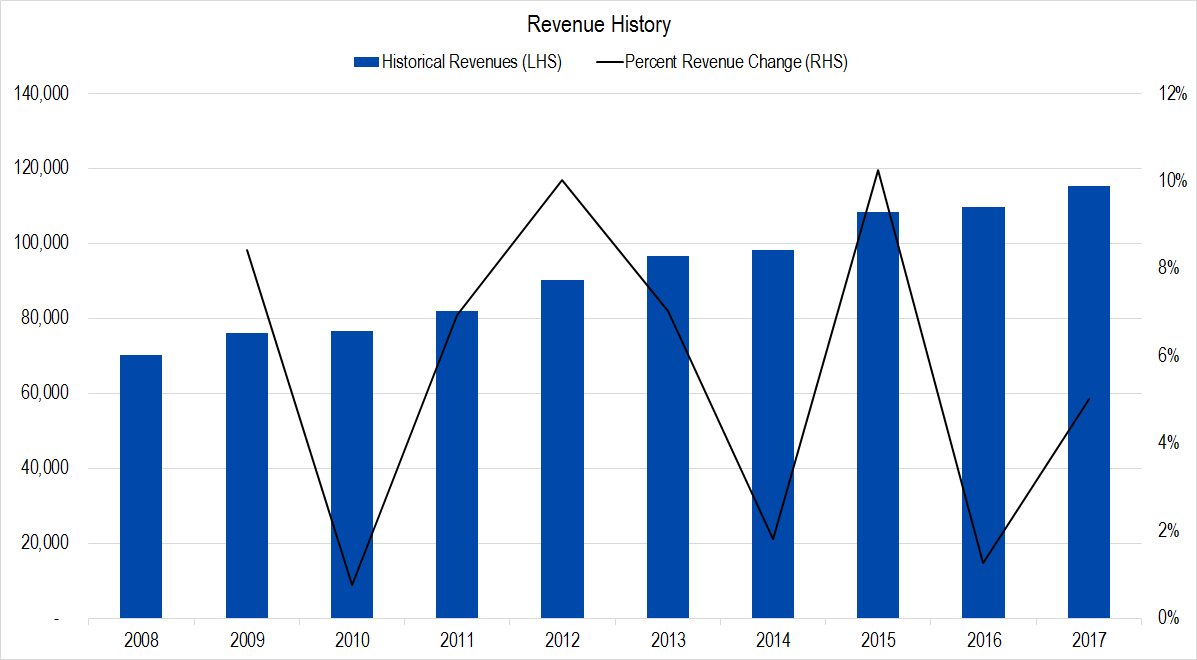
Figure 3. Source: Company Statements, Framework Investing Analysis
In this graph, we can see from the saw-toothed black line showing revenue growth rate that Kroger has had several years of very strong growth. Over this entire period, revenues have grown at an average rate of nearly six percent per year – thanks to its stealing share from Whole Foods and other organic specialty grocers and also to acquisitions.
On a five-year basis, the fastest annual growth was 7% per year and the slowest, 5% per year. We’ll use these values for our best- and worst-case estimates respectively.
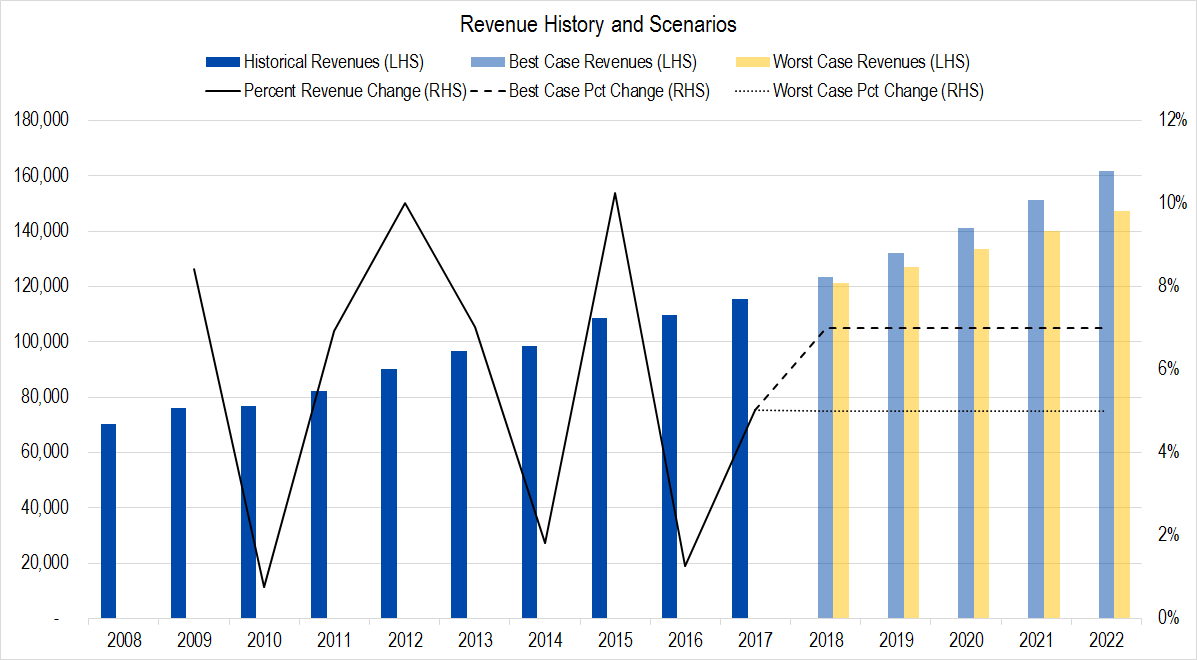
Figure 4. Source: Company Statements, Framework Investing Analysis
This is what our graph looks like now – light blue columns being best-case, yellow columns being worst.
Profits
Our preferred metric is called Owners’ Cash Profits – OCP – which is based on the firm’s cash flows.
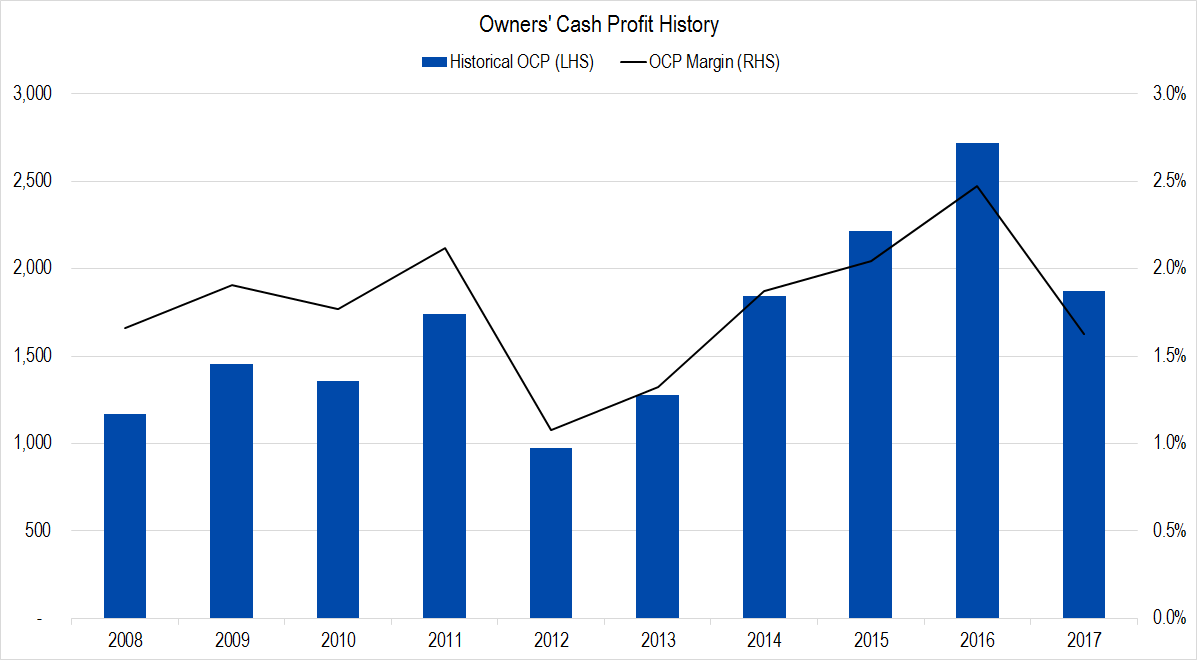
Figure 5. Source: Company Statements, Framework Investing Analysis
The most notable thing about this chart is the steep, steady rise in OCP margin in the years from 2012-2016. We believe this is due to Kroger’s increased exposure to relatively high-margin organic foods, prepared foods, and home brands. This profitability mean-reverted in 2017, and we are forecasting near-term profitability in the 1.5% – 2.5% margin range. Making the change in our model creates a graph like this.
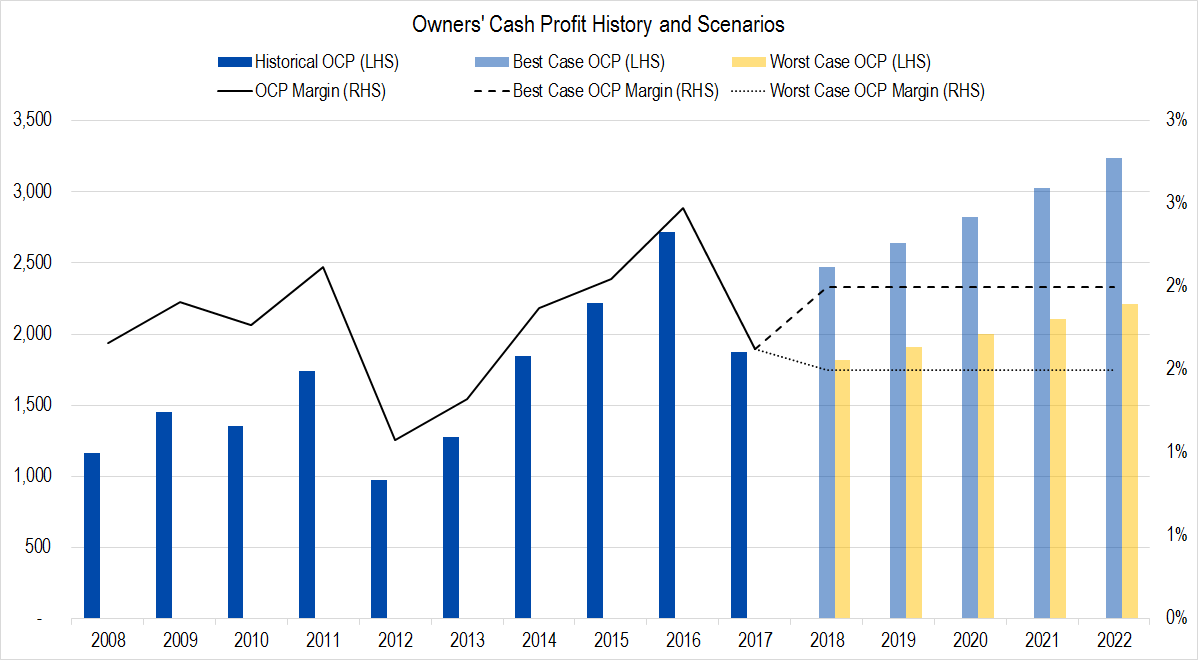
Figure 6. Source: Company Statements, Framework Investing Analysis
Investment Spending
In this graph, the wide gray columns represent Owners’ Cash Profits generated by the firm and the blue columns, the amount the company spent on investments. Note the big rise in investment spending – mostly acquisitions – in the last four years.
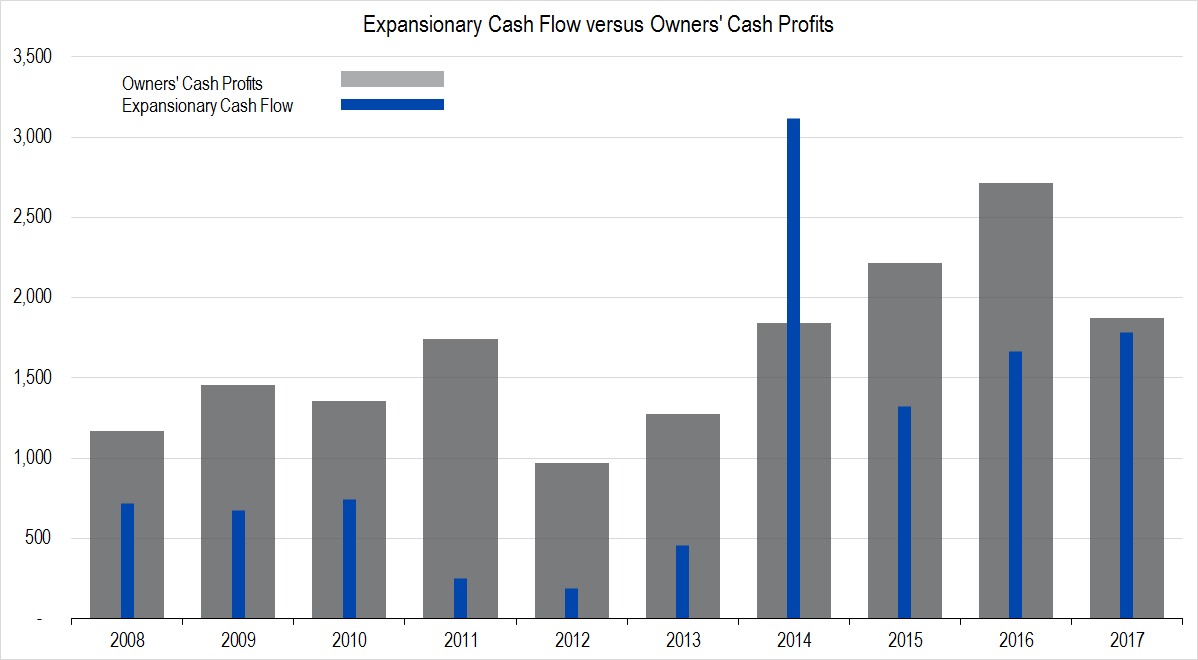
Figure 7. Source: Company Statements, Framework Investing Analysis
While the recent average is higher, Kroger has historically spent roughly half of its profits on investments. If we assume it will do this over the next five years, we estimate it will be producing between three-quarters of a cent to one cent of Free Cash Flow to Owners (FCFO) for every dollar in revenues generated.
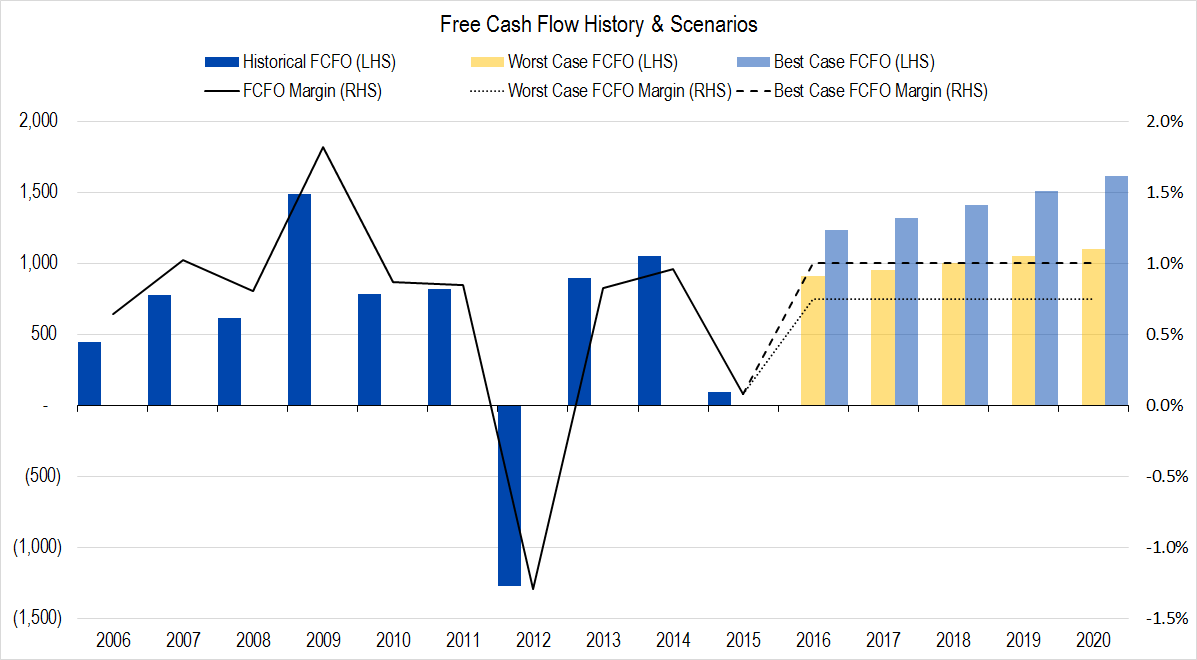
Figure 8. Source: Company Statements, Framework Investing Analysis
Medium-Term Growth
People realized with the Amazon-Whole Foods announcement that the world of grocery is changing. It is tough to tell how Kroger will fare in the medium-term, so we are forecasting a wide range FCFO growth – expansion of 10% per year in the best case and contraction of 1% in the worst.
Valuation
Pulling this all together gives us a best-case valuation of $34 and a worst-case valuation of $16 per share with an equal weighting of all our eight valuation scenarios at $24 per share.
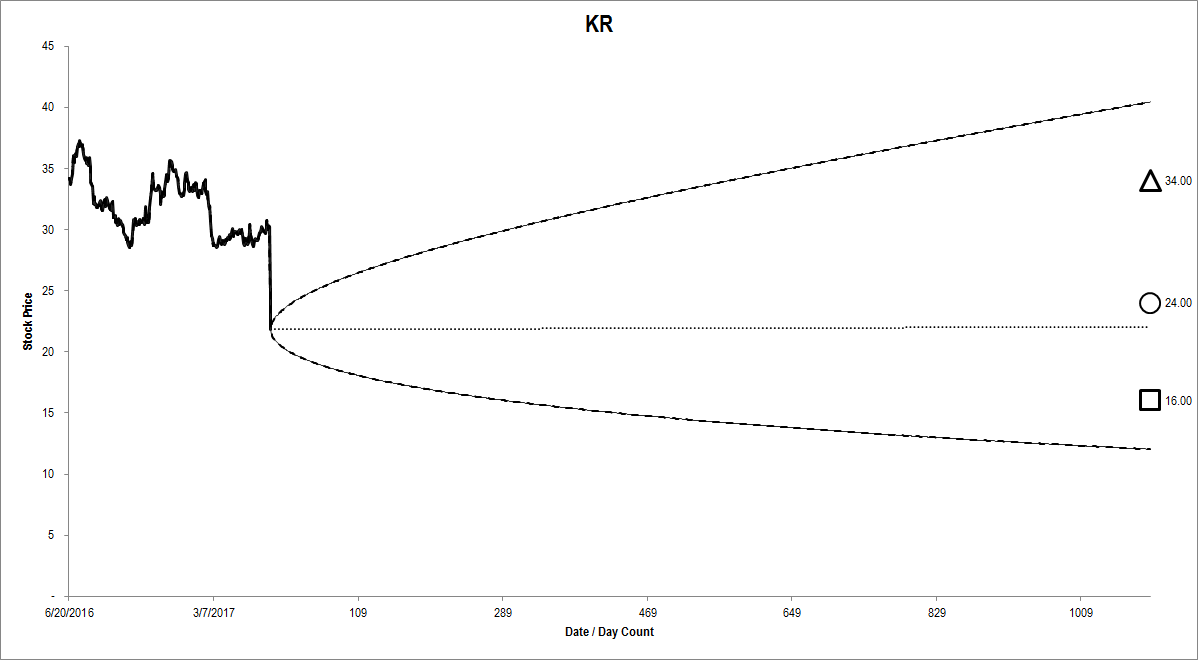
Figure 9. Source: CBOE, YCharts, Framework Investing Analysis
While there are several valuation scenarios lower than Friday’s closing price, we thought there was enough of a mispricing of downside insurance that it was worth a low-conviction investment in the firm. We recommended an investment selling Kroger’s At-the-Money (ATM) put options expiring in October. If the entire amount of premium received is realized as income, we will be able to generate a return of 9% over just four months. This strategy can also be executed as a Covered Call – which represents an identical risk-return profile as the sold put shown here.
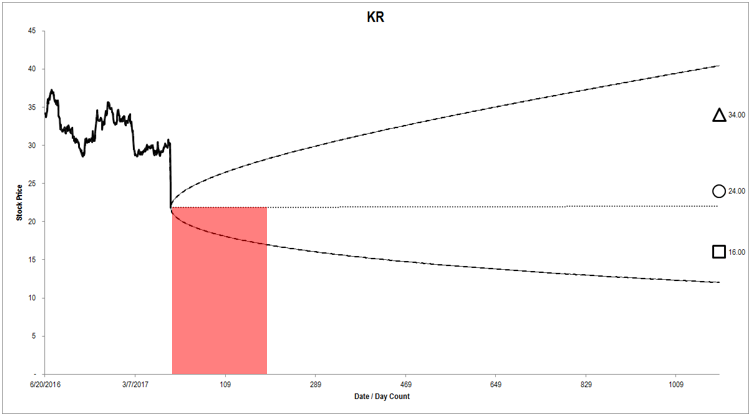
Figure 10. Source: CBOE, YCharts, Framework Investing Analysis