Last week, we published a valuation model for US technology consultant and outsourcing provider Accenture ACN. Over the last week, long-time Framework member and partner, Sheila Chesney, and I have been looking more closely at Accenture, but are not in perfect agreement as to if there is the potential for an investment in the company.
Sheila likes the predictability of the business and of the valuation drivers and sees the potential for a bond replacement investment (e.g., cash-secured short put / covered call) in the firm. I see the predictability, but just can’t get over the price at which the company is trading and am hesitant to recommend a bond replacement on a stock I see as overvalued.
We’ve charted out Accenture’s valuation drivers and value in the sections below. What do you think? We’d love to hear your perspective on the Framework Forum thread started by long-time Framework member Carey C.
Sheila and I both decided that it was too rich to own right now and that current owners might want to trim their positions, but that it looks like an interesting name for a possible bond replacement investment in a pullback. I have had such a frustrating time with Union Pacific and Caterpillar shorts that I am hesitant to recommend a short position.
Revenues
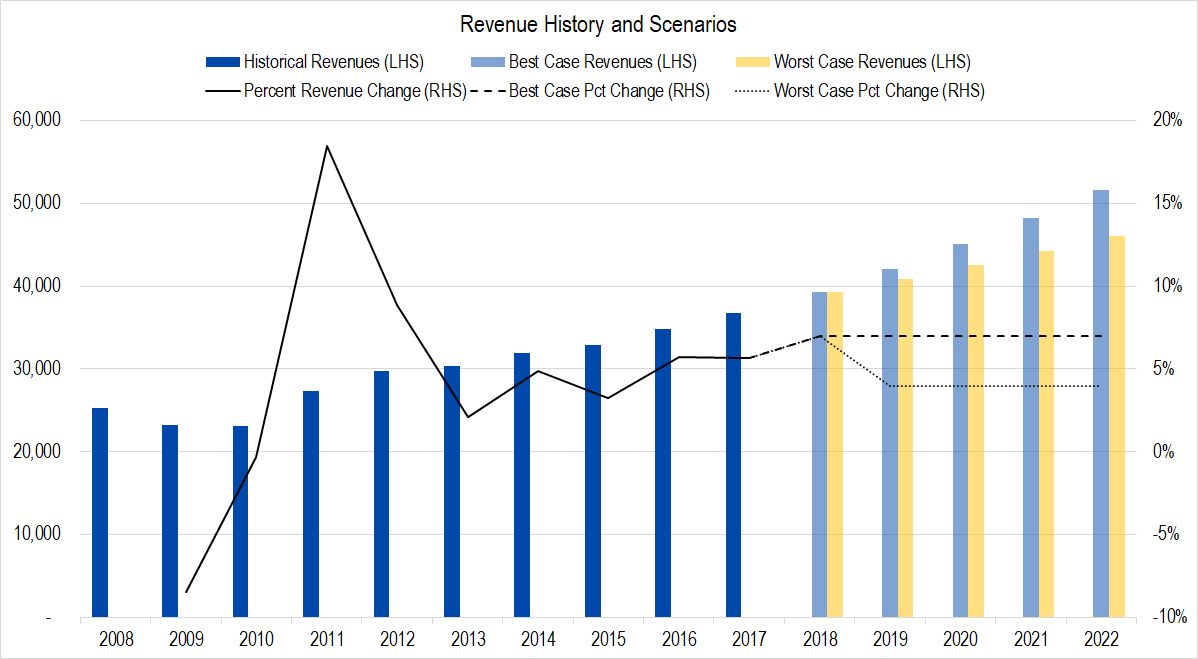
Figure 1. Source: Company Statements, Framework Investing Analysis and Projections
The Great Recession meant that corporate purse strings were tight for the years 2009-2010, but the bounceback demand in 2011 was strong. Other than that anomalous period, Accenture has steadily generated revenue increases in the mid- to high-single digit percentage range. Accenture’s consulting practice segments are, in order of 2017 revenue share:
- Products: Retail and Consumer Goods, Industrials, and Life Sciences – 27% of revenues
- Financial Services: 21%
- Communications, Media & Technology: 20%
- Health & Public Service: 18%
- Resources: Chemicals, Energy, and Utilities – 14%
- Other: 0.1%
Note that the firm closes its books on August 31, so the FY 2018 projection is a tight range based on sell-side estimates. The next four years of Framework projections bound its historical revenue growth range.
Profits
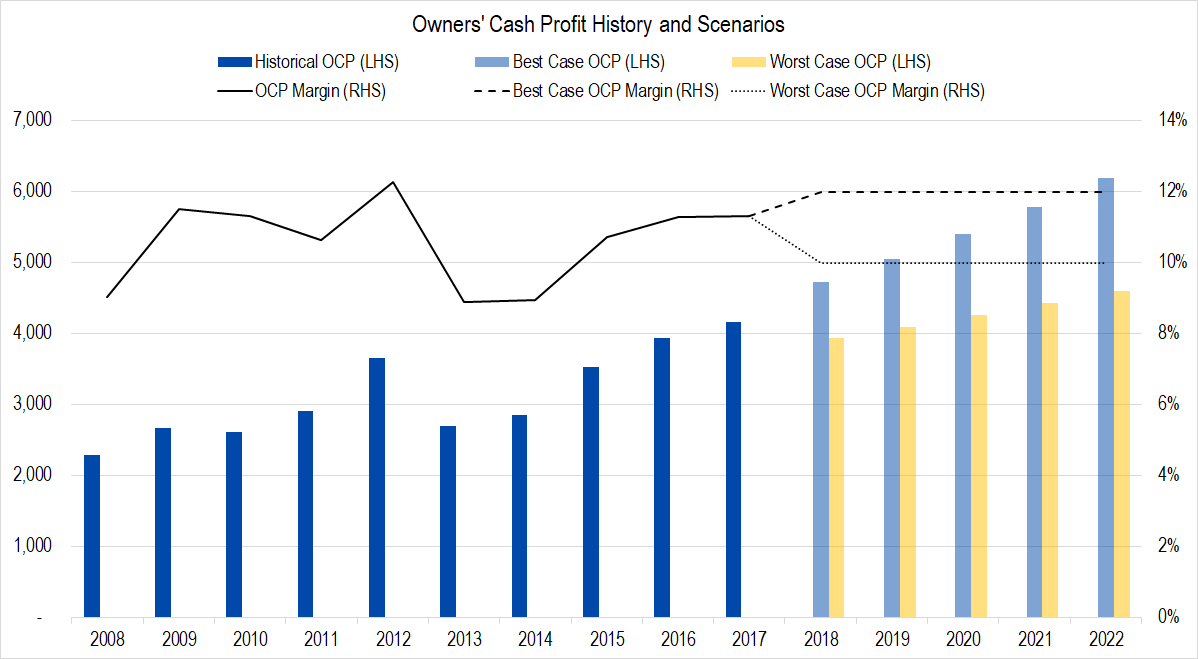
Figure 2. Source: Company Statements, Framework Investing Analysis and Projections
The company reorganized in 2013 and drew down deferred tax assets in 2014, then experienced a big uptick in what amounts to deferred revenues in 2014, causing that dip you see on the graph for those two years. However, other than that, the company has very predictably generated Owners’ Cash Profit (OCP) margins in the 10%-12% range. We have used that range as our best- and worst-case forecasts.
Investments

Figure 3. Source: Company Statements, Framework Investing Analysis
The company’s cornerstone is its intellectual property, not factories or machines, so depreciation charges usually run higher than capex spending (suggesting that the OCP might be a bit higher than we’ve shown in Figure 2. Profitability levels are not as important to valuation as FCFO, and FCFO doesn’t change when we classify capex as a maintenance cost or not).
Most of the spending is in acquiring smaller consulting practices and technology firms, though the company does spend a good bit on anti-dilutionary stock buybacks as well. Our estimates suggest that it has been paying its employees the equivalent of around $850 million per year on average over the last five years.
Free Cash Flow
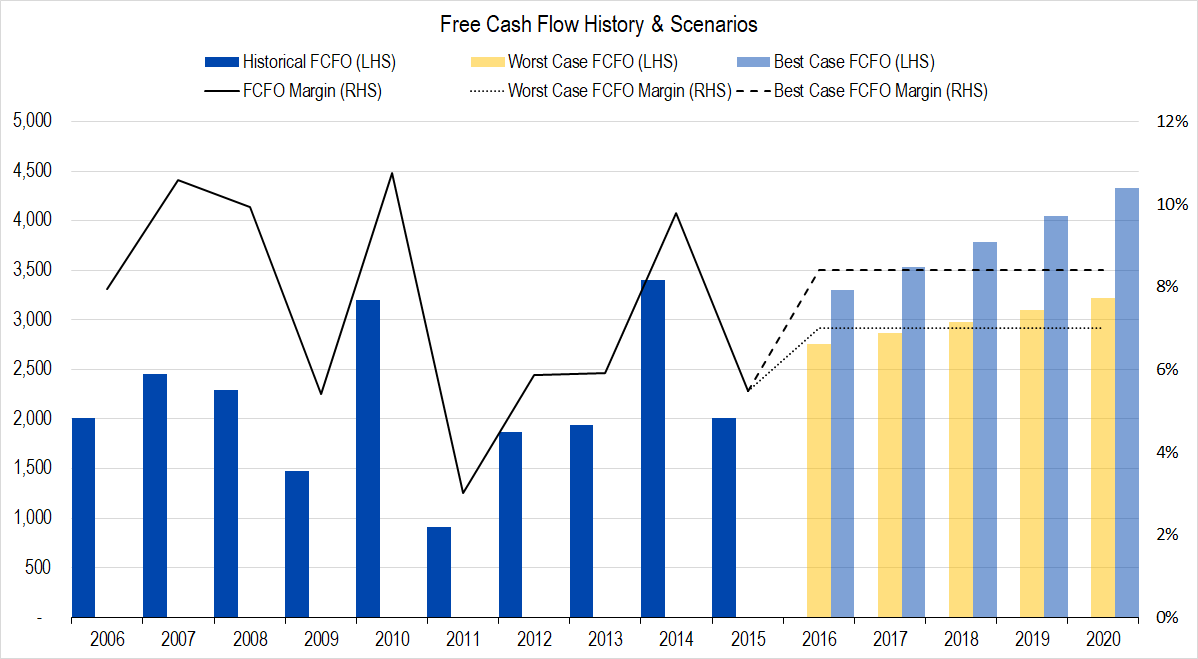
Figure 4. Source: Company Statements, Framework Investing Analysis and Projections
Historically, Free Cash Flow to Owners has totaled about $0.05 of every dollar of revenues, though in good years, that figure moves up to around $0.08 of FCFO per revenue dollar. Our forecasts give the company the benefit of the doubt and assume that the company will be able to consistently generate around $0.08 of FCFO / $1 of revenues.
Investment Efficacy
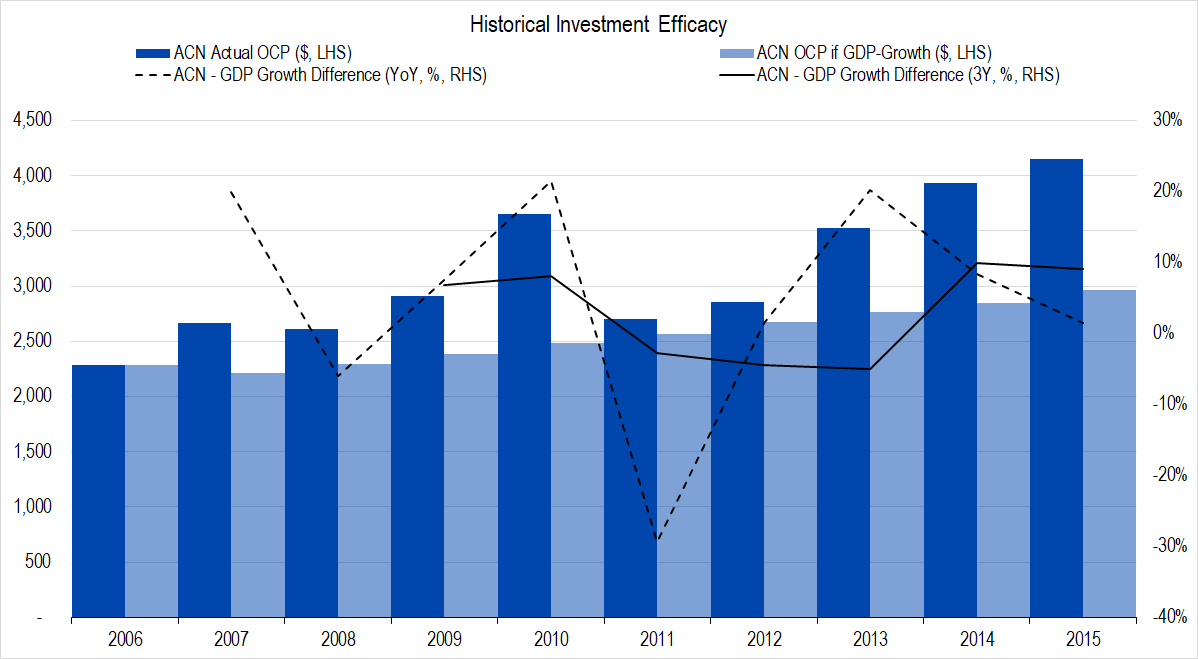
Figure 5. Source: Company Statements, Framework Investing Analysis
The company has generally done a good job of finding investment projects that will allow its profits to grow more quickly than the economy at large. Over the past 10-year period, five-year rolling OCP growth rates have ranged from 1% to 7% per year, the higher number being an artifact of quick profit growth post-Great Recession.
We have again given the firm the benefit of the doubt and forecast medium-term (years 6-10) profit growth to be between 5% and 7%.
Valuation
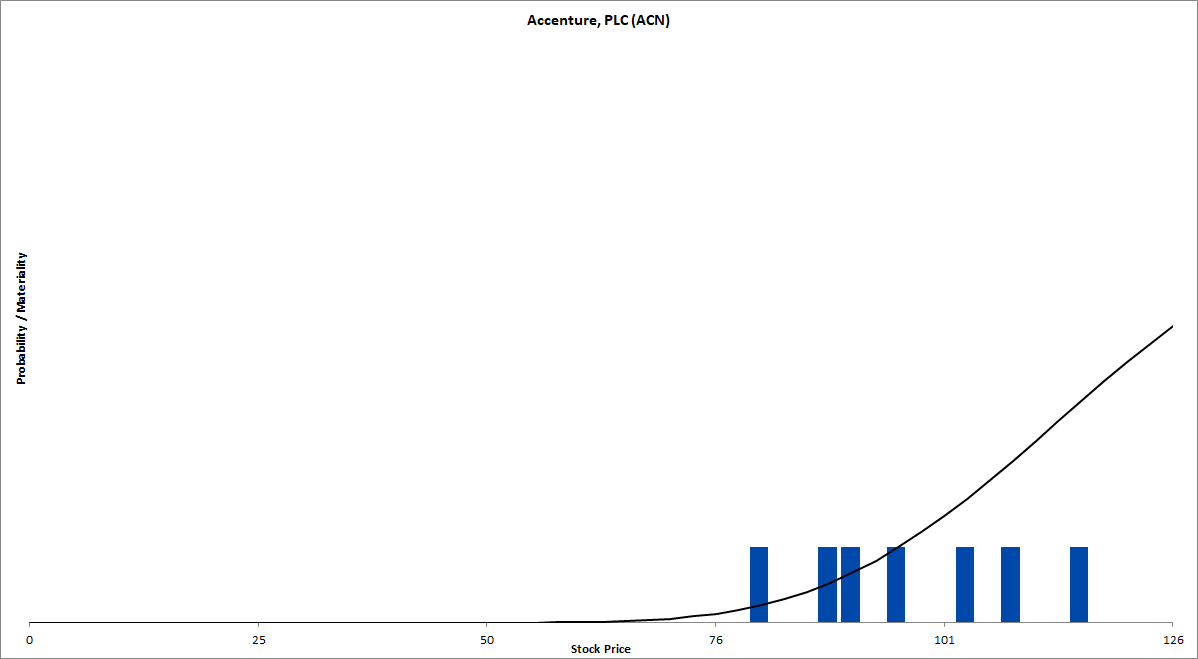
Figure 6. Source: CBOE, Framework Investing Analysis
Even though the value drivers are pretty predictable and we have given the firm the benefit of the doubt in several crucial areas, the highest valuation scenario shows a value of $116 / share, roughly $35 below the stock’s present price. The average of all our valuation scenarios is just under $100 per share. In general, this price level was last seen at the end of 2016 — just prior to the run-up from the Trump rally.
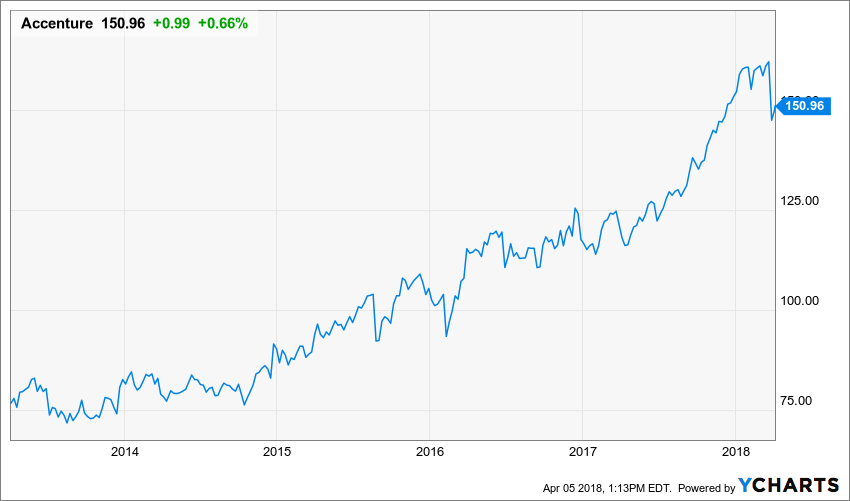
Figure 7.
We discount our forecasts for future cash flows at a rate of 10%. Were one to discount our forecasted future cash flows at 9%, the highest valuation jumps to $146 per share, with an average value of $121 per share.