While Oracle’s stock price was falling today, I was taking a look back at our valuation model, comparing the firm’s actual results to what we had forecast in the model we were using to recommend a high-conviction Levered Long and high-conviction Bond Replacement investments in the firm in late 2015.
Oracle’s actual results over the past few years have been very close to our forecasted ones — the charts showing this are below — and a simple extrapolation of our older model’s drivers make Oracle look fair valued right now.
However, as I mentioned in a Valuation update in March 2017, the firm had announced a bold strategy involving an “Infrastructure-as-a-Service” (IaaS) challenge to Amazon’s cash cow, Amazon Web Services (AWS). As I dug further into the numbers, I was started by what I found — in a good way. I want to do some more reading on this, but suffice it to say, that today’s large negative reaction might wind up providing an excellent opportunity to long time horizon investors. You can find the materials related to yesterday evening’s earning announcement (as well as those for prior announcements) on Oracle’s Investor Relations Events page.
I will write a more detailed note after finishing my research. For the time being, below is a summary of our older valuation model’s drivers versus Oracle’s actual results.
Revenues
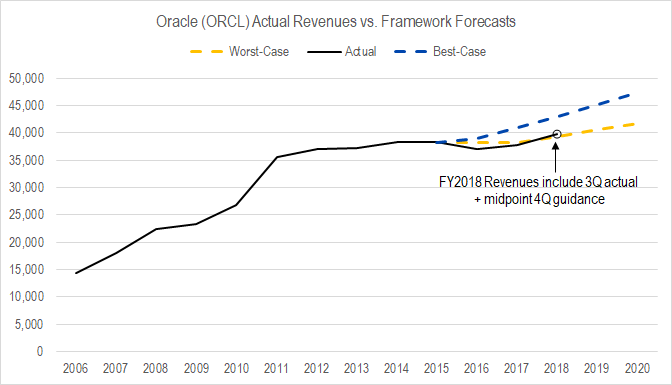
Figure 1. Source: Company Statements, Framework Investing Analysis
Actual revenues have been scraping our worst-case forecasts. The commentary I read today all had to do with Oracle’s revenues and market disappointment about their growth rates. Looking at only this chart, I also was disheartened.
I will save it for my next note, but will say that, upon looking at a break down of the composition of the segment-level revenues that aggregate to create the chart above, I became more excited.
Owners’ Cash Profits
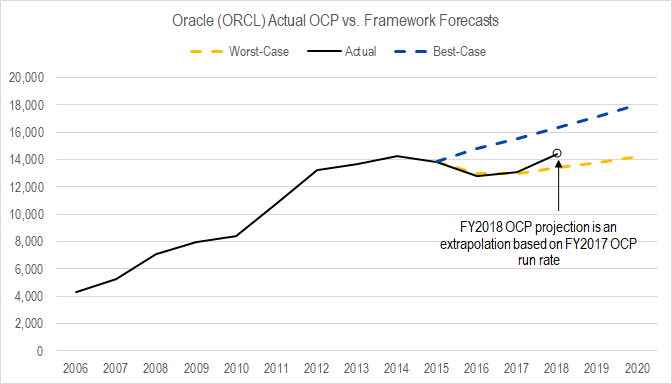
Figure 2. Source: Company Statements, Framework Investing Analysis
The most notable feature of this chart is the uptick in profitability that it looks like the firm will be able to generate in 2018. This was the first clue that there might be something more interesting happening in the revenues. The fact that actual revenues were hugging our worst-case projection, but that recent OCP has shot up from our worst-case profitability projections must mean that the company is generating operating leverage. That is good news.
Free Cash Flow to Owners
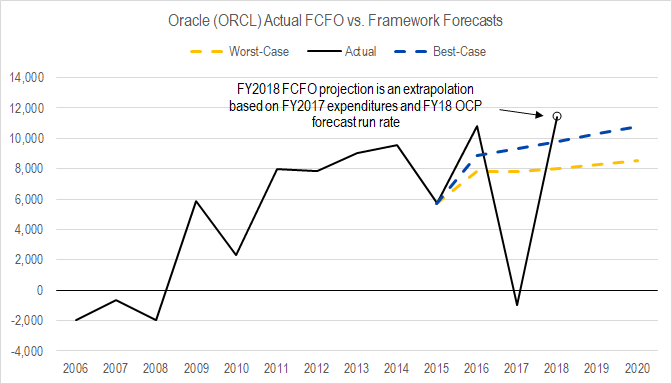
Figure 3. Source: Company Statements, Framework Investing Analysis
Oracle’s acquisition of Enterprise Resource Planning firm NetSuite in FY2017 (November 2016) is obvious in the graph above. Our FCFO projections are on a normalized basis, and I expect that any one year will be low or high, but that over time, my forecast should match up with actual. Indeed, looking at aggregate values, actual results are at least within the ballpark of our forecasts.

Figure 4. Source: Company Statements, Framework Investing Analysis
In total, these charts suggest that my valuation assumptions of a few years ago were fairly accurate, so I feel confident that I understand the firm well enough to value it. In my next post, I think I will be explaining why I think it is justified to raise my estimate of Oracle’s valuation range.
Stay tuned!